Save 23% ($351) & Get a Free 1-1 Call with our Team ⏰ : 0d 2h 59m 44s

Disclaimer: This analysis is for informational purposes only and not financial advice.
TLDR:
- BTC: Hit $100k–$102k target. Neutral to bullish with critical support at $100k, downside risk to $93k if lost.
- ETH: Bearish below $3,500. Watching for reclaim or new lows—remains neutral.
- SOL: Sits mid-range, still neutral. Must break $163 to flip bullish or risk breakdown to $120.
BTC:
Update on our Nov 3rd forecast: BTC moved exactly to our $100k-$102k target zone as predicted. However, the bounce from this level has been weaker than we'd typically expect for a confirmed reversal, which is why we're maintaining a cautious stance.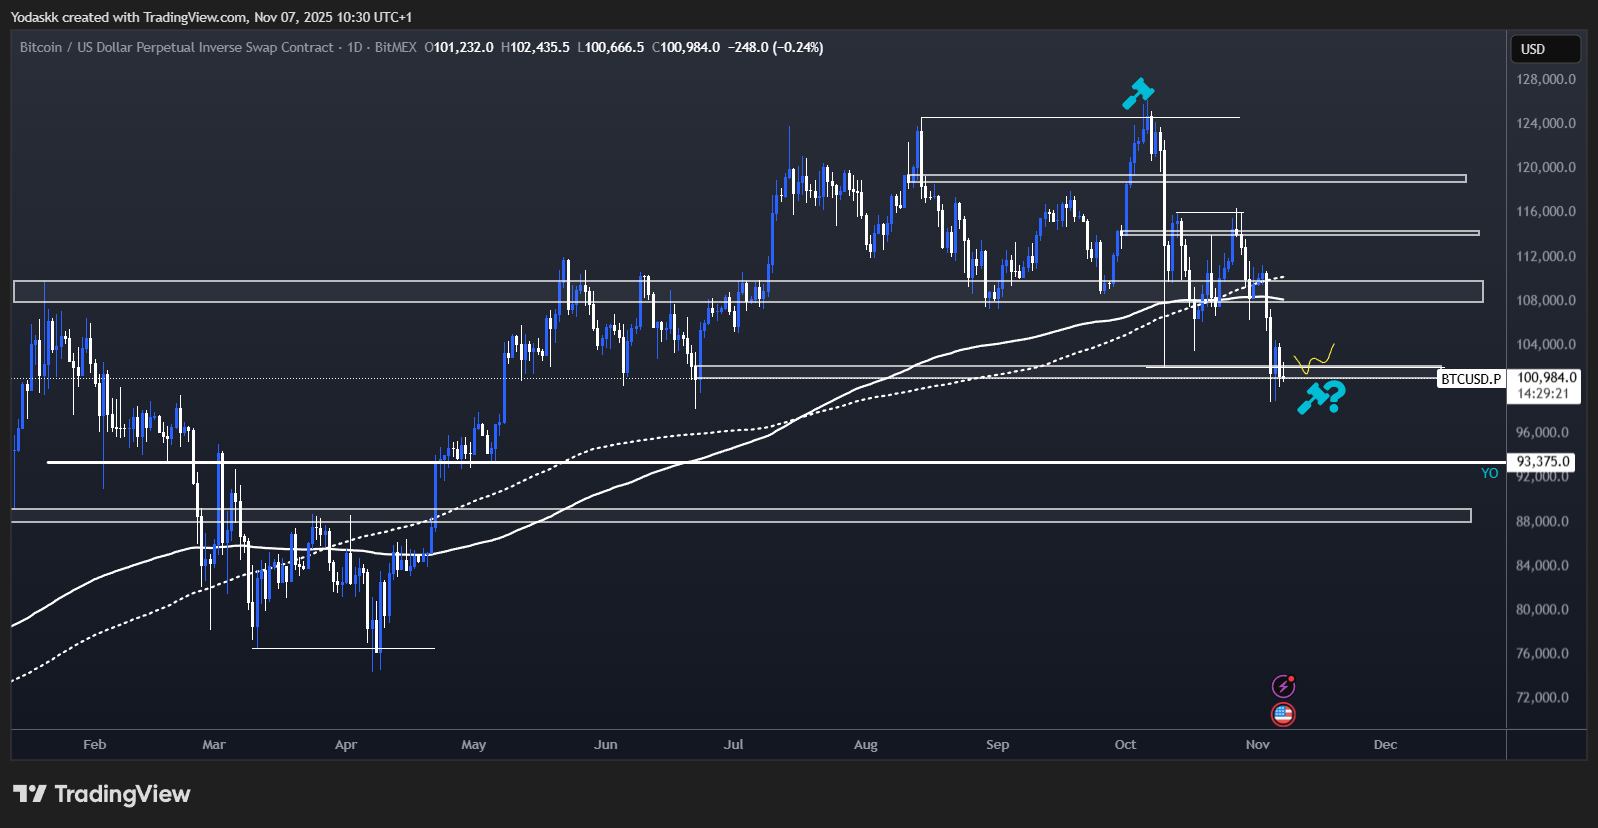
Technical analysis
-
- Price Range: $100,000 – $109,000
- Bias: Neutral to Bullish
- INCREASE positions if BTC holds $100k. BUY $93k if we get there.
- Resistance: $108,000 – $110,000
- Current Support area: $100,000 – $102,000
- Breakdown Trigger: $98,000
- Next Support in case of Breakdown: $93,000
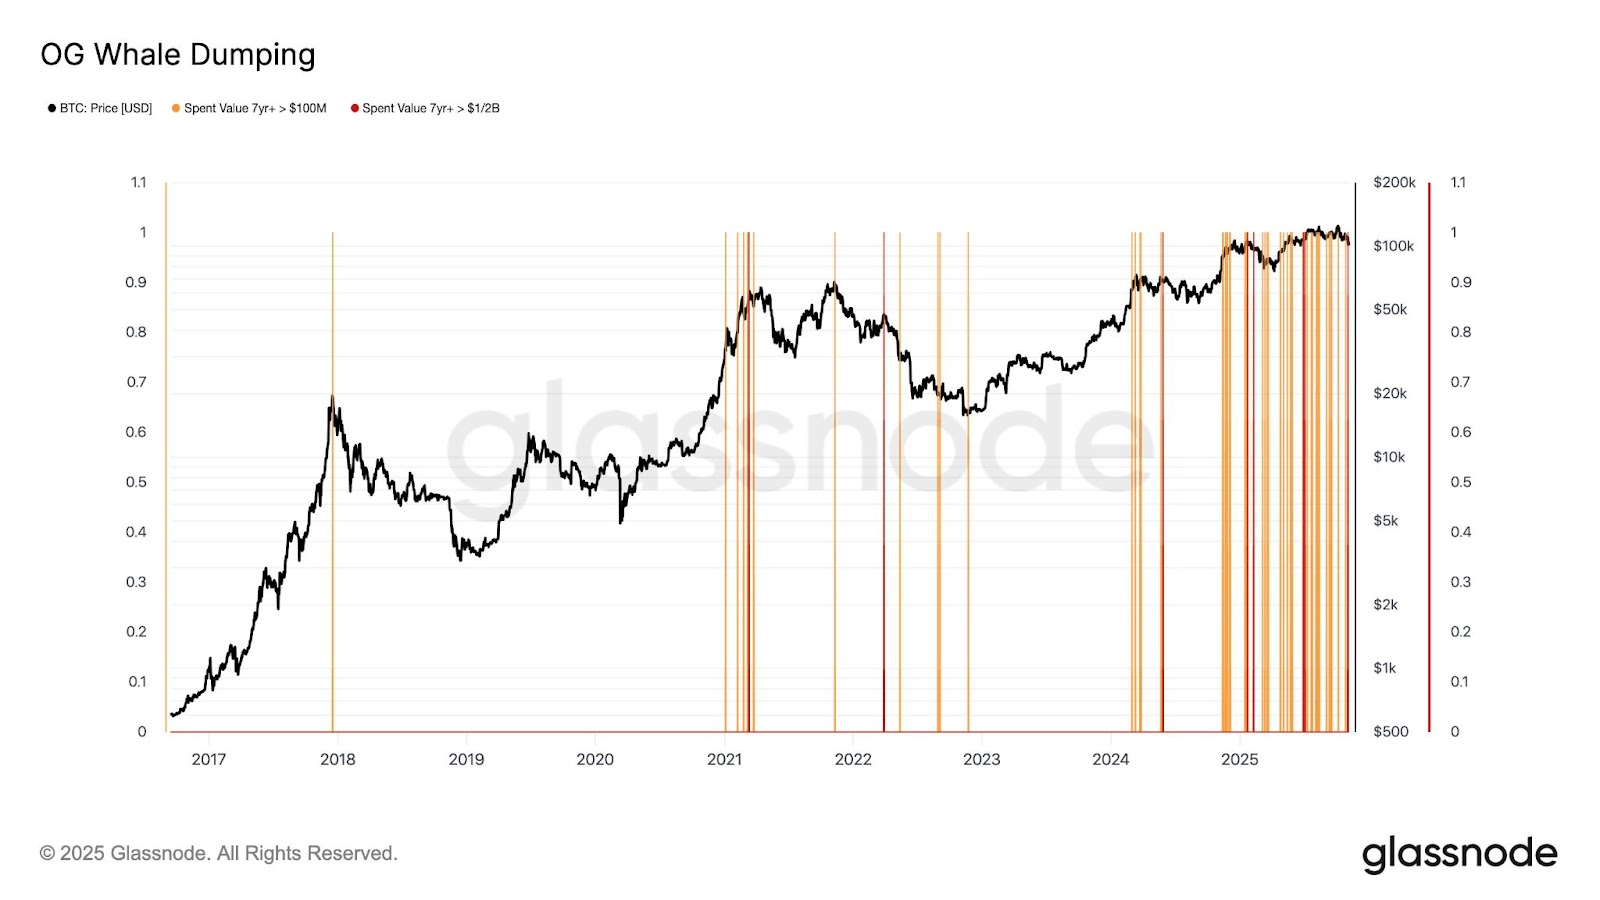
One thing to note, we get strong OG Whale Dumping when BTC is above $100k, which happened the entire year, and is a bearish force on BTC.
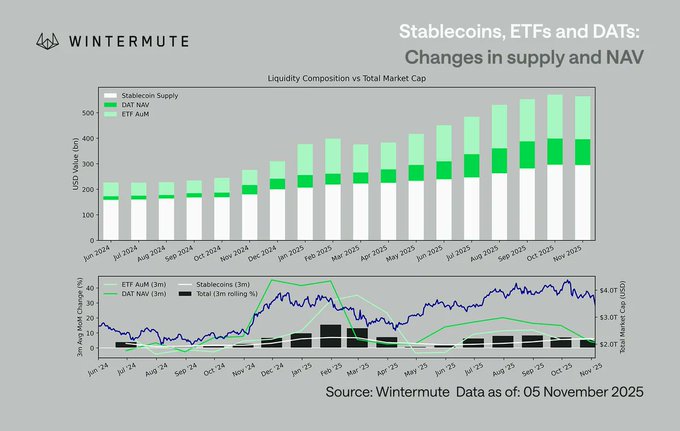
To compensate for those bearish flows, we were having bullish flows from DATs, ETF, and Stablecoins, which made BTC overall flat on the year.
But, as shown in the next chart from Wintermute, those bullish flows from Stablecoins + DATs + ETFs are now decreasing from the previous month for the first time since March.
This helps explain WHY we finally broke down to $100k after months of consolidation: the OG whale selling finally overwhelmed the institutional buying that had been supporting price.
The key question now: Will institutional flows resume at these lower levels? That's what we're monitoring daily (see our Market Update for detailed flow analysis).
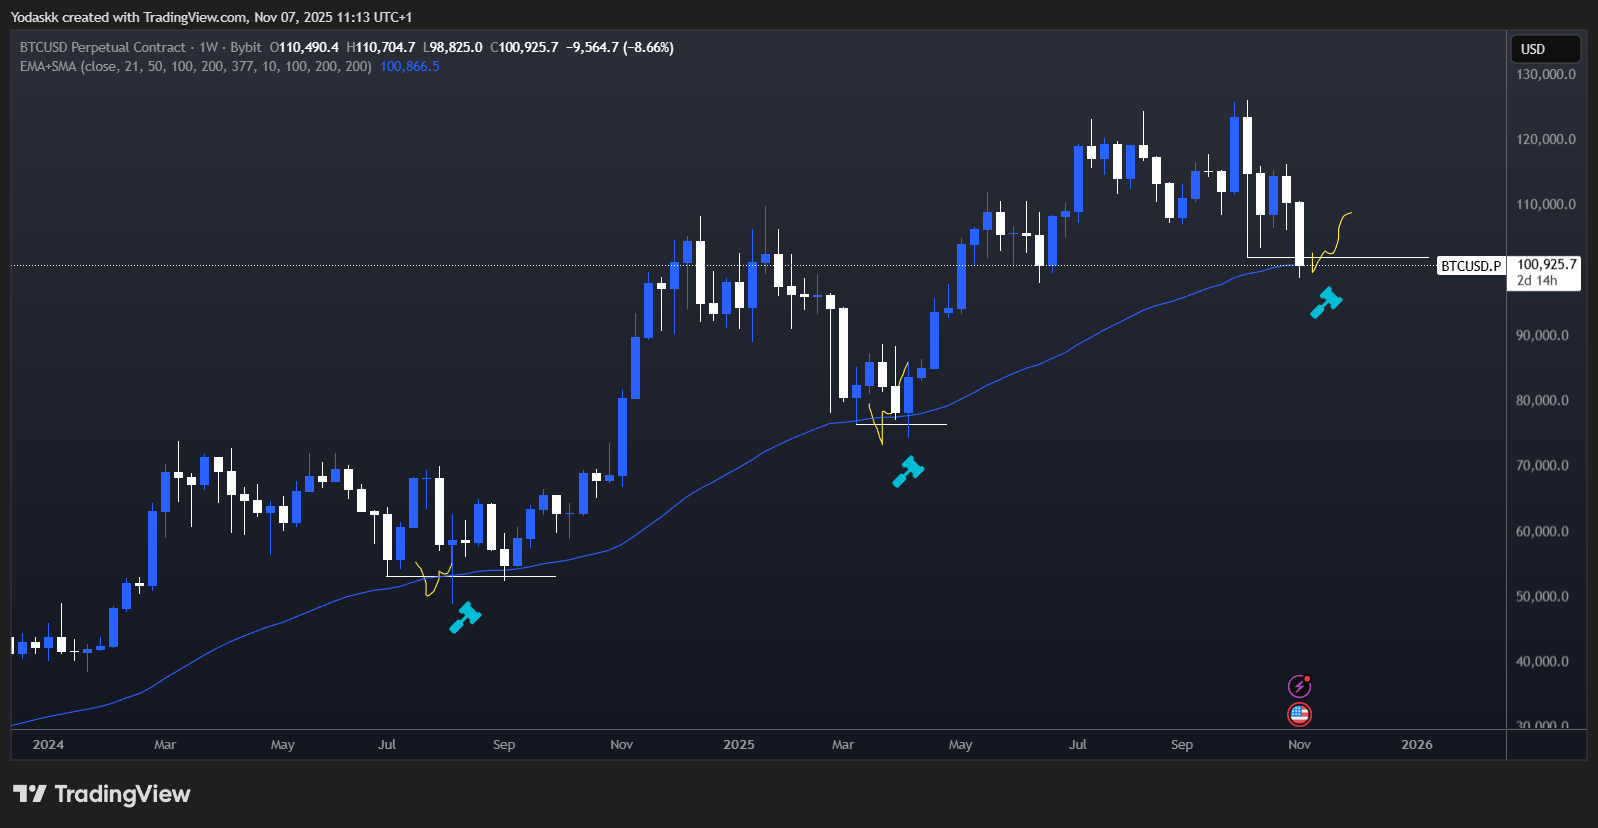
On the weekly chart, the 3 previous big corrections BTC had since its 2022 lows always followed this playbook:
- Form a low
- SFP (Swing Failure Pattern) of the previous low while retest the Weekly 50 EMA
- Continuation of the uptrend
A close below the weekly 50 EMA at $100,800 would be the first time since September 2023 and an important change in BTC behavior.
Liquidity Analysis: Supporting the Bullish Case
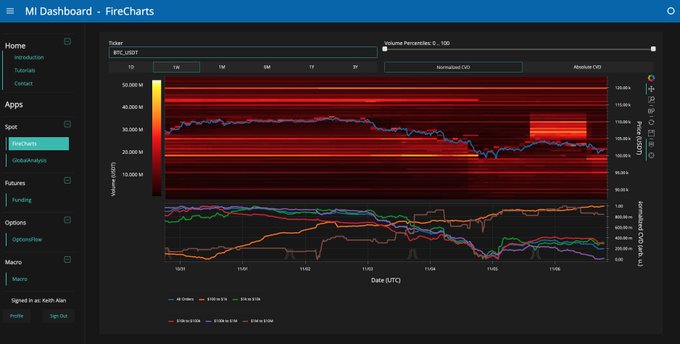
Looking at the BTC order book heatmap reveals interesting manipulation dynamics:
- Fake Seller Pressure: A large wall of sell orders appeared between $104k-$100k that "walked" price down, then mysteriously disappeared. This wasn't organic selling: someone wanted to push BTC lower WITHOUT getting filled (classic whale accumulation tactic).
- Real Buyer Interest: Meanwhile, a substantial new wall of bids has appeared down to $95k, showing genuine demand at these levels.
What is a BTC heatmap? It shows where large buy and sell orders (liquidity walls) sit across price levels. Bright colors (like red, yellow, orange) represent high concentrations of limit orders, meaning areas where many traders are looking to buy or sell. These zones often act as support (buy walls) or resistance (sell walls) and can influence short-term price action.
What Would Invalidate Our Neutral to Bullish Near-Term View?
We’d reconsider our $108k-$110k target if we see:
*Technical Signals:*
- BTC breaks and closes below $98k on daily chart
- Volume confirms breakout
- Weekly close below weekly 50 EMA
- ETF inflows continue to stay negative for 3+ consecutive days
- DXY continuation above $100- $101
- Fed speakers adopt decisively hawkish tone
- Government shutdown drags on
For detailed flow analysis and what catalysts would bring institutional buyers back, see our Market Update (published today).
ETH:
- No immediate bullish reversal; ETF demand weak, technicals bearish beneath $3,500 zone.
- Waiting for structural shift: must reclaim $3,800–$3,900 key level to restore bullish case.
Technical analysis
-
- Price Range: $2,800 – $3,900
- Bias: Neutral
- Wait for a $3,500 break to add, or $2,800 dip to buy.
- Resistance: $3,800- $3,900
- Support Zone: $2,800
- Breakdown Trigger: $3,200
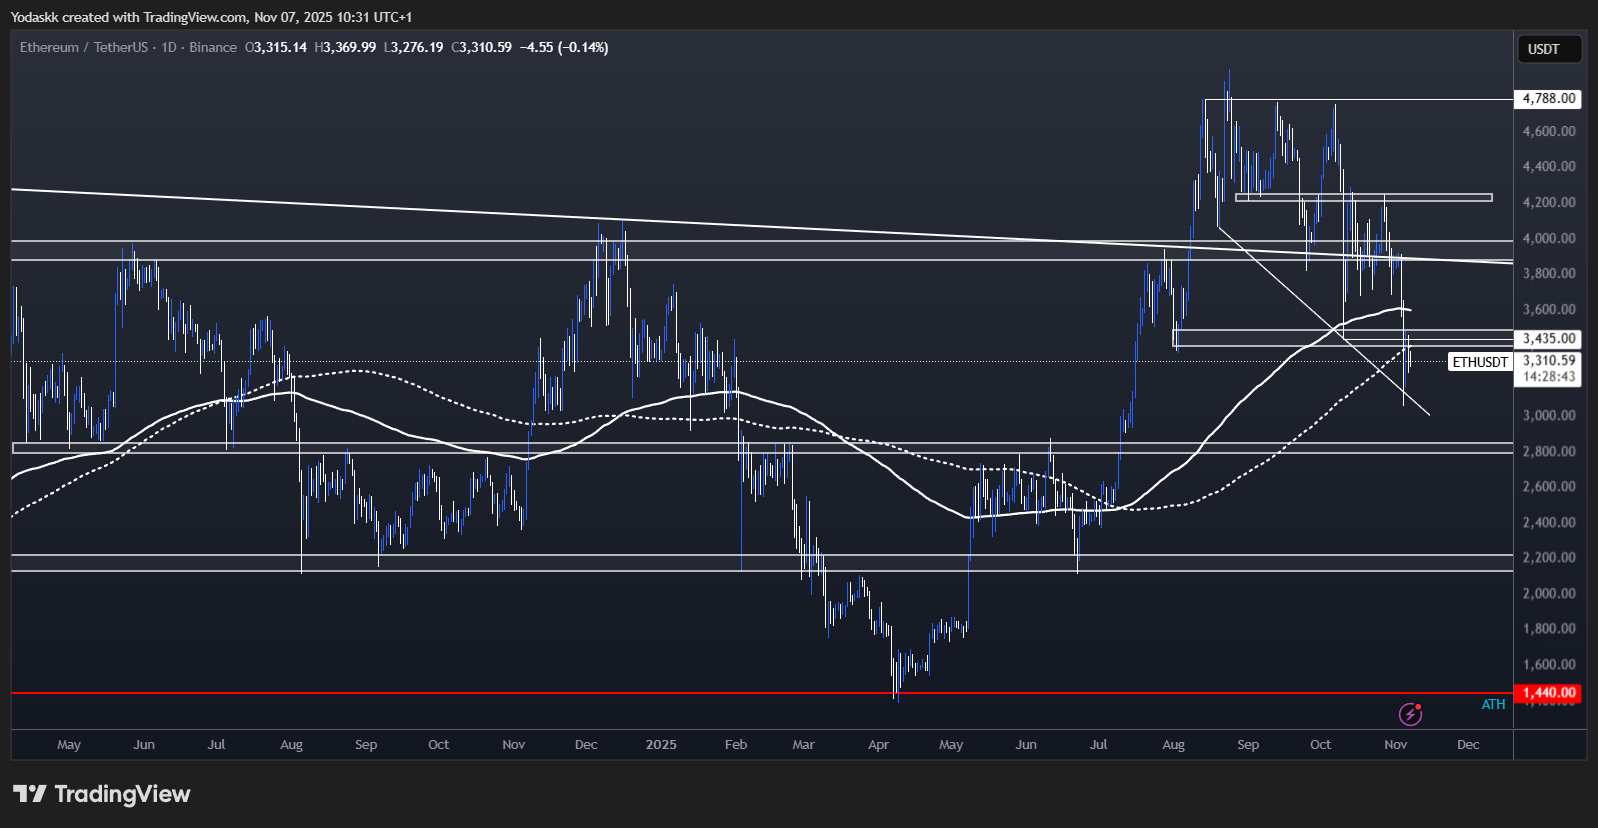
To be bullish again, ETH needs to get above the resistance at $3,800- $3,900.
Breaking the $4,250 resistance zone would make ETH very bullish again, opening the path to All Time Highs.
Until this happens, ETH is locally more bearish than BTC as it currently stands just below the daily Breaker Block at $3,400- $3,500 (breaker blocks are formed when an orderblock is invalidated),below the 200-Day SMA+EMA, below the Yearly Open at $3,338, and below the wick low from the Oct 10th crash.
A break above $3,500 and we could target the Key Level at $3,800- $3,900.
Staying too long below $3,400- $3,500 and a close below $3,200 would give more credit to the bearish thesis and we would target $2,800 as the next support.
SOL:
- OI and funding normalizing; OI flushes as downtrend persists past September’s high.
- Price sits mid-range ($153), bearish until reclaiming $158–$163 breaker block.
Technical analysis
- Price Range: $120 – $190
- Bias: Neutral
- Add if breaks $163, or if dips to $120.
- Resistance: $185 – $190
- Support Zone: $120 – $125
- Breakdown Trigger: Break below $150
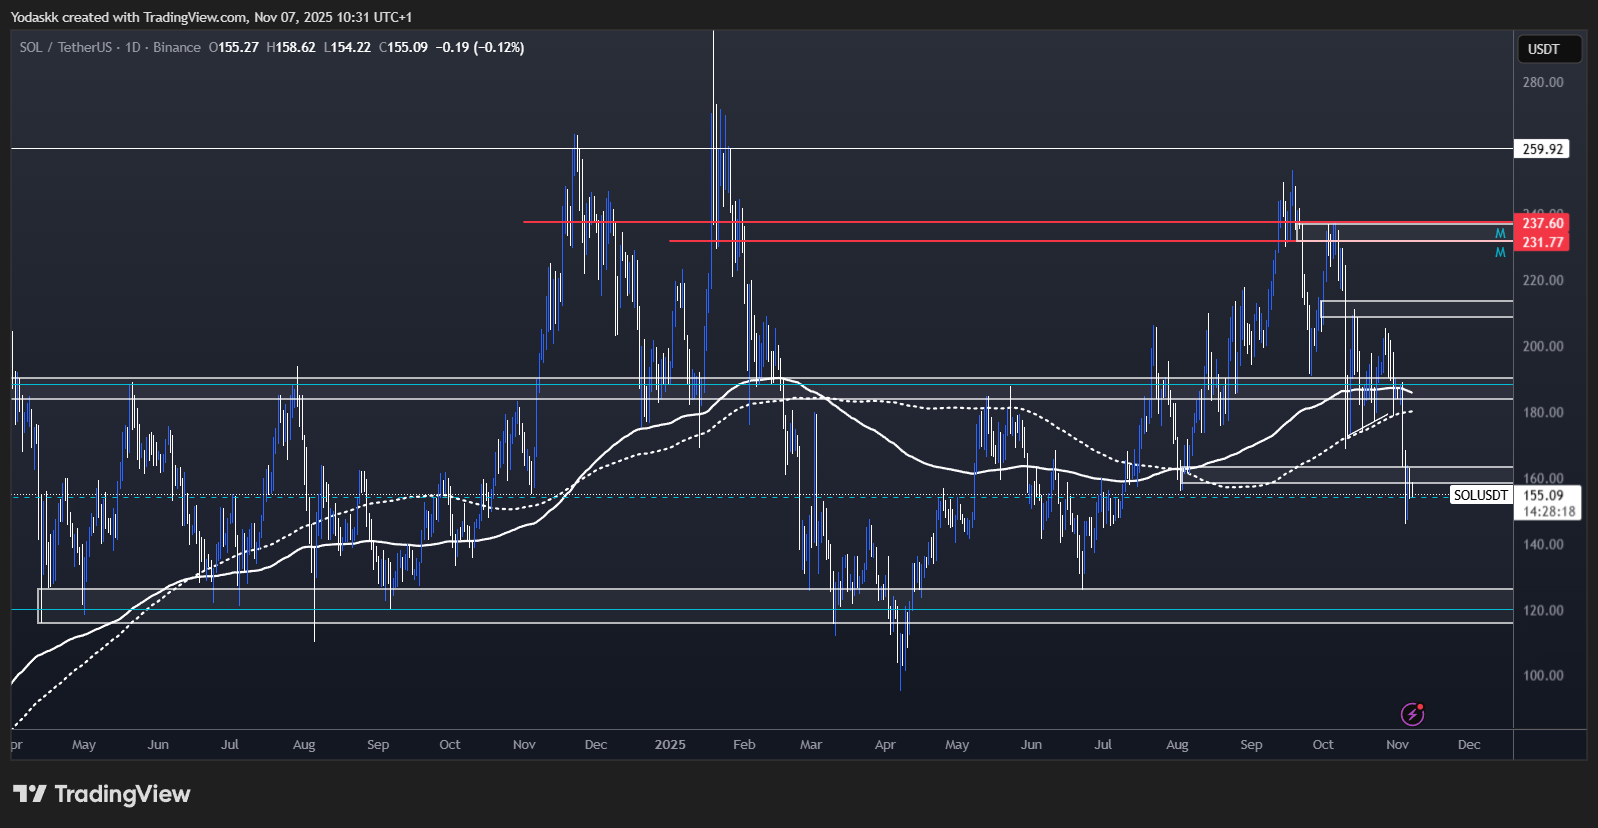
SOL broke down back into the $120- $190 range and is currently sitting exactly on the mid-range at $153.
To be bullish again, SOL needs to reclaim above $190.
Until this happens, SOL is locally more bearish than BTC as it currently stands just below the daily Breaker Block at $158- $163 (breaker blocks are formed when an orderblock is invalidated), and below the wick low from the Oct 10th crash.
A break above $163 and we would target the top of the range around $185 – $190.
Staying too long below $158- $163 and a close below $150 would give more credit to the bearish thesis and we would target $120 – $125 as the next support, which is the bottom of the weekly range and also the 200-Week EMA.
Cryptonary’s Take
Following our Nov 3rd Market Direction, BTC moved precisely to our $100k-$102k target zone (orderblock + SFP zone + Weekly 50 EMA confluence). This validates our technical framework.However, the bounce mechanics are concerning. For a confirmed Swing Failure Pattern, we need to see:
- Decisive daily closes above $102k (not yet achieved)
- Volume-confirmed reversal (currently lacking)
- Multiple rejections of the $100k level showing strong support
- Historical precedent (3 previous corrections followed this exact playbook)
- Weekly 50 EMA alignment (critical support)
- November seasonality (most bullish month historically)
Action: If you haven't added at $100k-$102k yet, wait for confirmation:
- Option A: Wait for a daily close above $108k-$110k (breakout confirmed)
- Option B: Scale in at $100k if we hold the retest with strong volume
"Risk Management Framework:
- Conservative: Wait for $108k-$110k break to confirm reversal (lower risk, lower return)
- Moderate: Scale 25-30% here at $100k-$102k if we hold through weekly close
- Aggressive: Only if you have 3+ year time horizon and can stomach potential lower retest
Rate cuts continuing, QT ending December 1st, and improving US-China relations support our $125k-$135k year-end target.
For institutional flow data, ETF tracking, and macro catalysts: See Tom's Market Update published today.
Patience here should be rewarded by the end of Q4 2025.
*This Week’s Key Monitoring Points (Nov 7-14):*
Daily Checklist:
□ Is BTC holding $100k or breaking toward $93k?
□ ETF flows - any reversal to positive?
□ S&P 500 & NASDAQ - continuation of pullback?
□ DXY - is 100-101 still resistance?
Critical Levels This Week:
- BTC below $98k = $93k target becomes active
- BTC above $108k-$110k = bearish thesis invalidated
- ETF flows positive 2+ days = institutions returning (see Market Update for flow analysis)
- DXY above 101 = continued dollar strength headwind
- Fed speaker increase hawkishness
- Government shutdown drags on
- Major BTC whales offloading
- China stimulus delays
Thanks for reading!
*These levels are valid through Sunday, November 9th. Fresh analysis next Monday.*
Recommended from Cryptonary


