Save 23% ($351) & Get a Free 1-1 Call with our Team ⏰ : 0d 2h 59m 43s
Disclaimer: This analysis is for informational purposes only and not financial advice.
TLDR:
- BTC: Hit $100k–$102k target. Neutral to bullish with critical support at $100k, downside risk to $93k if lost.
- ETH: Bearish below $3,500. Watching for reclaim or new lows—remains neutral.
- SOL: Sits mid-range, still neutral. Must break $163 to flip bullish or risk breakdown to $120.
BTC:
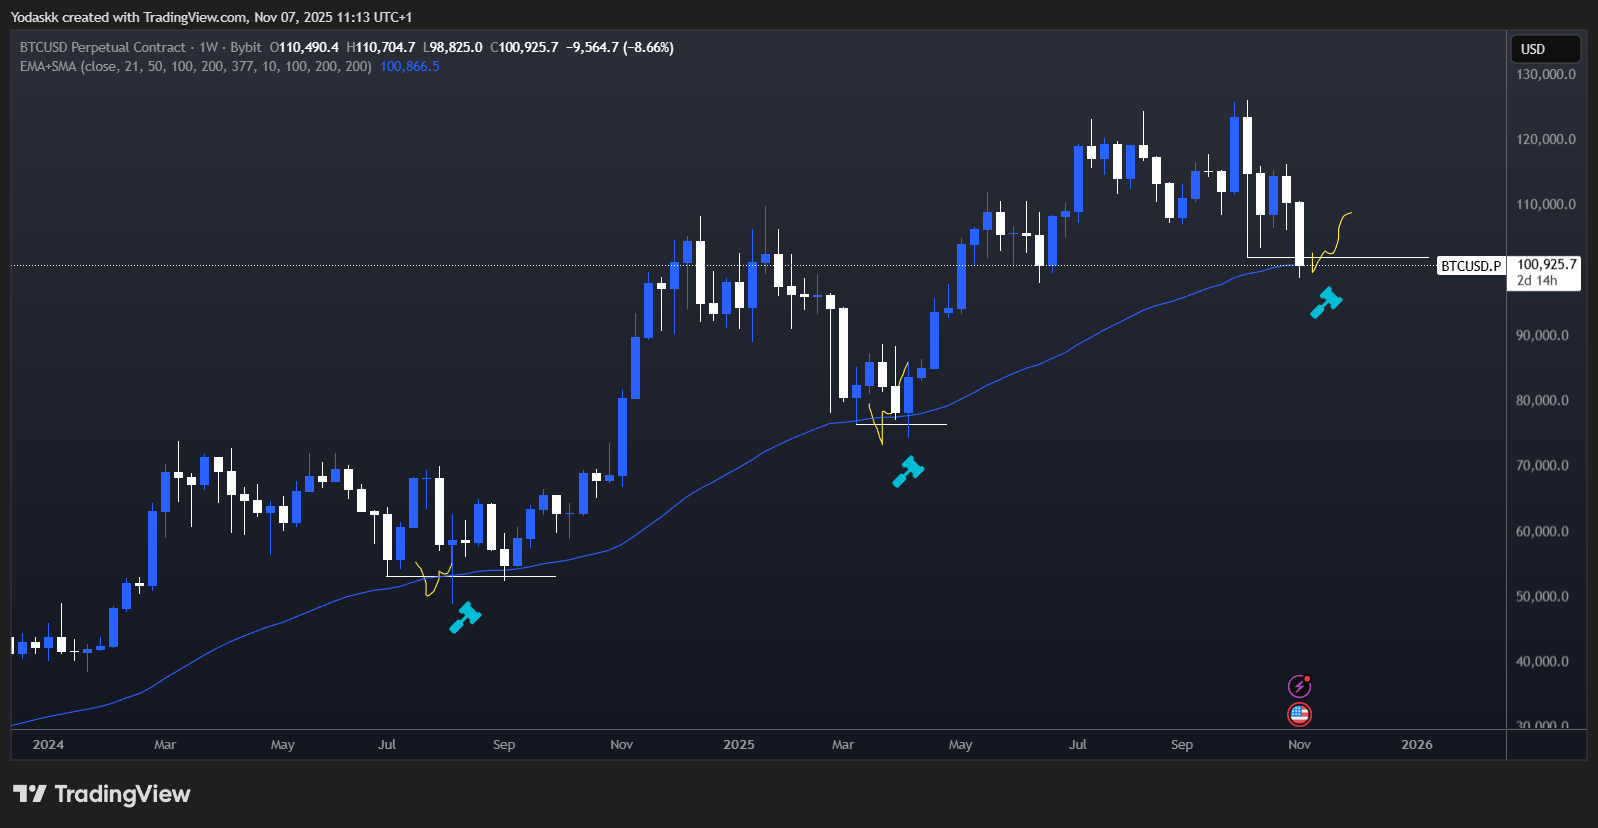
Update on our Nov 3rd forecast: BTC moved exactly to our $100k-$102k target zone as predicted. However, the bounce from this level has been weaker than we'd typically expect for a confirmed reversal, which is why we're maintaining a cautious stance.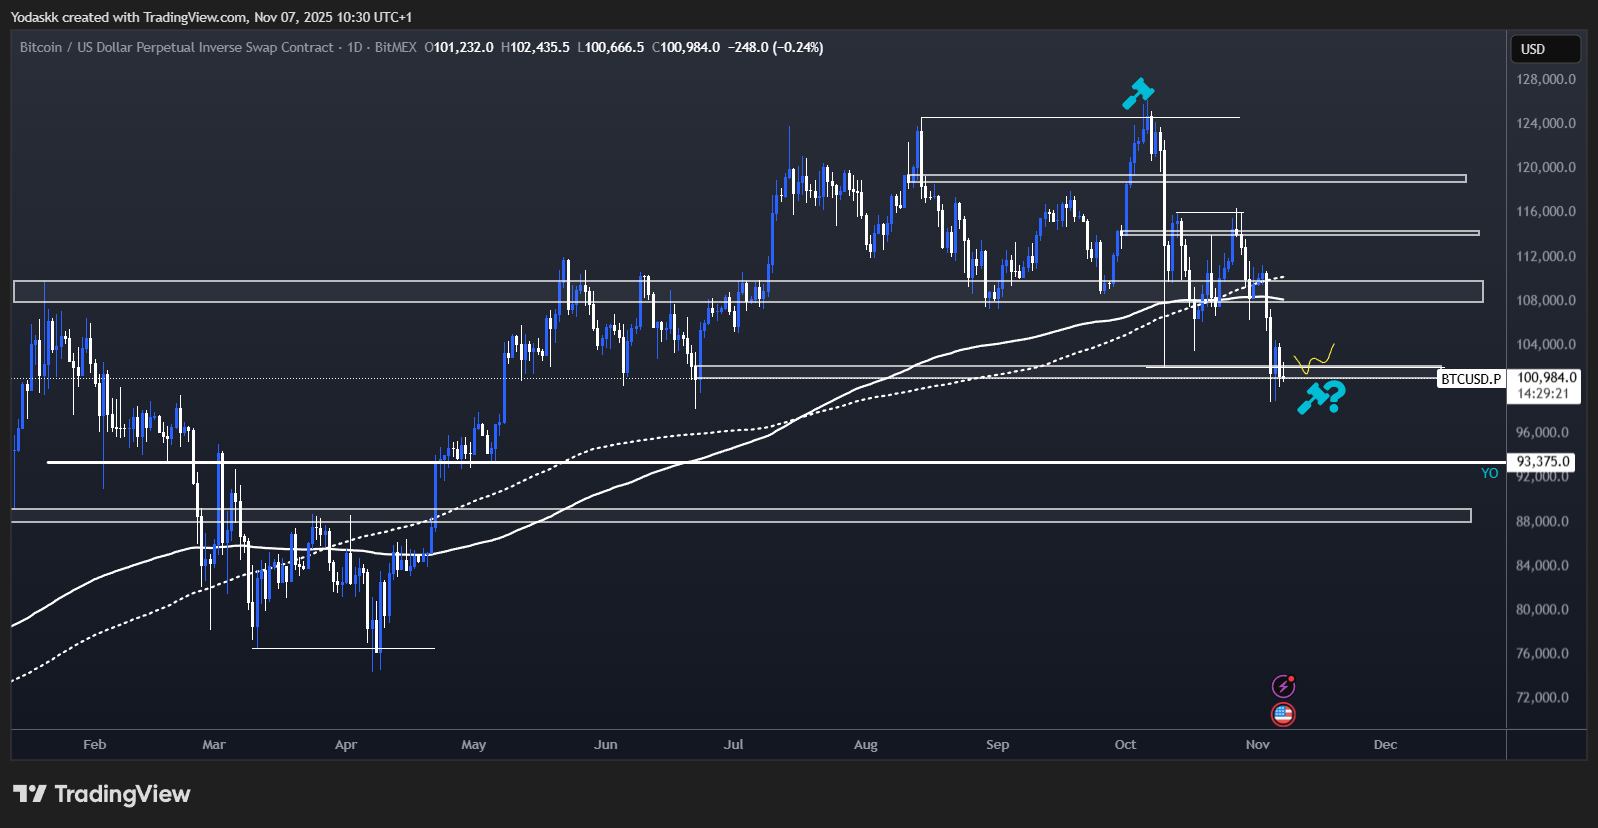
Technical analysis
-
- Price Range: $100,000 – $109,000
- Bias: Neutral to Bullish
- INCREASE positions if BTC holds $100k. BUY $93k if we get there.
- Resistance: $108,000 – $110,000
- Current Support area: $100,000 – $102,000
- Breakdown Trigger: $98,000
- Next Support in case of Breakdown: $93,000
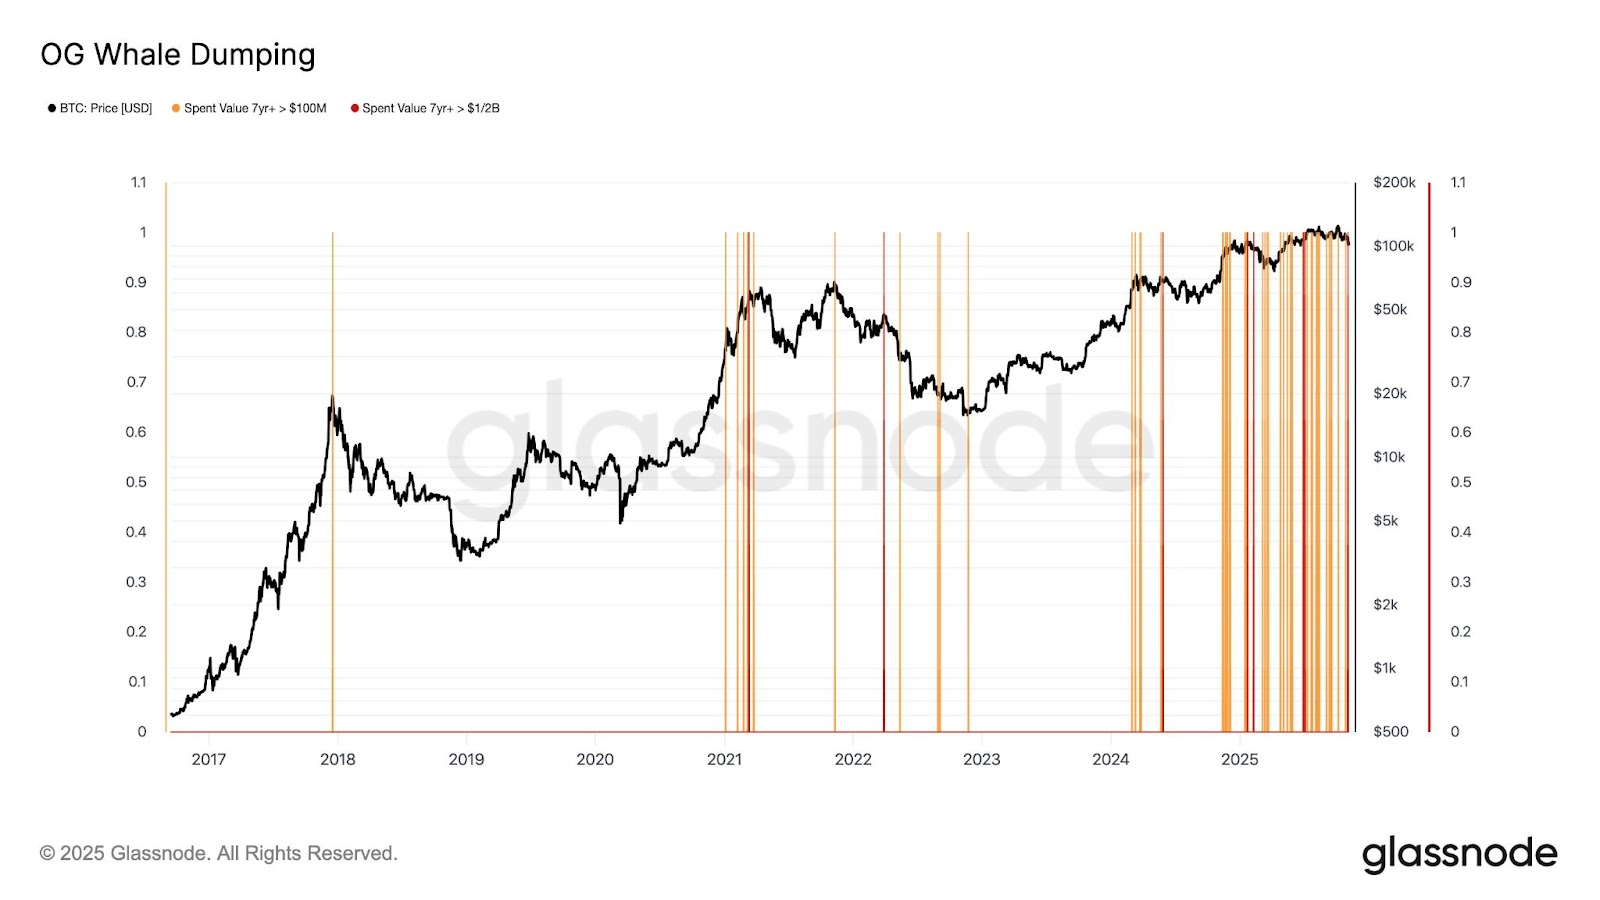
One thing to note, we get strong OG Whale Dumping when BTC is above $100k, which happened the entire year, and is a bearish force on BTC.
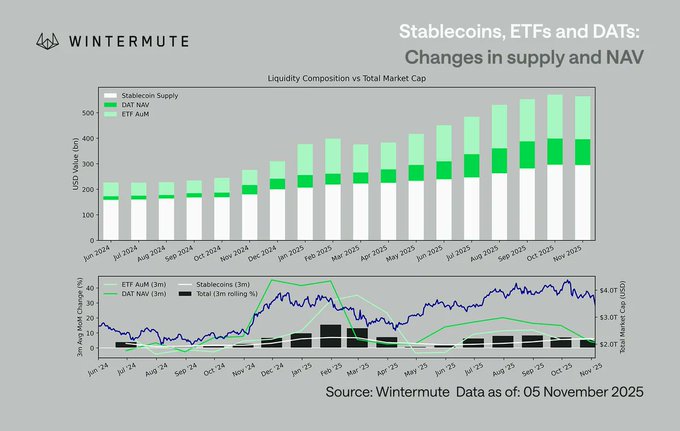
To compensate for those bearish flows, we were having bullish flows from DATs, ETF, and Stablecoins, which made BTC overall flat on the year.
But, as shown in the next chart from Wintermute, those bullish flows from Stablecoins + DATs + ETFs are now decreasing from the previous month for the first time since March.
This helps explain WHY we finally broke down to $100k after months of consolidation: the OG whale selling finally overwhelmed the institutional buying that had been supporting price.
The key question now: Will institutional flows resume at these lower levels? That's what we're monitoring daily (see our Market Update for detailed flow analysis).
On the weekly chart, the 3 previous big corrections BTC had since its 2022 lows always followed this playbook:
- Form a low
- SFP (Swing Failure Pattern) of the previous low while retest the Weekly 50 EMA
- Continuation of the uptrend
A close below the weekly 50 EMA at $100,800 would be the first time since September 2023 and an important change in BTC behavior.
Liquidity Analysis: Supporting the Bullish Case
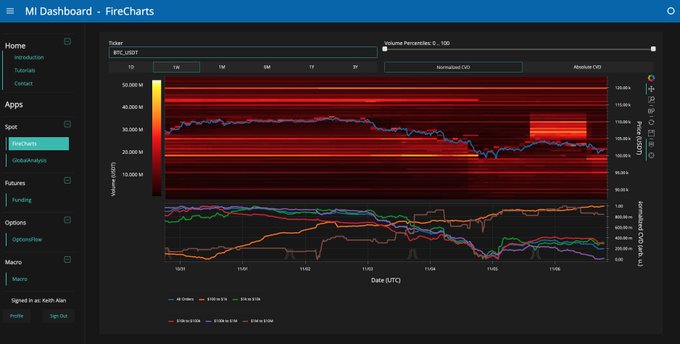
Looking at the BTC order book heatmap reveals interesting manipulation dynamics:
- Fake Seller Pressure: A large wall of sell orders appeared between $104k-$100k that "walked" price down, then mysteriously disappeared. This wasn't organic selling: someone wanted to push BTC lower WITHOUT getting filled (classic whale accumulation tactic).
- Real Buyer Interest: Meanwhile, a substantial new wall of bids has appeared down to $95k, showing genuine demand at these levels.
What is a BTC heatmap? It shows where large buy and sell orders (liquidity walls) sit across price levels. Bright colors (like red, yellow, orange) represent high concentrations of limit orders, meaning areas where many traders are looking to buy or sell. These zones often act as support (buy walls) or resistance (sell walls) and can influence short-term price action.
What Would Invalidate Our Neutral to Bullish Near-Term View?
We’d reconsider our $108k-$110k target if we see:
*Technical Signals:*
- BTC breaks and closes below $98k on daily chart
- Volume confirms breakout
- Weekly close below weekly 50 EMA
- ETF inflows continue to stay negative for 3+ consecutive days
- DXY continuation above $100- $101
- Fed speakers adopt decisively hawkish tone
- Government shutdown drags on
For detailed flow analysis and what catalysts would bring institutional buyers back, see our Market Update (published today).
ETH:
- No immediate bullish reversal; ETF demand weak, technicals bearish beneath $3,500 zone.
- Waiting for structural shift: must reclaim $3,800–$3,900 key level to restore bullish case.
Technical analysis
-
- Price Range: $2,800 – $3,900
- Bias: Neutral
- Wait for a $3,500 break to add, or $2,800 dip to buy.
- Resistance: $3,800- $3,900
- Support Zone: $2,800
- Breakdown Trigger: $3,200
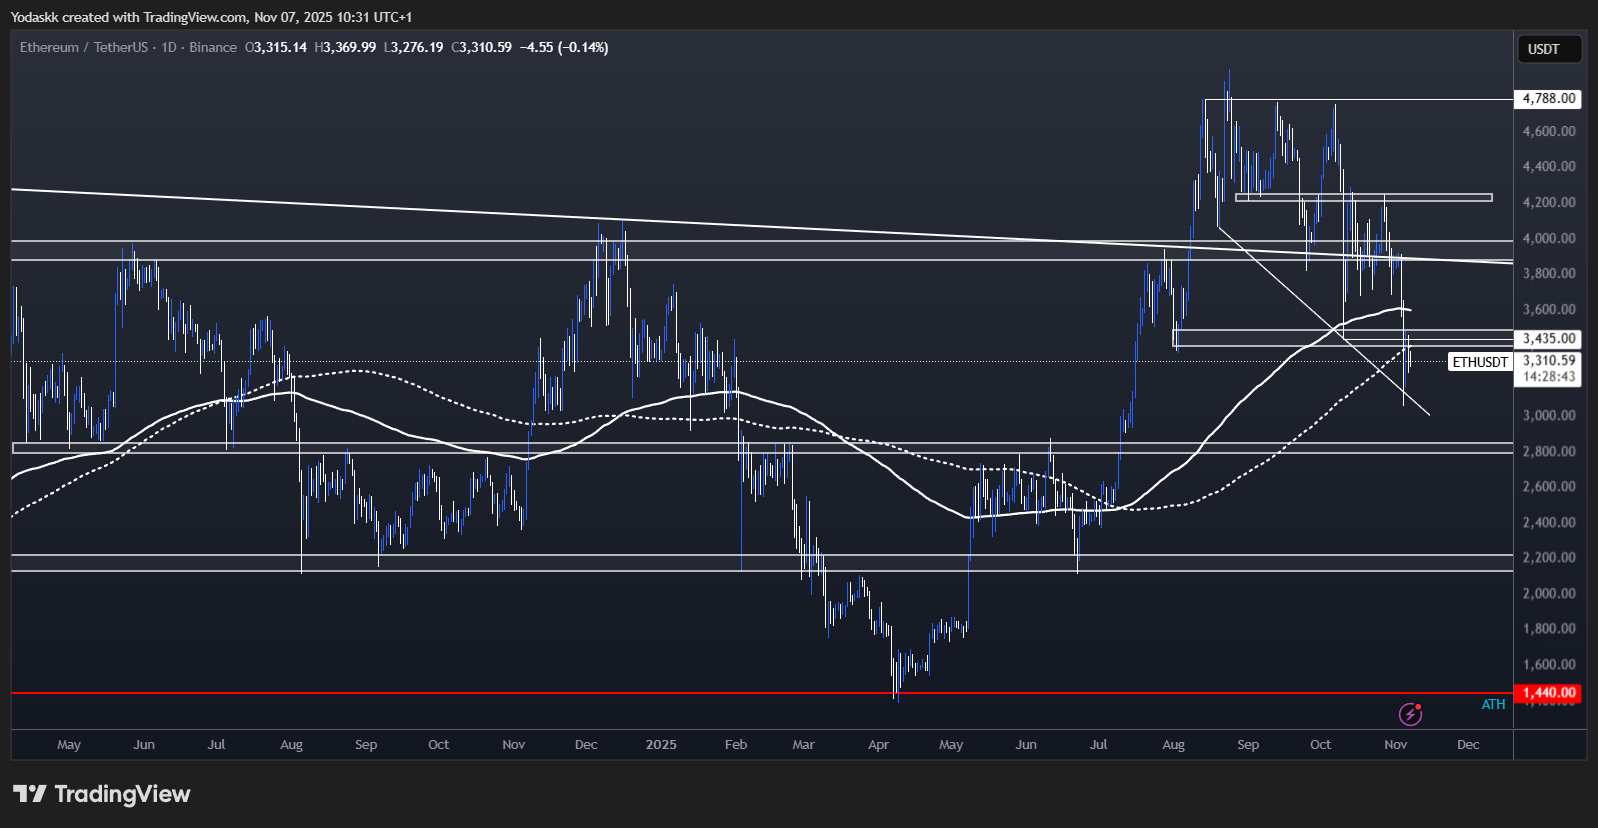
To be bullish again, ETH needs to get above the resistance at $3,800- $3,900.
Breaking the $4,250 resistance zone would make ETH very bullish again, opening the path to All Time Highs.
Until this happens, ETH is locally more bearish than BTC as it currently stands just below the daily Breaker Block at $3,400- $3,500 (breaker blocks are formed when an orderblock is invalidated),below the 200-Day SMA+EMA, below the Yearly Open at $3,338, and below the wick low from the Oct 10th crash.
A break above $3,500 and we could target the Key Level at $3,800- $3,900.
Staying too long below $3,400- $3,500 and a close below $3,200 would give more credit to the bearish thesis and we would target $2,800 as the next support.
SOL:
- OI and funding normalizing; OI flushes as downtrend persists past September’s high.
- Price sits mid-range ($153), bearish until reclaiming $158–$163 breaker block.
Technical analysis
-
- Price Range: $120 – $190
- Bias: Neutral
- Add if breaks $163, or if dips to $120.
- Resistance: $185 – $190
- Support Zone: $120 – $125
- Breakdown Trigger: Break below $150
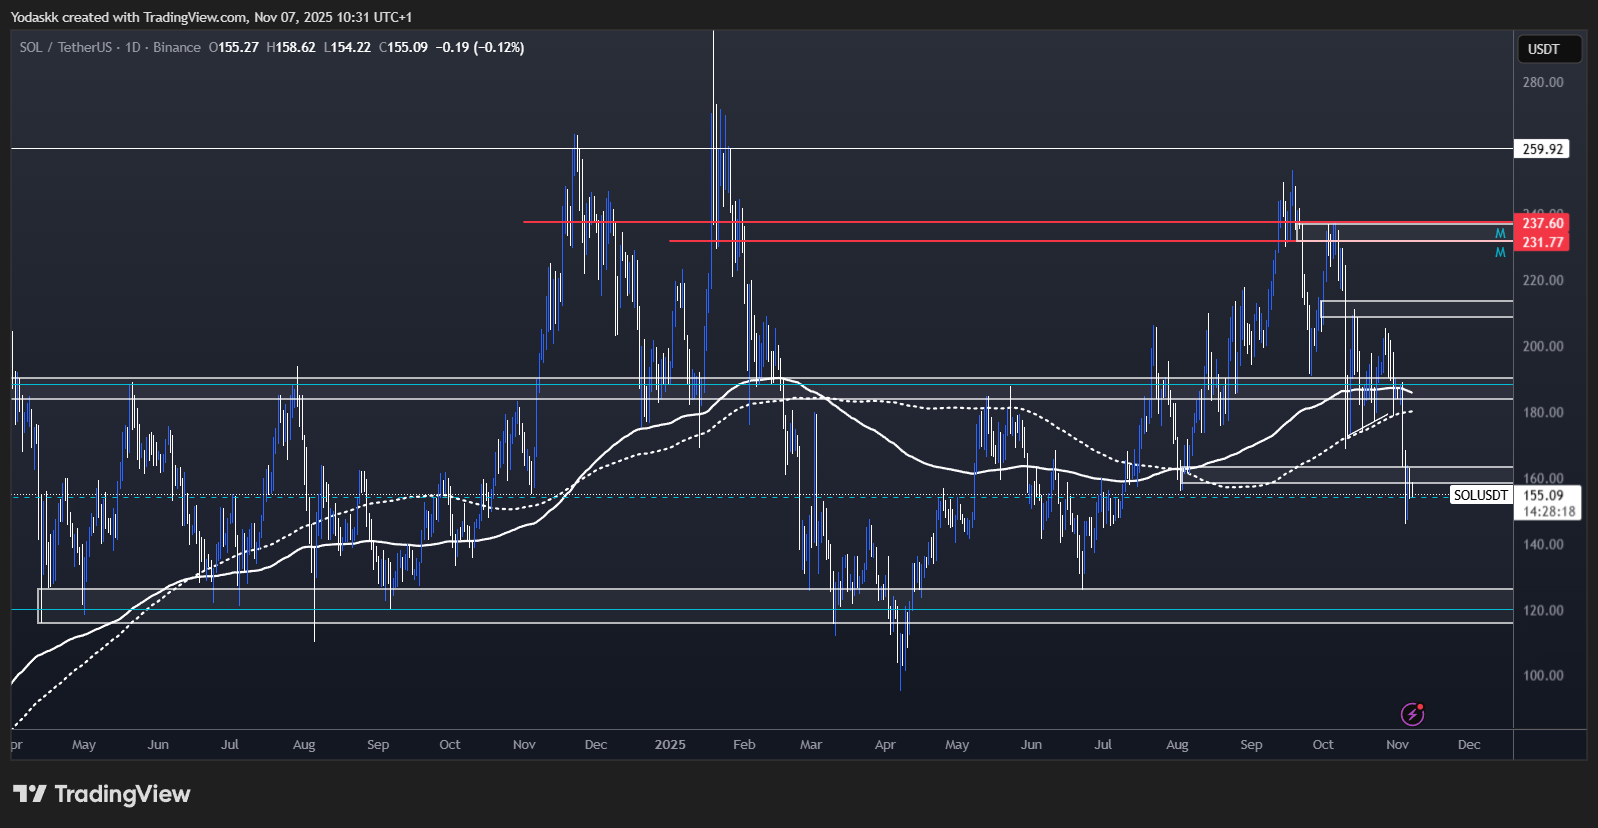
SOL broke down back into the $120- $190 range and is currently sitting exactly on the mid-range at $153.
To be bullish again, SOL needs to reclaim above $190.
Until this happens, SOL is locally more bearish than BTC as it currently stands just below the daily Breaker Block at $158- $163 (breaker blocks are formed when an orderblock is invalidated), and below the wick low from the Oct 10th crash.
A break above $163 and we would target the top of the range around $185 – $190.
Staying too long below $158- $163 and a close below $150 would give more credit to the bearish thesis and we would target $120 – $125 as the next support, which is the bottom of the weekly range and also the 200-Week EMA.
HYPE
- HYPE broke back below the support zone around $43- $44 (both daily Orderblock and bottom of the channel) earlier in the week, which is now resistance.
- A break of resistance around $43- $44 and we would target mid-channel at $51 again.
- HYPE is battling today to hold the support at the daily orderblock around $39- $40. There is also the 200-Day EMA+SMA in this area.
- A close below this Orderblock and we would get more neutral as it could retest the lows, and the next big support would be around $28.
- That would be an incredible buy point, as $28 is both an important horizontal support and the 61.8% fibonacci retracement of the entire $9- $59 move (the 61.8% Fibonacci retracement is a key technical level marking a strong potential reversal point where price tends to bounce or reject within a trend).

Technical analysis:
-
- Price Range: $28 – $44
- Bias: Neutral
- Add if breaks $44. Strong Buy below $28.
- Resistance: $$43- $44
- Support Zone: $28
- Breakdown Trigger: Break below $37
AURA
- AURA continues to consolidate within a range, with resistance at $0.10 and support in the $0.055–$0.065 zone.
- After facing rejection from the 200-Day EMA+SMA (key indicators of long-term trend direction), AURA is now retesting the daily orderblock support around $0.055- $0.065.
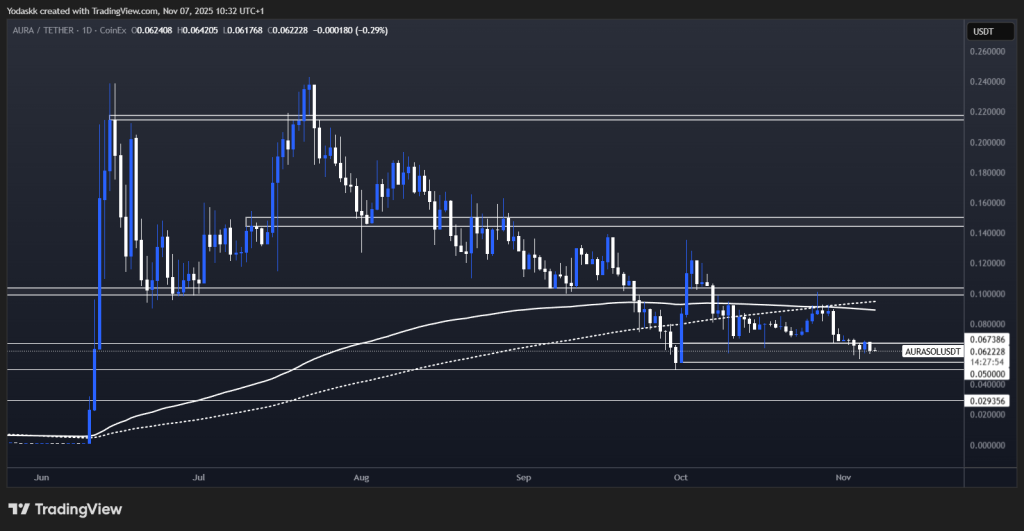
A confirmed breakout above the $0.10 resistance could signal a bullish shift in momentum, and we would probably move fast toward the $0.15 level and beyond.
As long as AURA is holding this daily orderblock as support, it still looking like an Adam and Eve bottom, which is a bullish reversal pattern that forms after a downtrend and consists of two consecutive bottoms:
- the first (Adam) is sharp and V-shaped, showing a quick sell-off and rebound
- the second (Eve) is rounded and wider, showing slower, steadier accumulation.
A close below the daily orderblock at $0.055- $0.065 and this pattern would be invalidated.
Next support after $0.05 is around $0.03 for AURA and this would likely present an attractive buying opportunity for long-term investors
Technical Analysis
-
- Price Range: $0.055 – $0.1
- Bias: Neutral to Bullish
- HOLD. Wait for $0.10 breakout or buy $0.055- $0.065 support.
- Resistance and Key Level to Reclaim: $0.1
- Support Zone: $0.055- $0.065
- Breakdown Trigger: Break below $0.05
Cryptonary’s Take
Following our Nov 3rd Market Direction, BTC moved precisely to our $100k-$102k target zone (orderblock + SFP zone + Weekly 50 EMA confluence). This validates our technical framework.However, the bounce mechanics are concerning. For a confirmed Swing Failure Pattern, we need to see:
- Decisive daily closes above $102k (not yet achieved)
- Volume-confirmed reversal (currently lacking)
- Multiple rejections of the $100k level showing strong support
- Historical precedent (3 previous corrections followed this exact playbook)
- Weekly 50 EMA alignment (critical support)
- November seasonality (most bullish month historically)
Action: If you haven't added at $100k-$102k yet, wait for confirmation:
- Option A: Wait for a daily close above $108k-$110k (breakout confirmed)
- Option B: Scale in at $100k if we hold the retest with strong volume
"Risk Management Framework:
- Conservative: Wait for $108k-$110k break to confirm reversal (lower risk, lower return)
- Moderate: Scale 25-30% here at $100k-$102k if we hold through weekly close
- Aggressive: Only if you have 3+ year time horizon and can stomach potential lower retest
Rate cuts continuing, QT ending December 1st, and improving US-China relations support our $125k-$135k year-end target.
For institutional flow data, ETF tracking, and macro catalysts: See Tom's Market Update published today.
Patience here should be rewarded by the end of Q4 2025.
*This Week’s Key Monitoring Points (Nov 7-14):*
Daily Checklist:
□ Is BTC holding $100k or breaking toward $93k?
□ ETF flows - any reversal to positive?
□ S&P 500 & NASDAQ - continuation of pullback?
□ DXY - is 100-101 still resistance?
Critical Levels This Week:
- BTC below $98k = $93k target becomes active
- BTC above $108k-$110k = bearish thesis invalidated
- ETF flows positive 2+ days = institutions returning (see Market Update for flow analysis)
- DXY above 101 = continued dollar strength headwind
- Fed speaker increase hawkishness
- Government shutdown drags on
- Major BTC whales offloading
- China stimulus delays
Thanks for reading!
*These levels are valid through Sunday, November 9th. Fresh analysis next Monday.*
Continue reading by joining Cryptonary Pro
$1,548 $1,197/year
Get everything you need to actively manage your portfolio and stay ahead. Ideal for investors seeking regular guidance and access to tools that help make informed decisions.
For your security, all orders are processed on a secured server.
As a Cryptonary Pro subscriber, you also get:
3X Value Guarantee - If cumulative documented upside does not reach 300% during your 12-month membership, you can request a full refund. Terms
24/7 access to experts with 50+ years’ experience
All of our top token picks for 2025
On hand technical analysis on any token of your choice
Weekly livestreams & ask us anything with the team
Daily insights on Macro, Mechanics, and On-chain
Curated list of top upcoming airdrops (free money)
3X Value Guarantee
If cumulative documented upside does not reach 300% during your 12-month membership, you can request a full refund.
Our track record speaks for itself
With over 2.4M tokens and widespread misinformation in crypto, we cut through the noise and consistently find winning assets.
Our track record speaks for itself
With over 2.4M tokens and widespread misinformation in crypto, we cut
through the noise and consistently find winning assets.


Frequently Asked Questions
Can I trust Cryptonary's calls?
Yes. We've consistently identified winners across multiple cycles. Bitcoin under $1,000, Ethereum under $70, Solana under $10, WIF from $0.003 to $5, PopCat from $0.004 to $2, SPX blasting past $1.70, and our latest pick has already 200X'd since June 2025. Everything is timestamped and public record.
Do I need to be an experienced trader or investor to benefit?
No. When we founded Cryptonary in 2017 the market was new to everyone. We intentionally created content that was easy to understand and actionable. That foundational principle is the crux of Cryptonary. Taking complex ideas and opportunities and presenting them in a way a 10 year old could understand.
What makes Cryptonary different from free crypto content on YouTube or Twitter?
Signal vs noise. We filter out 99.9% of garbage projects, provide data backed analysis, and have a proven track record of finding winners. Not to mention since Cryptonary's inception in 2017 we have never taken investment, sponsorship or partnership. Compare this to pretty much everyone else, no track record, and a long list of partnerships that cloud judgements.
Why is there no trial or refund policy?
We share highly sensitive, time-critical research. Once it's out, it can't be "returned." That's why membership is annual only. Crypto success takes time and commitment. If someone is not willing to invest 12 months into their future, there is no place for them at Cryptonary.
Do I get direct access to the Cryptonary team?
Yes. You will have 24/7 to the team that bought you BTC at $1,000, ETH at $70, and SOL at $10. Through our community chats, live Q&As, and member only channels, you can ask questions and interact directly with the team. Our team has over 50 years of combined experience which you can tap into every single day.
How often is content updated?
Daily. We provide real-time updates, weekly reports, emergency alerts, and live Q&As when the markets move fast. In crypto, the market moves fast, in Cryptonary, we move faster.
How does the 3X Value Guarantee work?
We stand behind the value of our research. If the documented upside from our published research during your 12-month membership does not exceed three times (3X) the annual subscription cost, you can request a full refund. Historical context: In every completed market cycle since 2017, cumulative documented upside has exceeded 10X this threshold.
TermsRecommended from Cryptonary


