TLDR 📃
- Total market cap flipped $1.18T into support on the weekly timeframe. We are on track for $1.35T.
- Altcoins market cap reached the resistance area: $650B - $750B. More upside is possible, but increasing positions isn’t a good play right now.
- Bitcoin remains inside the $28,750 - $32,000 resistance area. This is where we believe the pullback will begin. Altcoins can still rise significantly until this happens.
- ETH is on track for $2,500.
Disclaimer: Not financial or investment advice. You are responsible for any capital-related decisions you make, and only you are accountable for the results.
Total Market Cap (Weekly)
The Total Market Cap index represents the entire cryptocurrency market. We track this index to understand where the market is now and predict where it will go next.
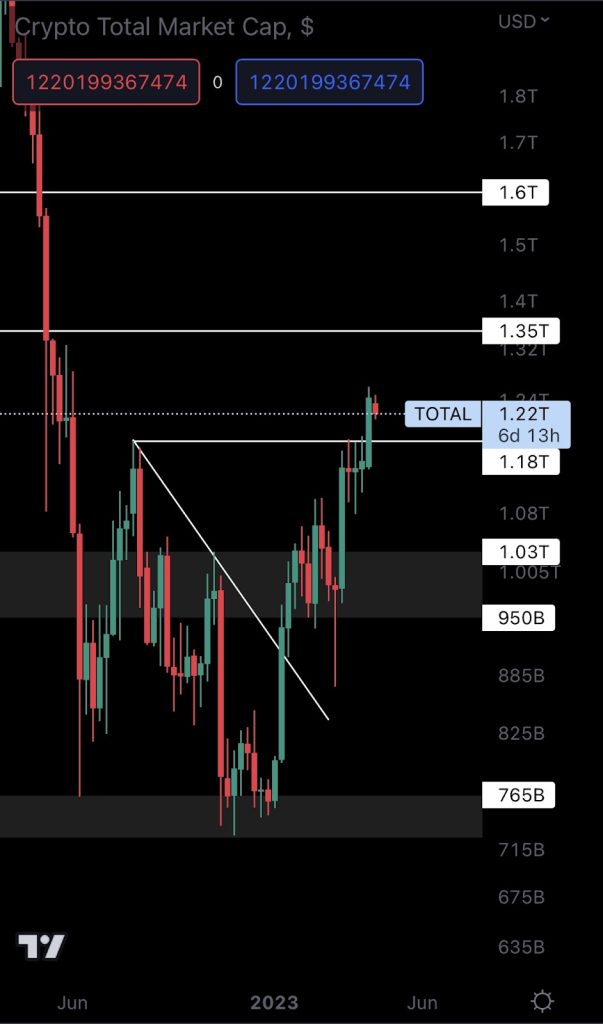
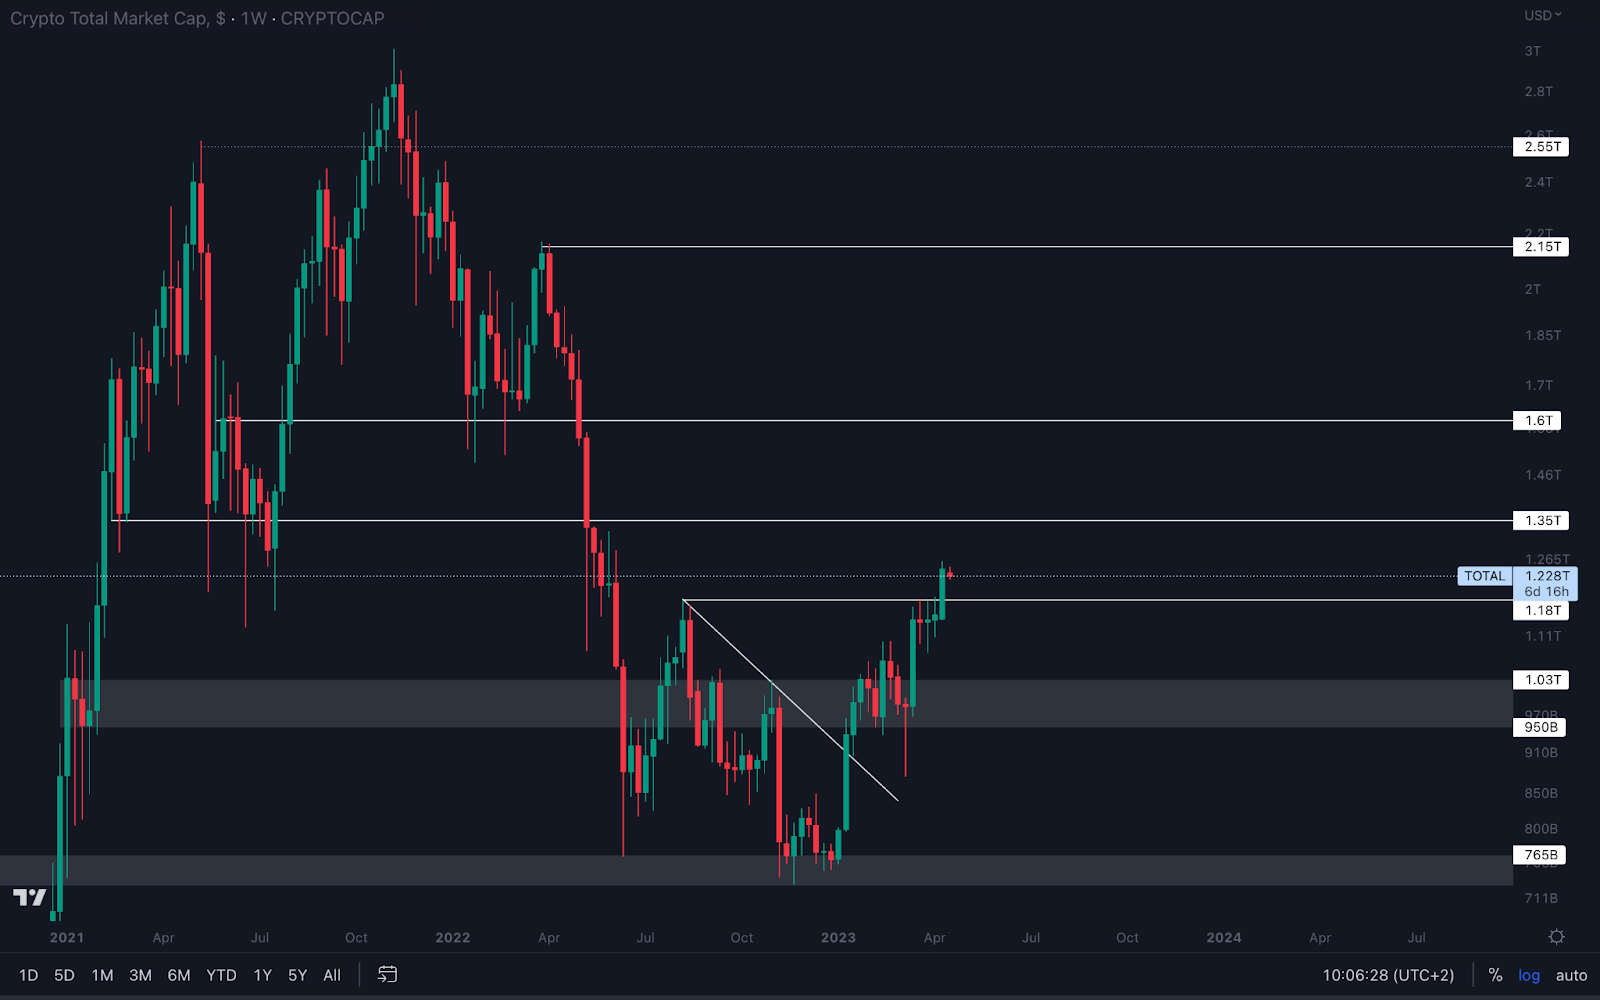
For the first time in 10 months, the Total Market Cap index closed above $1.18T. From a technical standpoint, this opens the door for $1.35T, a level which can be tested in the coming weeks.
But Bitcoin drives the market. Where it goes, the rest follow - and we believe it will start descending to $25,150 in the coming weeks. This could result in Total Market Cap falling short of $1.35T.
Altcoins Market Cap (Weekly)
The Altcoins Market Cap index represents the entire evaluation of the altcoins market: all coins other than BTC.
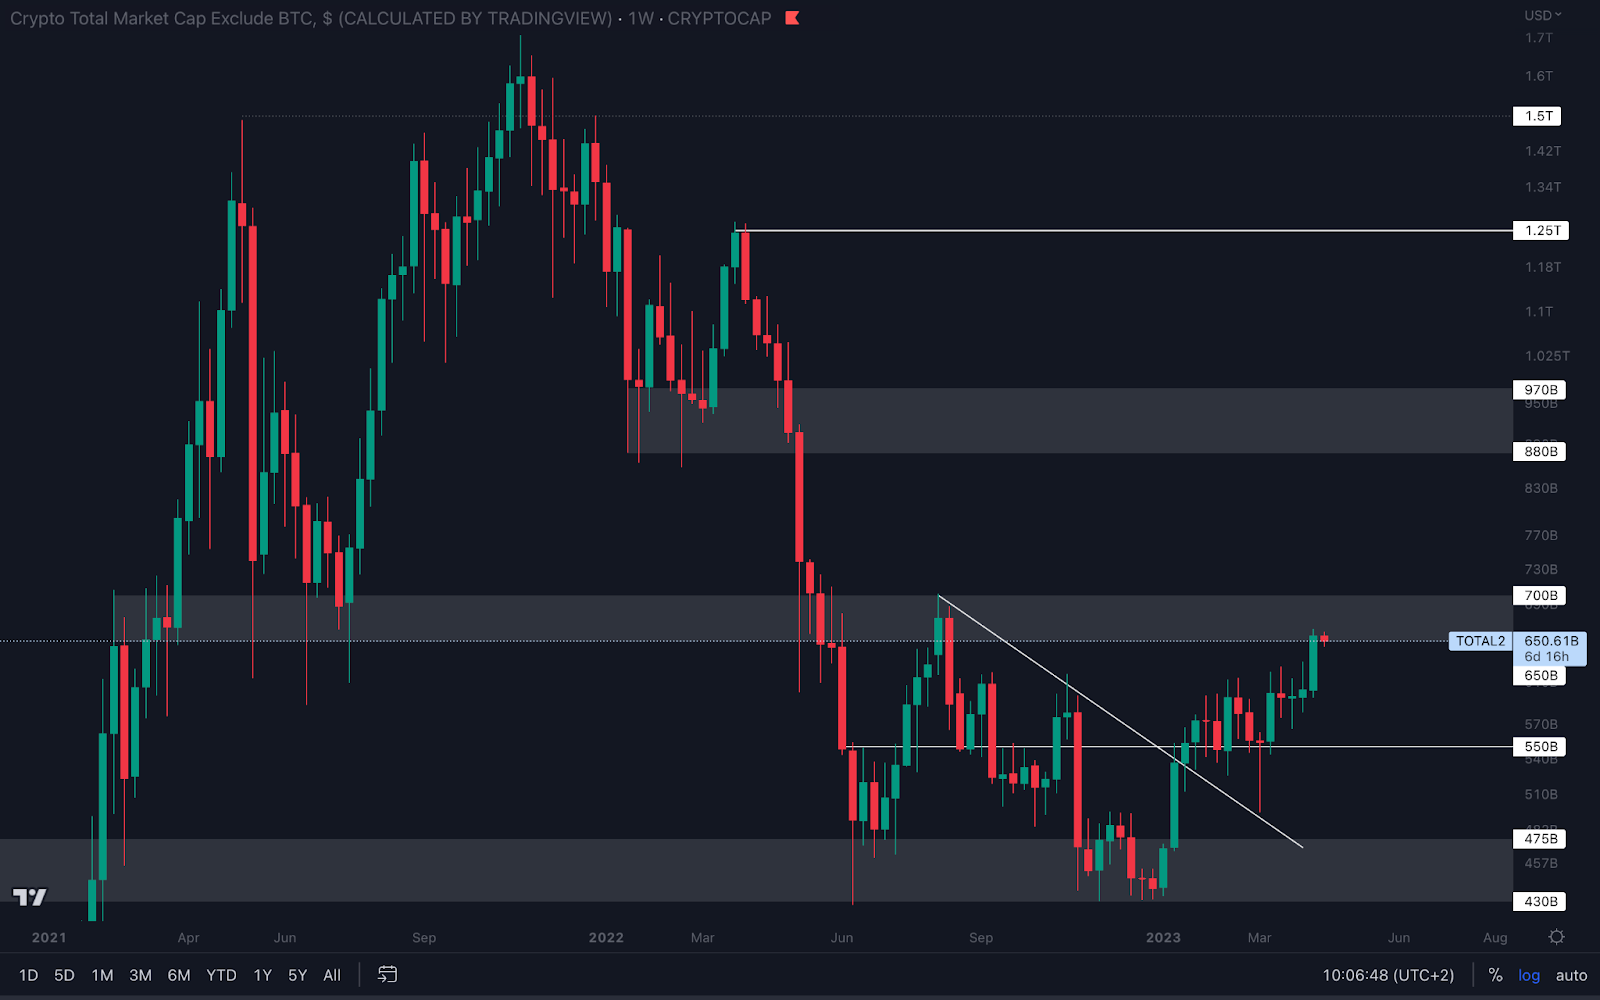
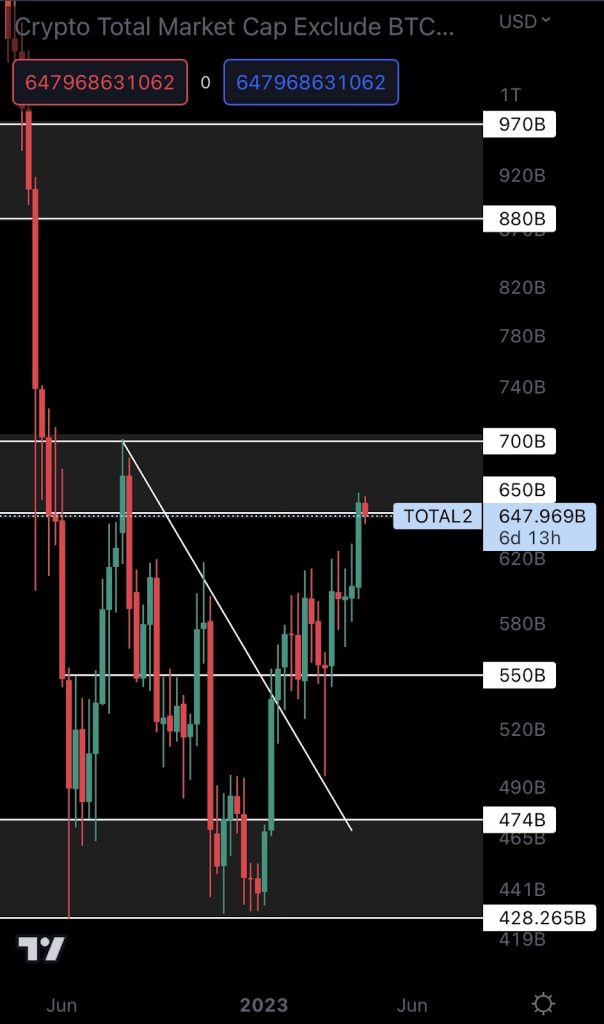 The Altcoins Market Cap reached a $650B - $700B resistance level. More upside can follow for the altcoins market, but for significant change, we’ll need to see the index flip $700B into support on the weekly timeframe.
Cryptonary's Portfolio
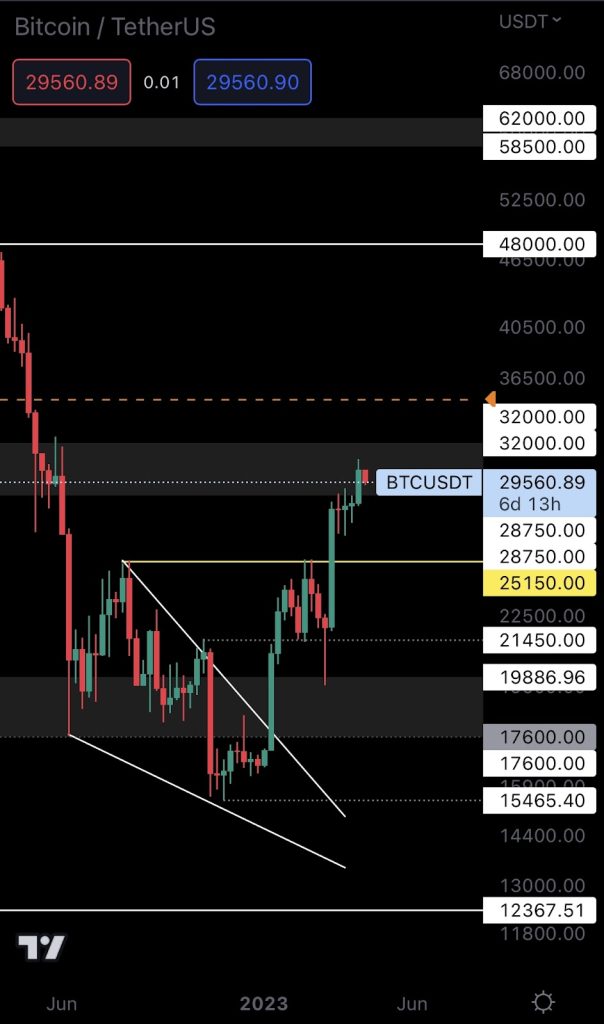
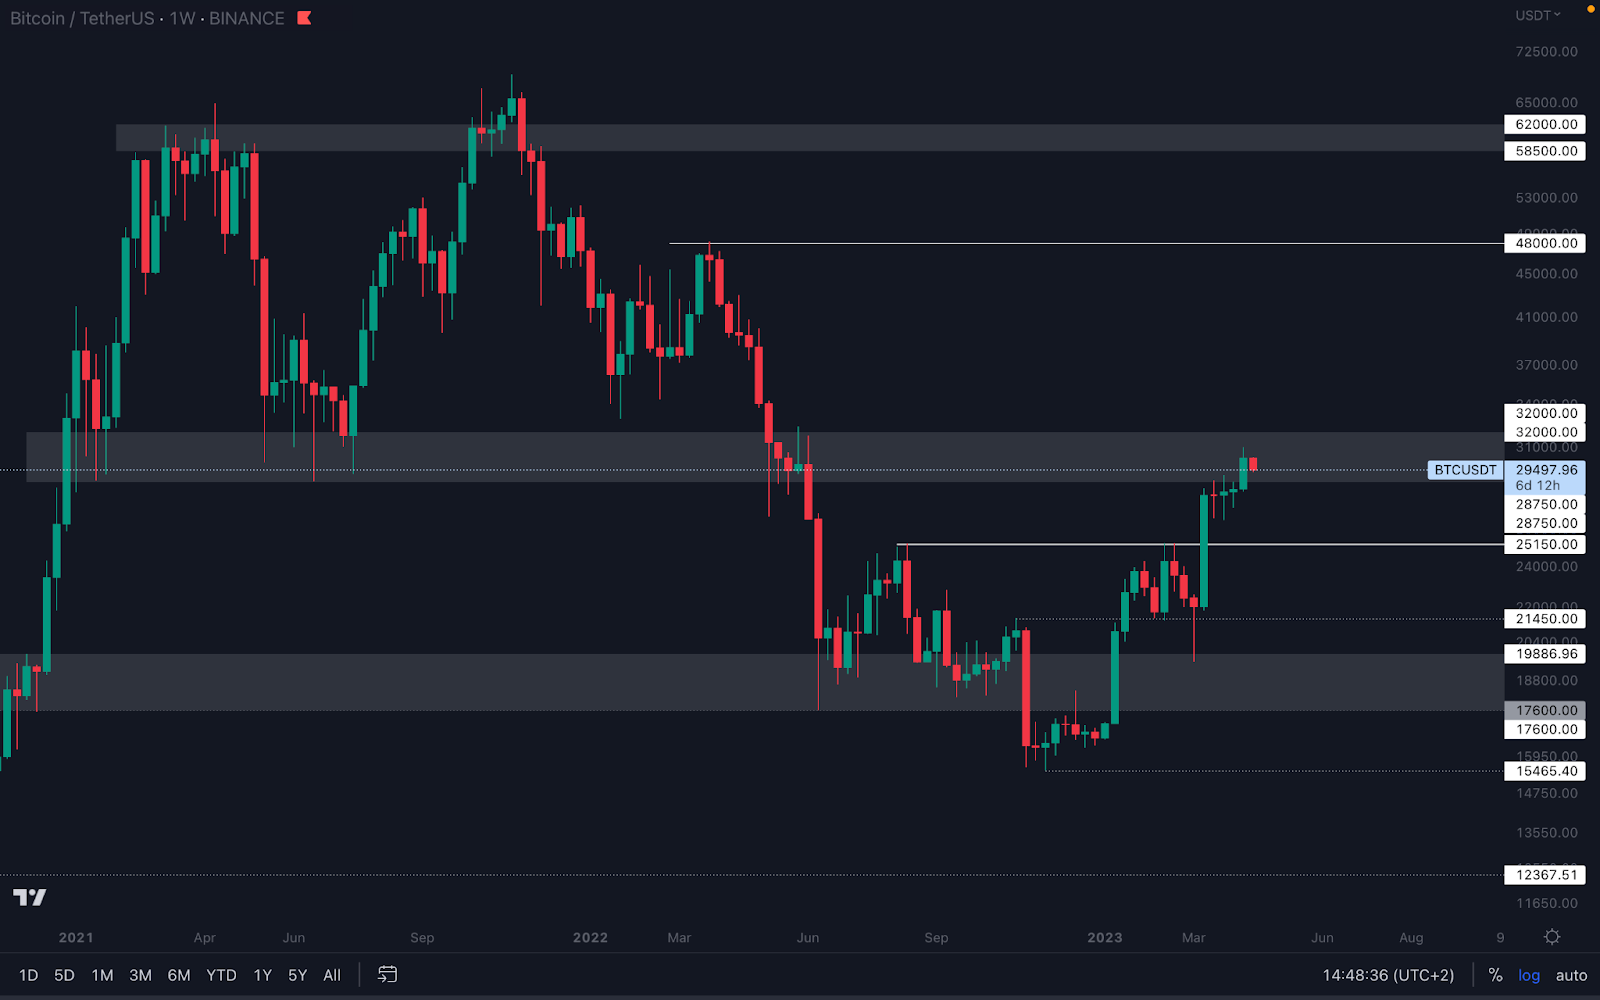
BTC | Bitcoin (Weekly)
This is where things get interesting.
Bitcoin is now trading inside a $28,750 - $32,000 resistance area. During 2021 and 2022, this region was bull-run support. We’ve seen multiple bounces from it which lead to significant returns. Now this region acts as resistance.
Bitcoin has been rising consistently during 2023, and there might be even more upside. But the odds of a pullback increased significantly as soon as we entered this region, and we believe a local top will form here.
There are two outcomes to prepare for:
🐂 Bullish outcome: Bitcoin flips $32,000 into support by closing a weekly candle above this level. This will open the road for $48,000 to be tested at a later date in 2023, unless a loss of $32,000 occurs.
🐻 Bearish outcome: Bitcoin closes a weekly candle under $28,750, which will put it on track for $25,150. This scenario is invalidated if Bitcoin flips $32,000 into support.
Your best play right now is to wait for one of these confirmations to unfold and act accordingly.
ETH | Ethereum (Weekly)
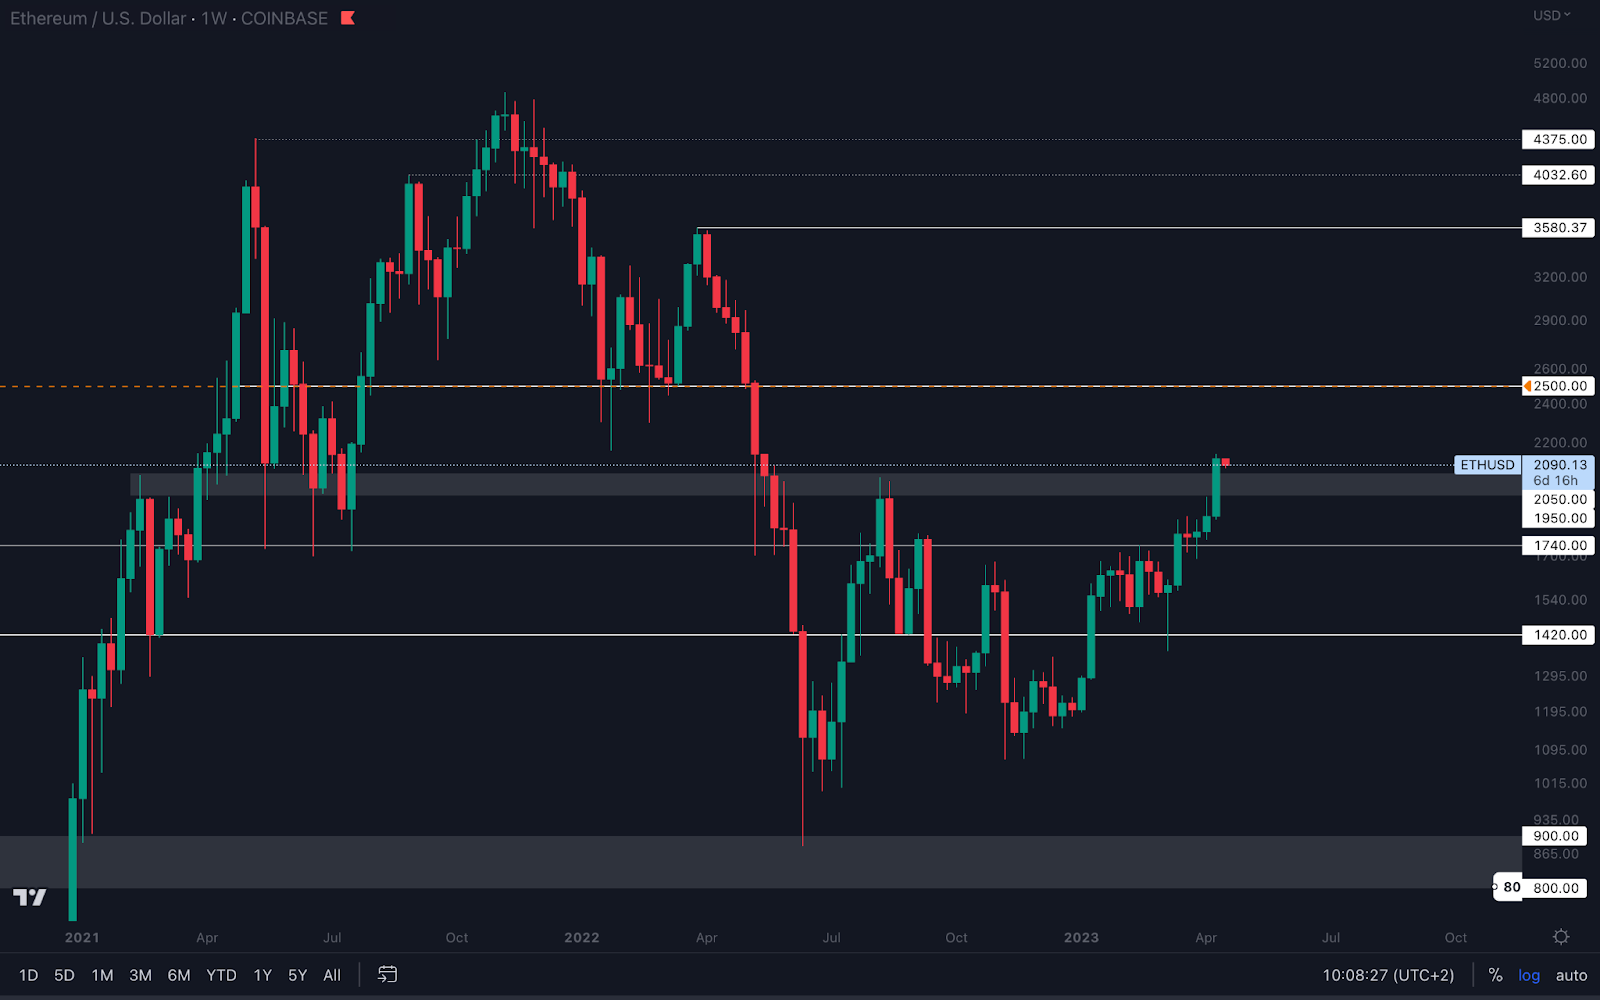
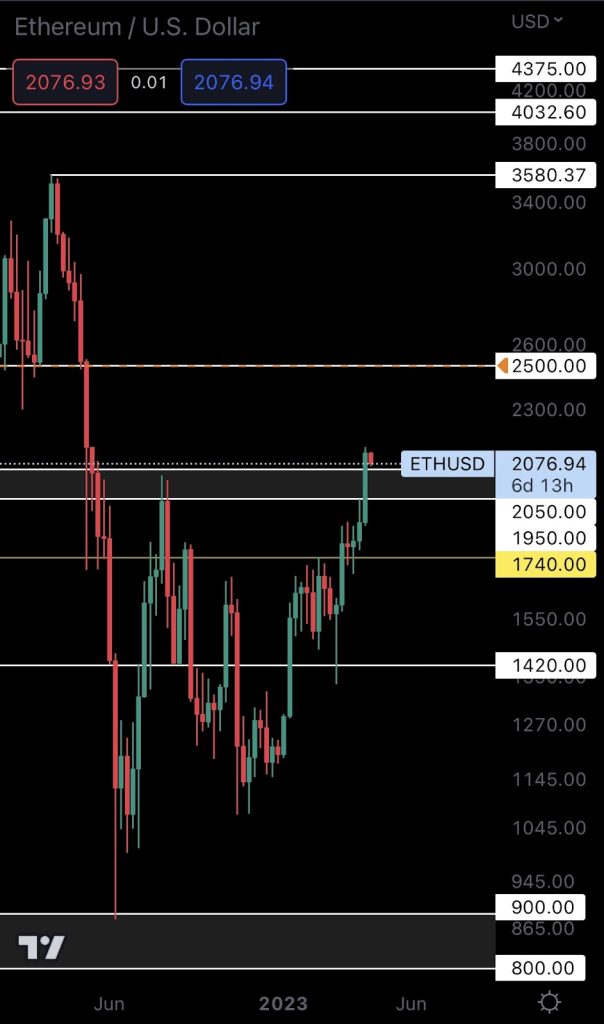
Last week, ETH closed above $2,000, flipping this level into support. From a technical standpoint, the asset is now on track for $2,500 and will probably reach this level in the coming weeks.
We’ve seen ETH perform extremely well after the Shanghai upgrade despite the market’s expectations (most were expecting a dump). Fortunately, there’s more to come if ETH can hold $2,000 as support on the weekly timeframe. This is the only invalidation for the move to $2,500.
DYDX | dYdX (Weekly)
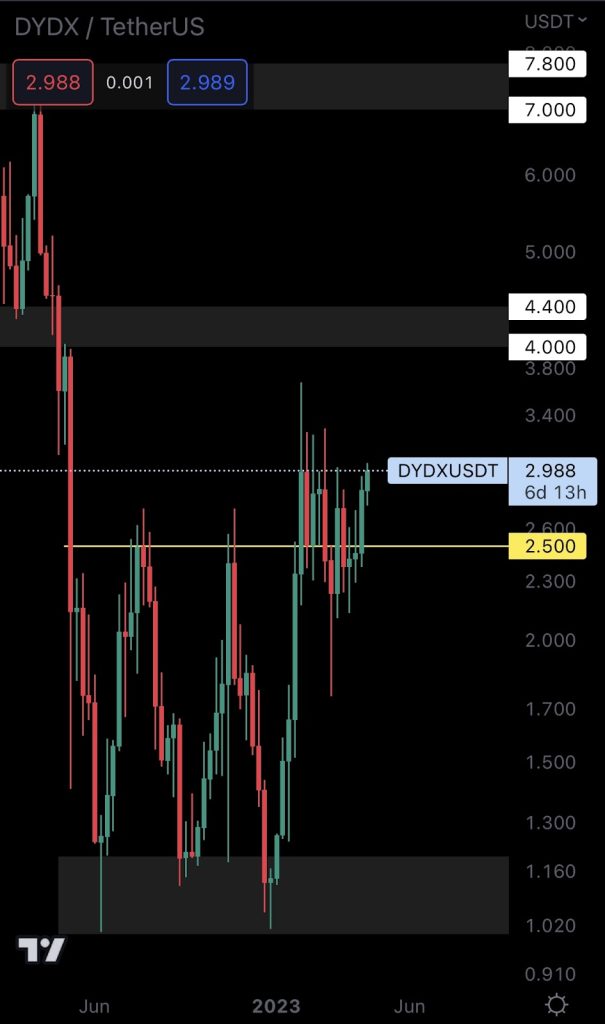
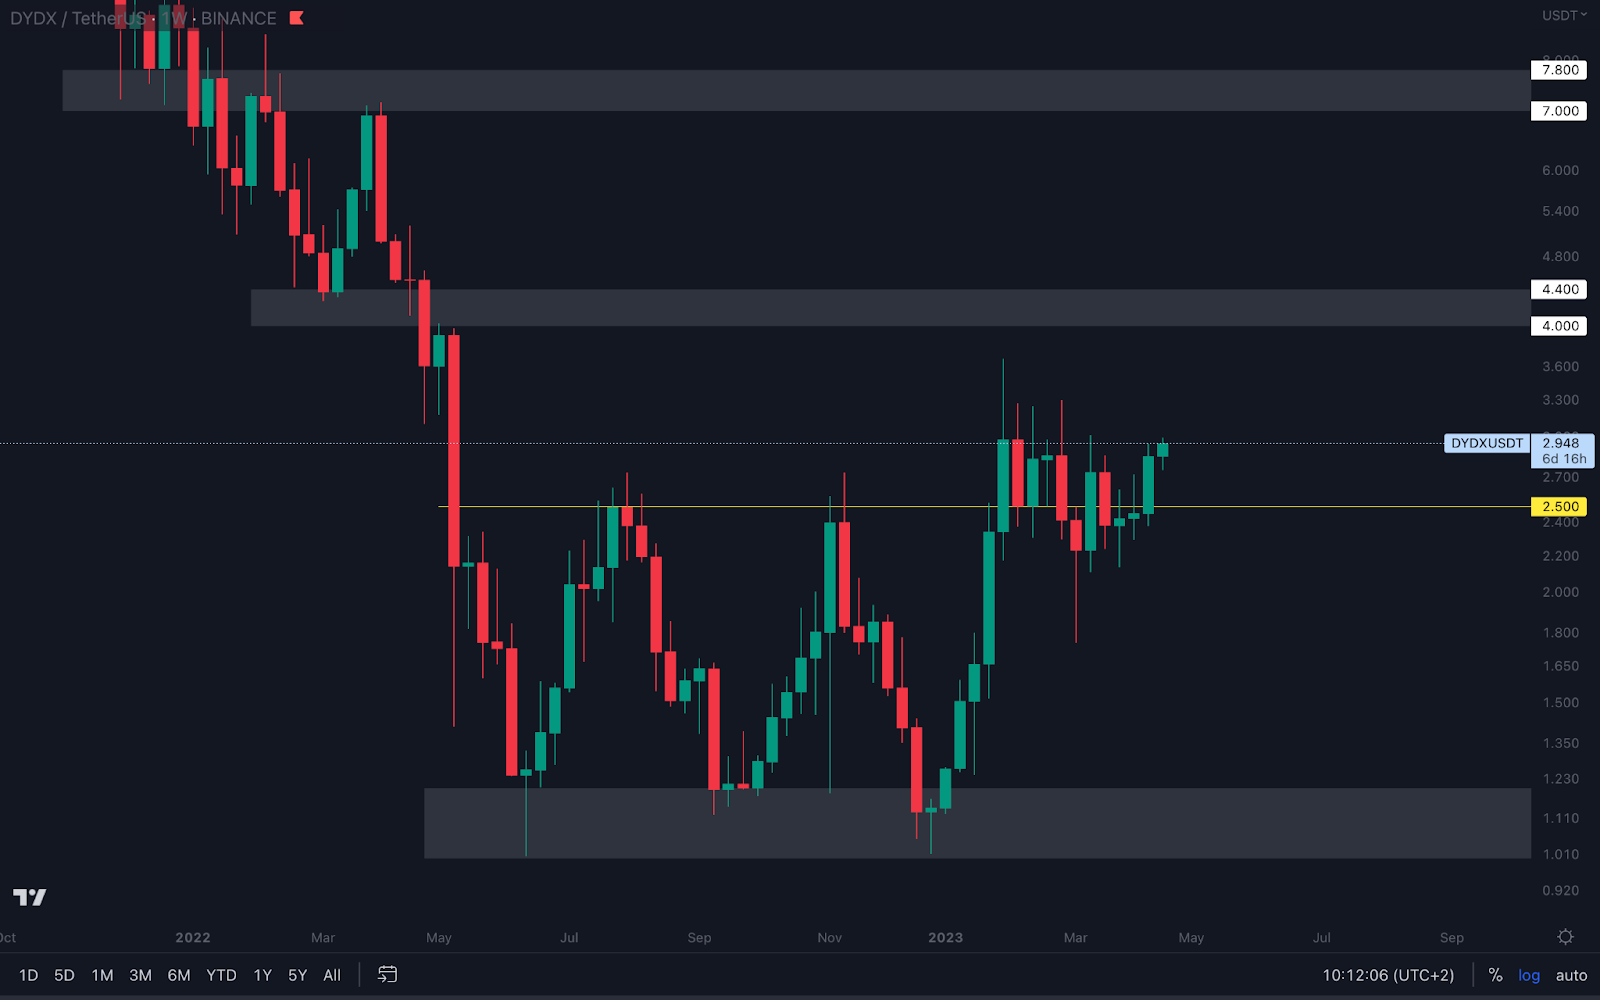
DYDX flipped $2.50 back into support and is already bouncing toward $4. As long as we see the asset holding $2.50 on the weekly timeframe, we are on track for $4 - $4.40.
LDO | Lido DAO (Weekly)
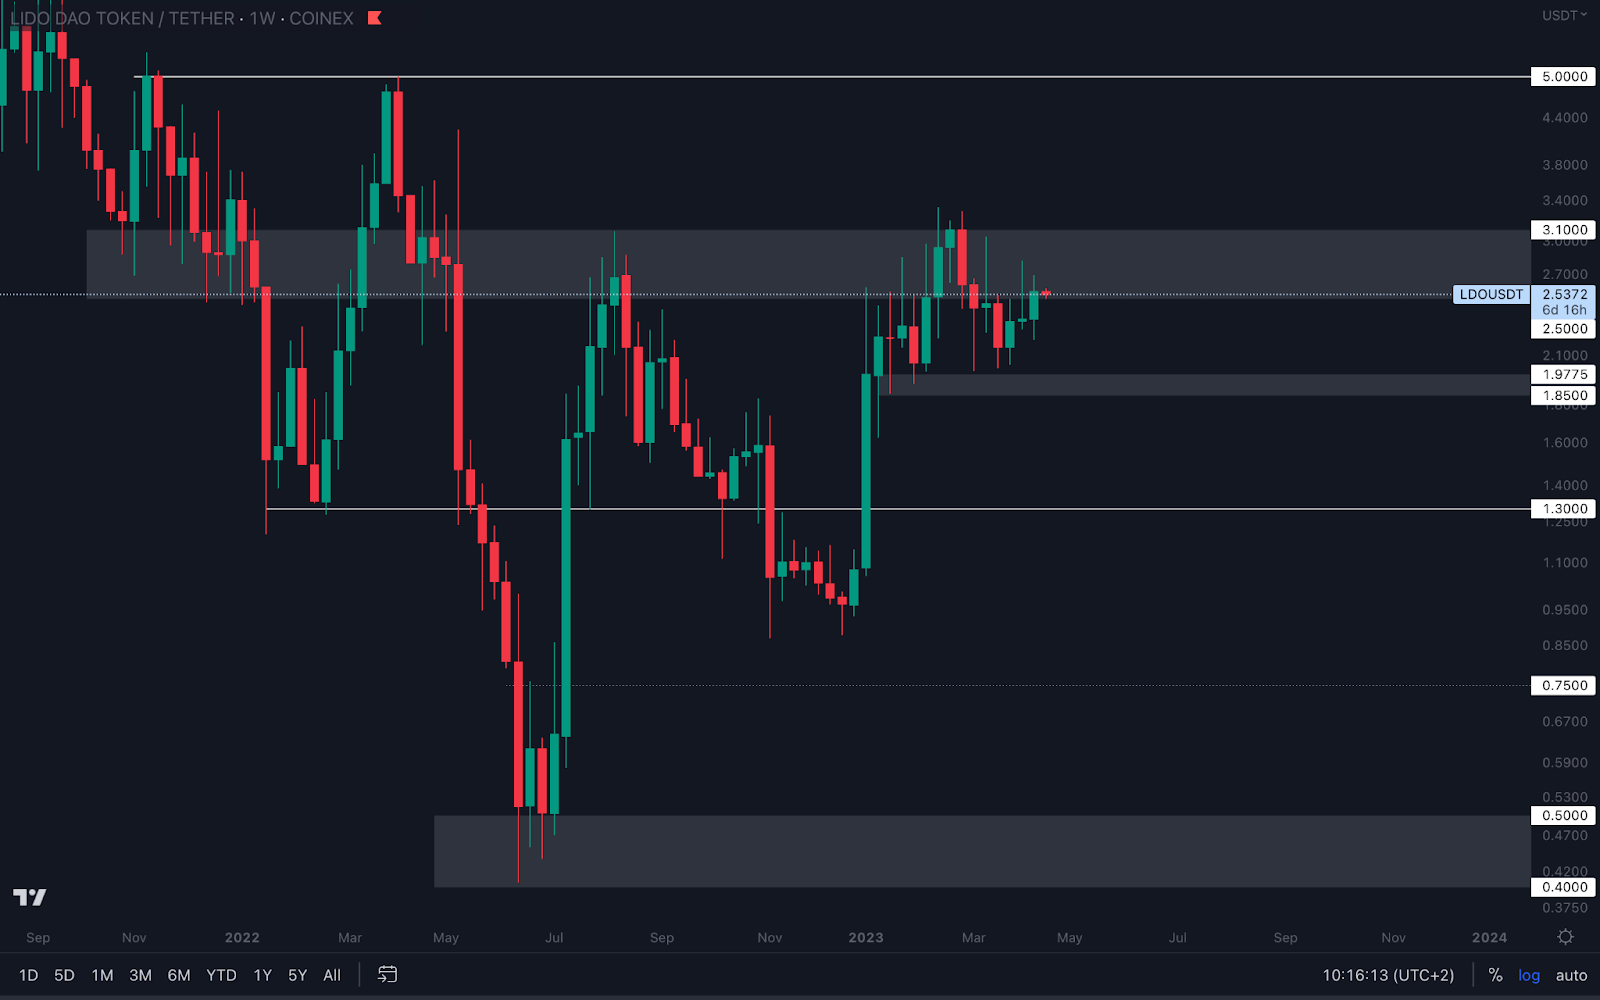
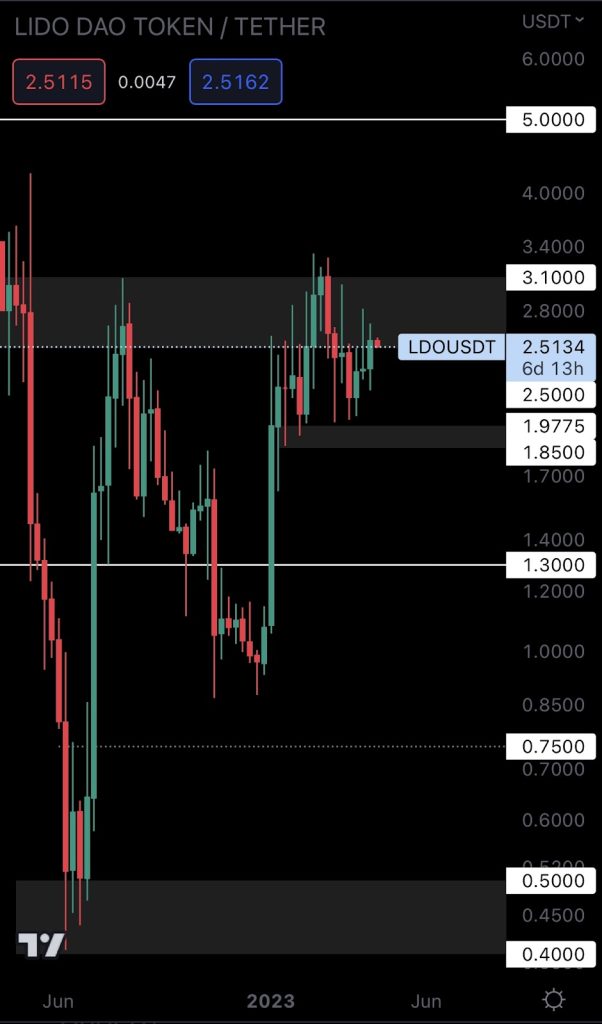
LDO closed last week’s candle slightly above $2.50, but we don’t view this closure as a confirmation because it lacks strength. For upside to be confirmed, LDO will need a proper closure above $2.50 - or even better, a weekly closure above $3.10, which will open the road to $5.
HEGIC | Hegic (Weekly)
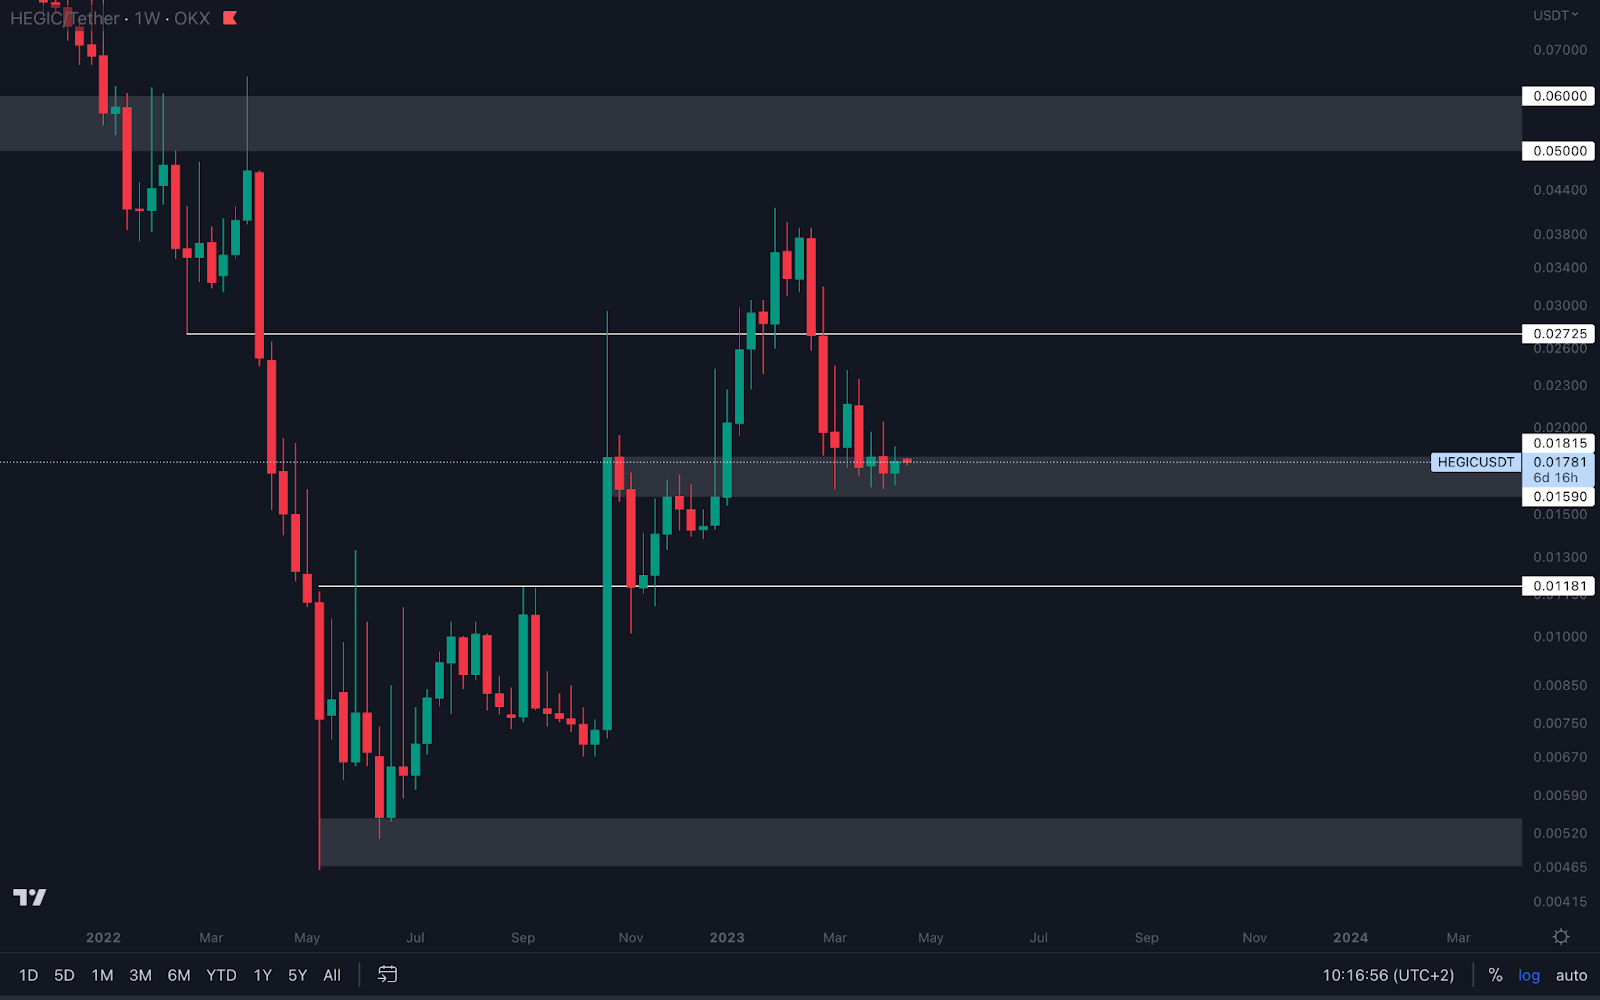
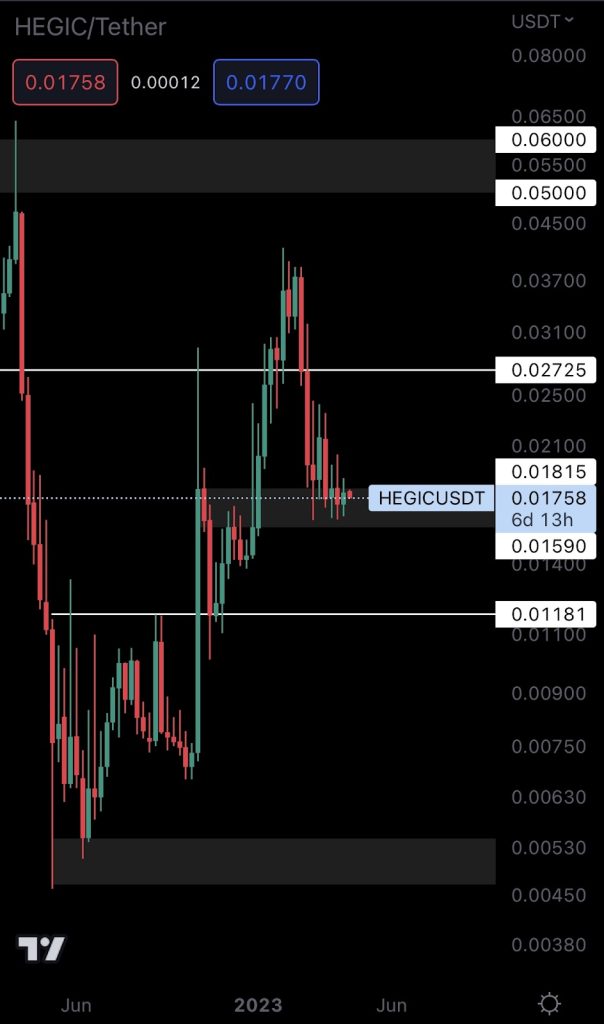
HEGIC has been ranging above support for a few weeks, and it seems to be lacking strength. This could be a sign of concern, but it can also be a sign for accumulation. Accumulation periods often come with decreased volumes, and the fact that HEGIC is maintaining support with decreased demand reinforces this idea. For that reason, we believe that HEGIC might be preparing for a move to $0.02725.
Unfortunately, there’s a catch - Bitcoin picking the bearish route will result in HEGIC losing support at $0.01590. As confirmation for upside on HEGIC’s part, we’ll have to account for both the $0.01590 - $0.01815 support area holding and on Bitcoin flipping $32,000 into support on the weekly timeframe.
PENDLE | Pendle (Weekly)
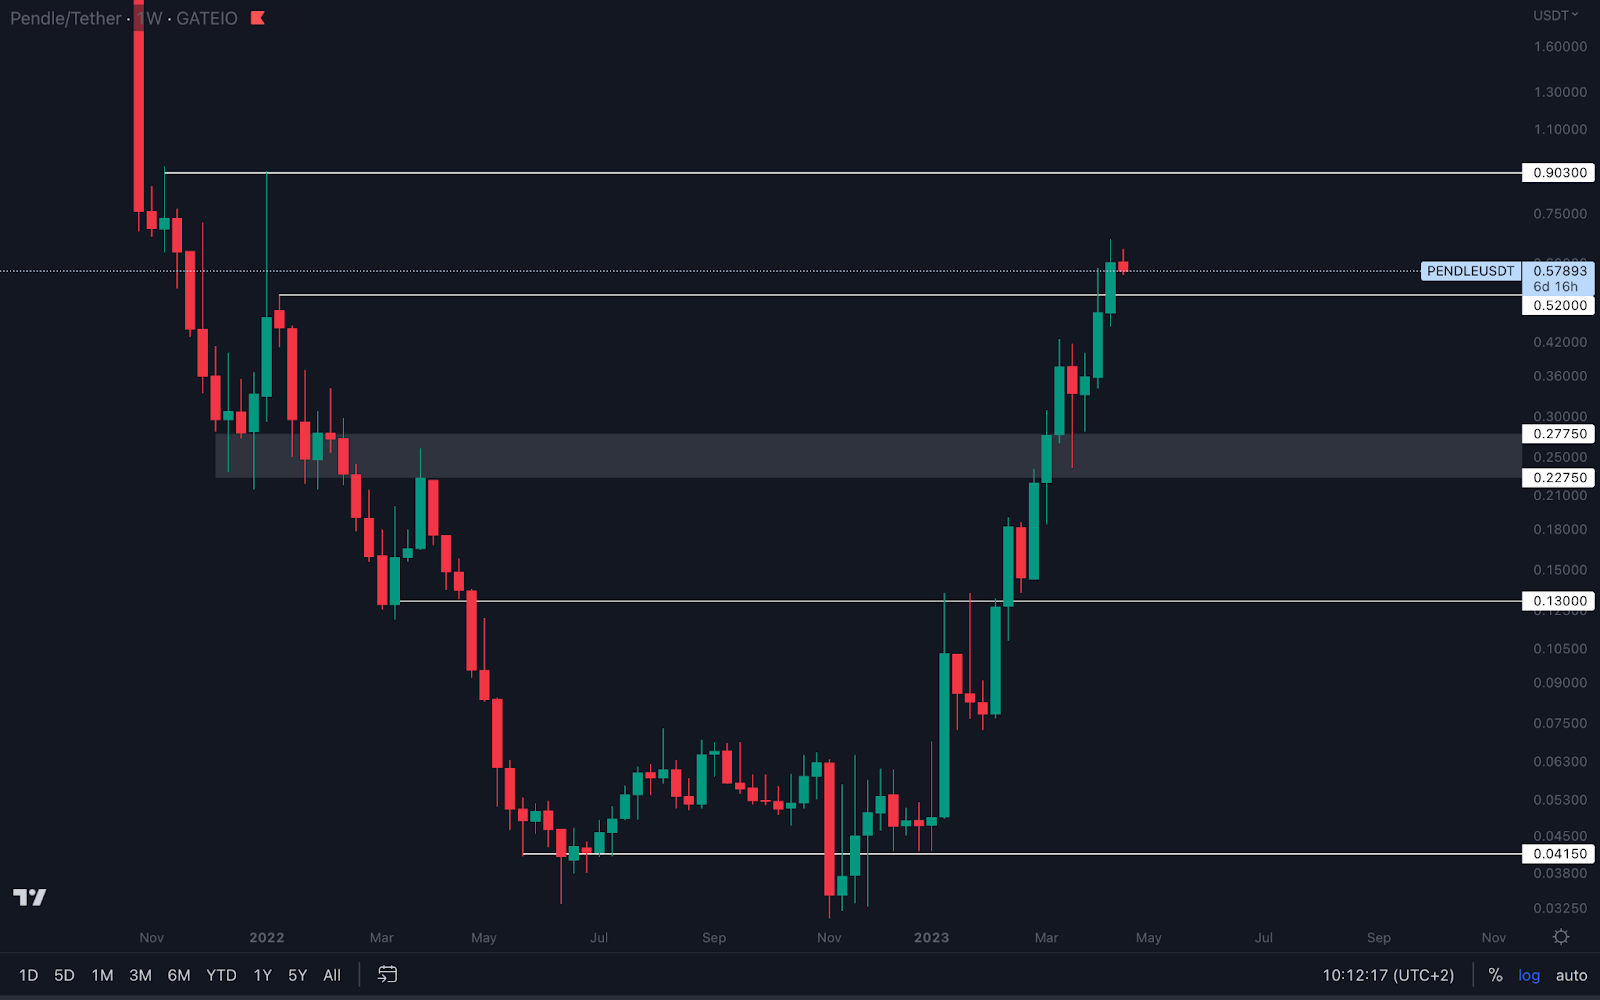

$0.52 has been flipped into support.
PENDLE has been one of our best investments yet, and it keeps on giving. Expect $0.90 to be reached next unless the asset closes a weekly candle under $0.52.
Despite the market’s past selling pressure, PENDLE kept on rising. This is a clear sign of demand, and it’s enough to outperform any bearish moves on BTC.
Cryptonary's Watchlist
DOT | Polkadot (Weekly)
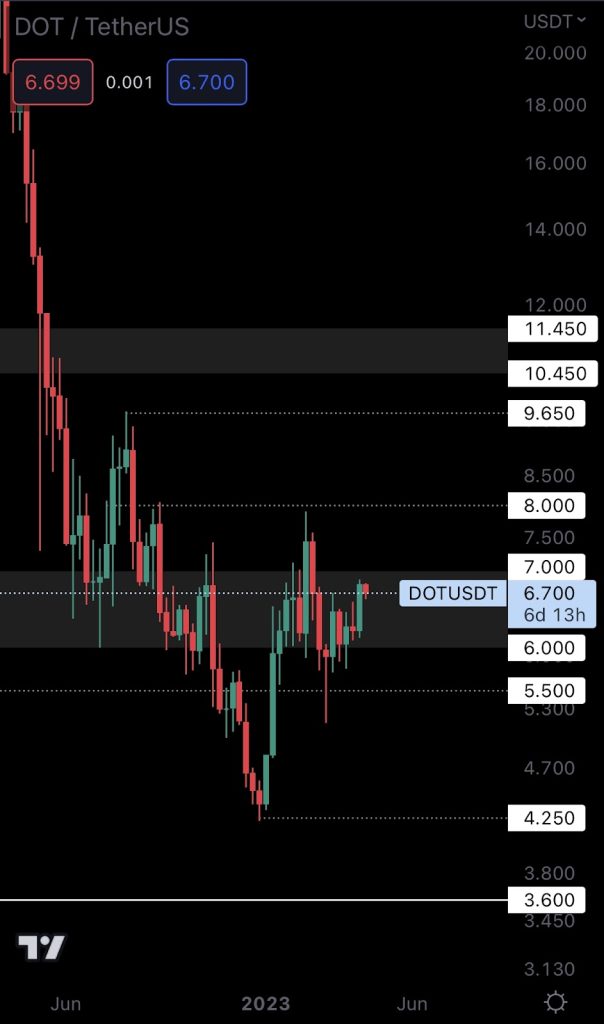
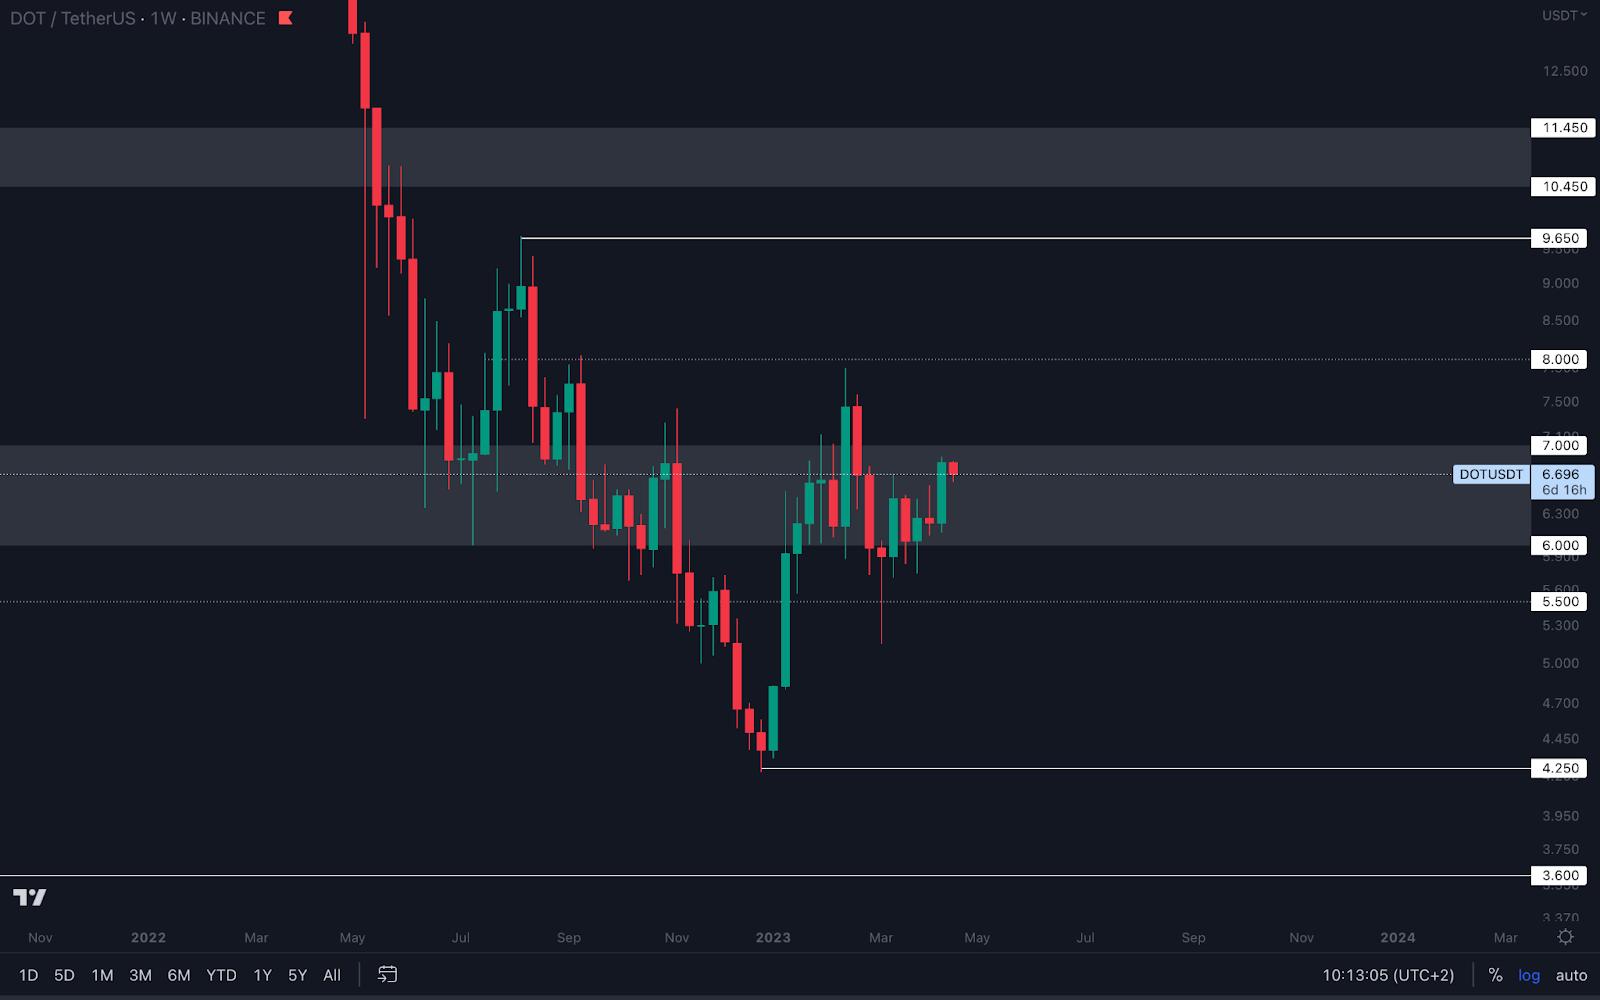
DOT is slowly approaching $7. For the rise to continue, a weekly closure above this level is necessary. That would put the asset on track for $8, $9.65, and $10.45. If DOT cannot break $7, it will head down to $6 and lower.
RUNE | THORChain (Weekly)
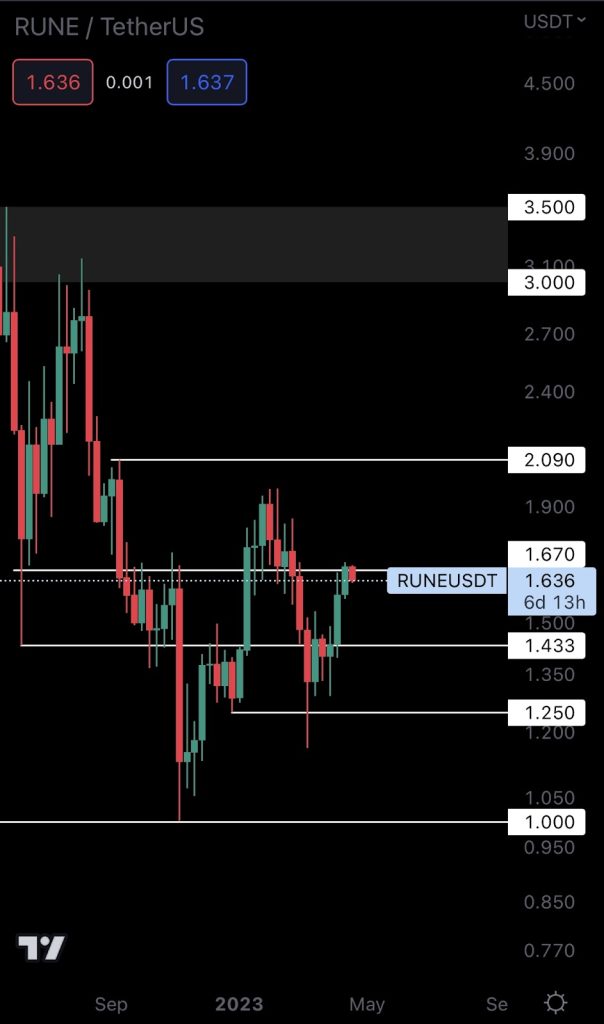
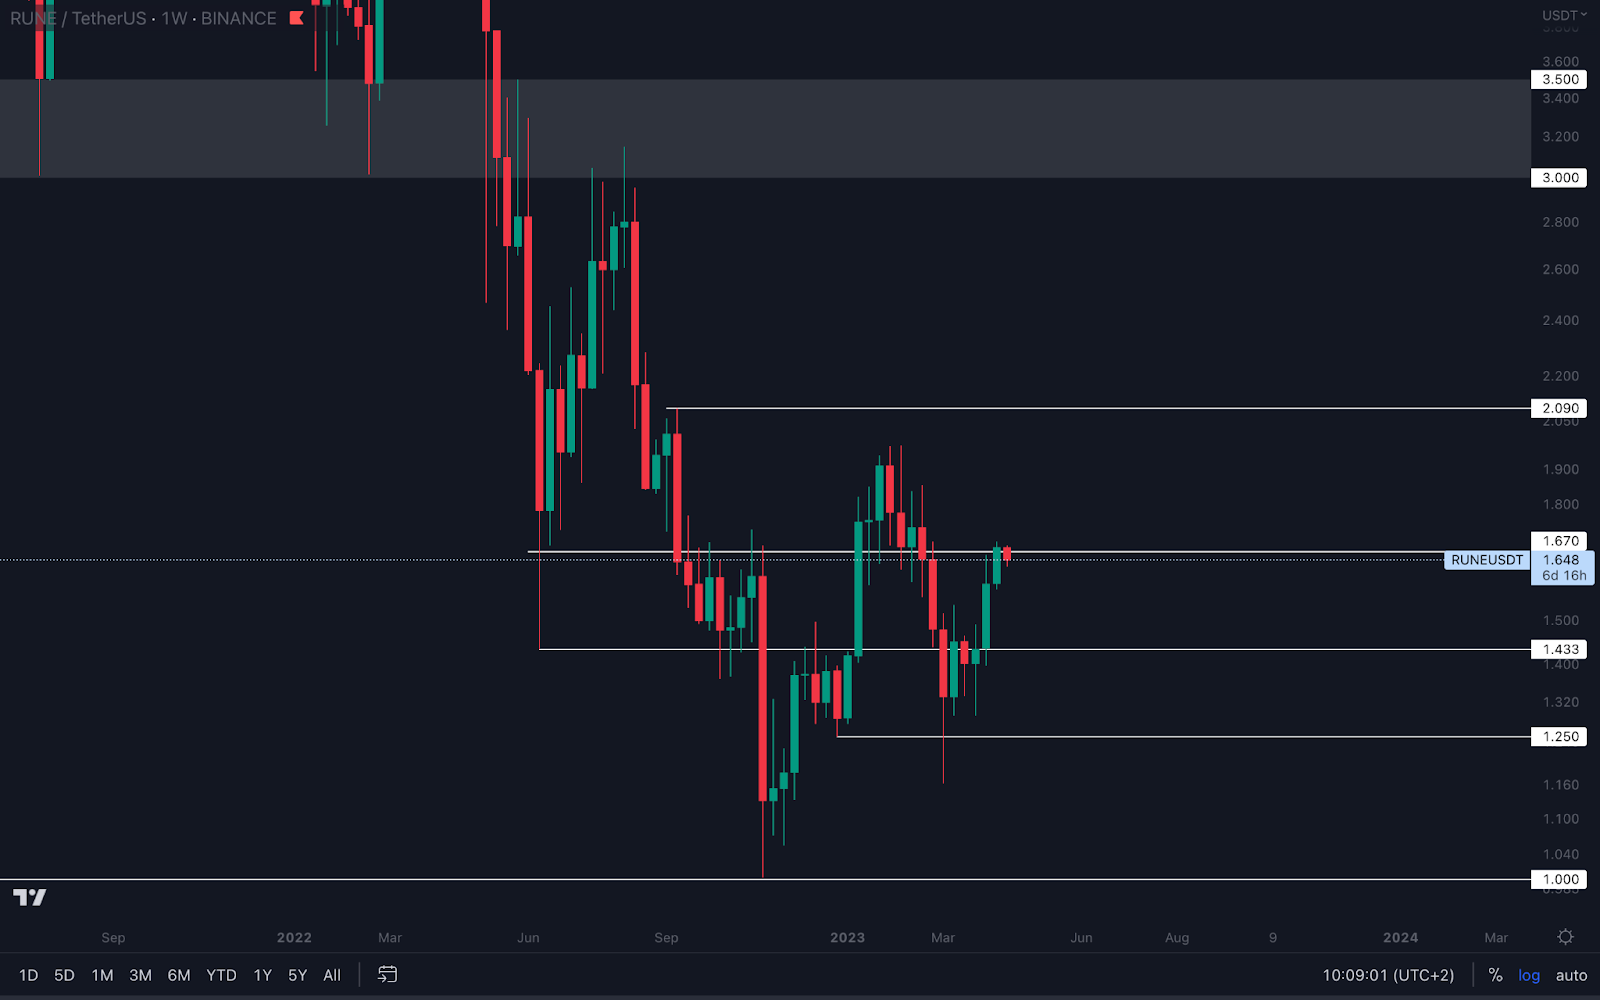
Like LDO, RUNE closed last week’s candle slightly above resistance ($1.67). Although the market will probably push it higher, we never act based on suspicion alone. Confirmations are needed. For that reason, RUNE will require a proper weekly closure above $1.67 for us to confirm more upside to its nearest resistance level at $2.09.
SOL | Solana (Weekly)
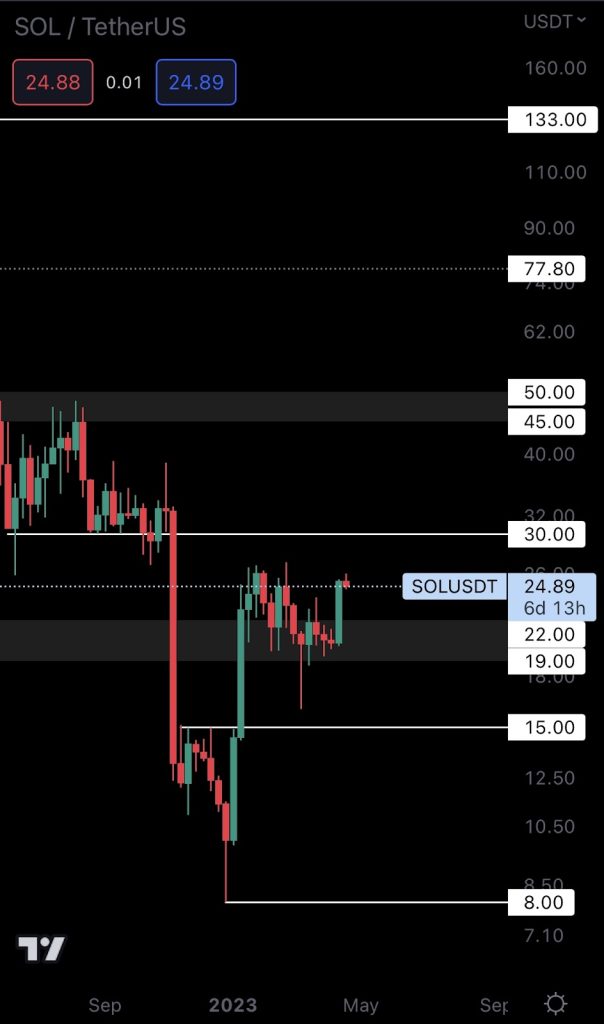
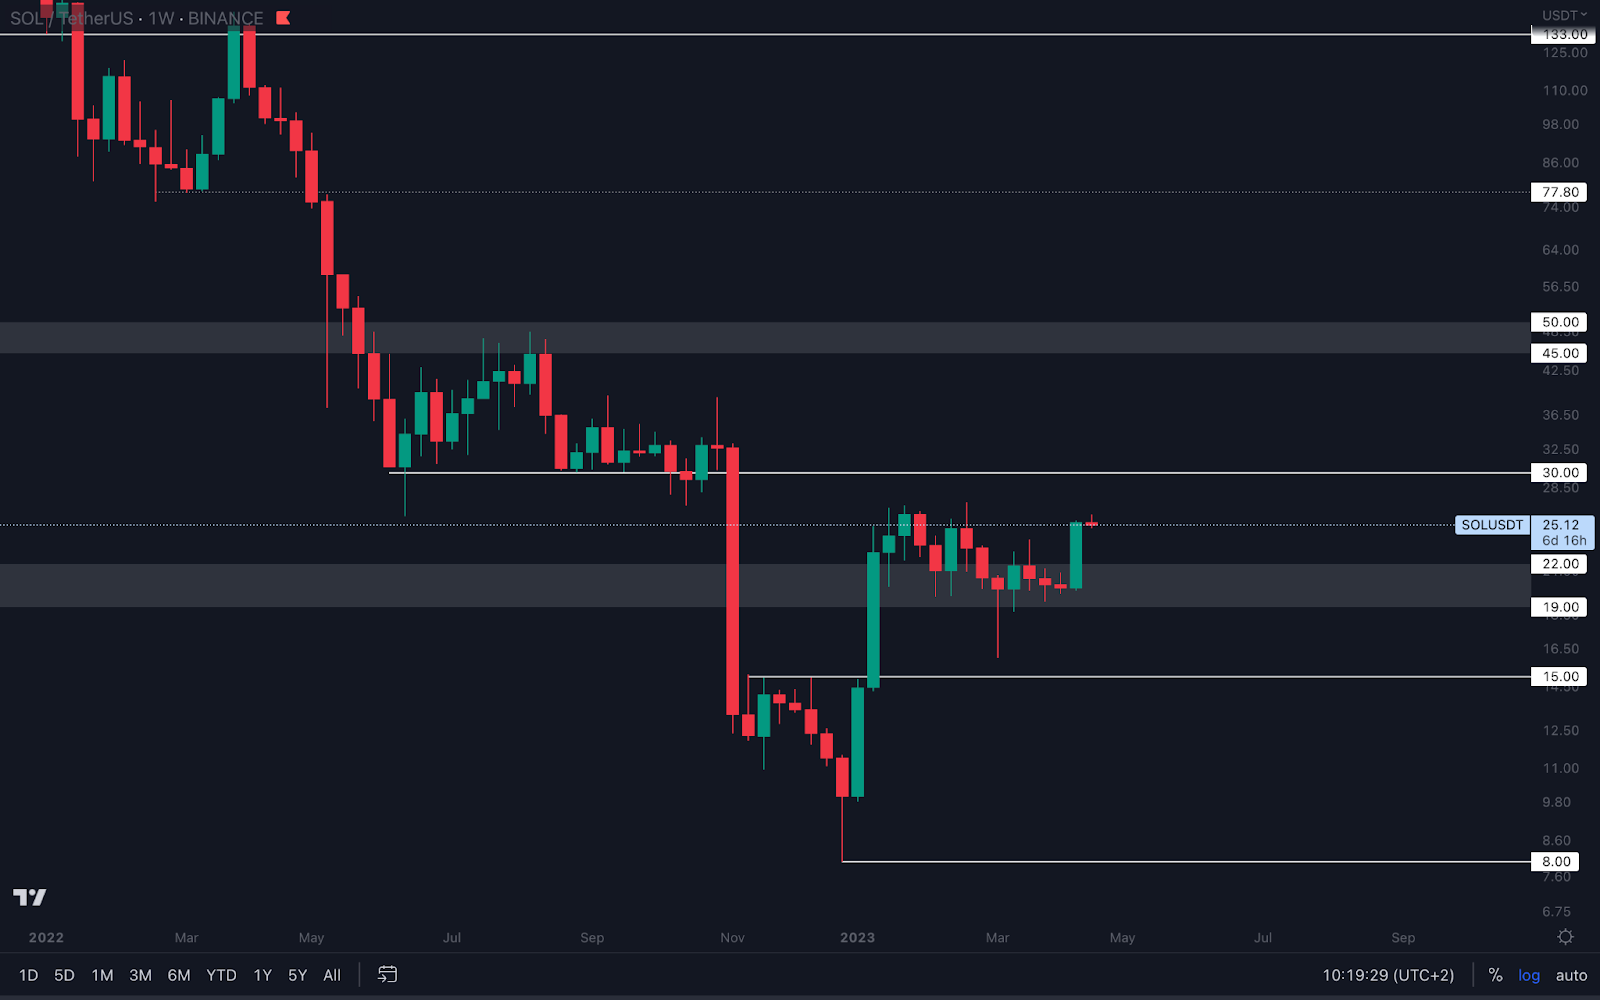
Last week’s candle closed full-bodied, indicating a strong increase in demand. That demand should push SOL to $30 very fast.
Flipping $30 into support on the weekly timeframe will put SOL on track for $45 - $50. But for the time being, expect it to reach $30 and prepare to take profits at that level. Greed is your #1 enemy. Defeat it, and you’ll win the game.
SNX | Synthetix (Weekly)
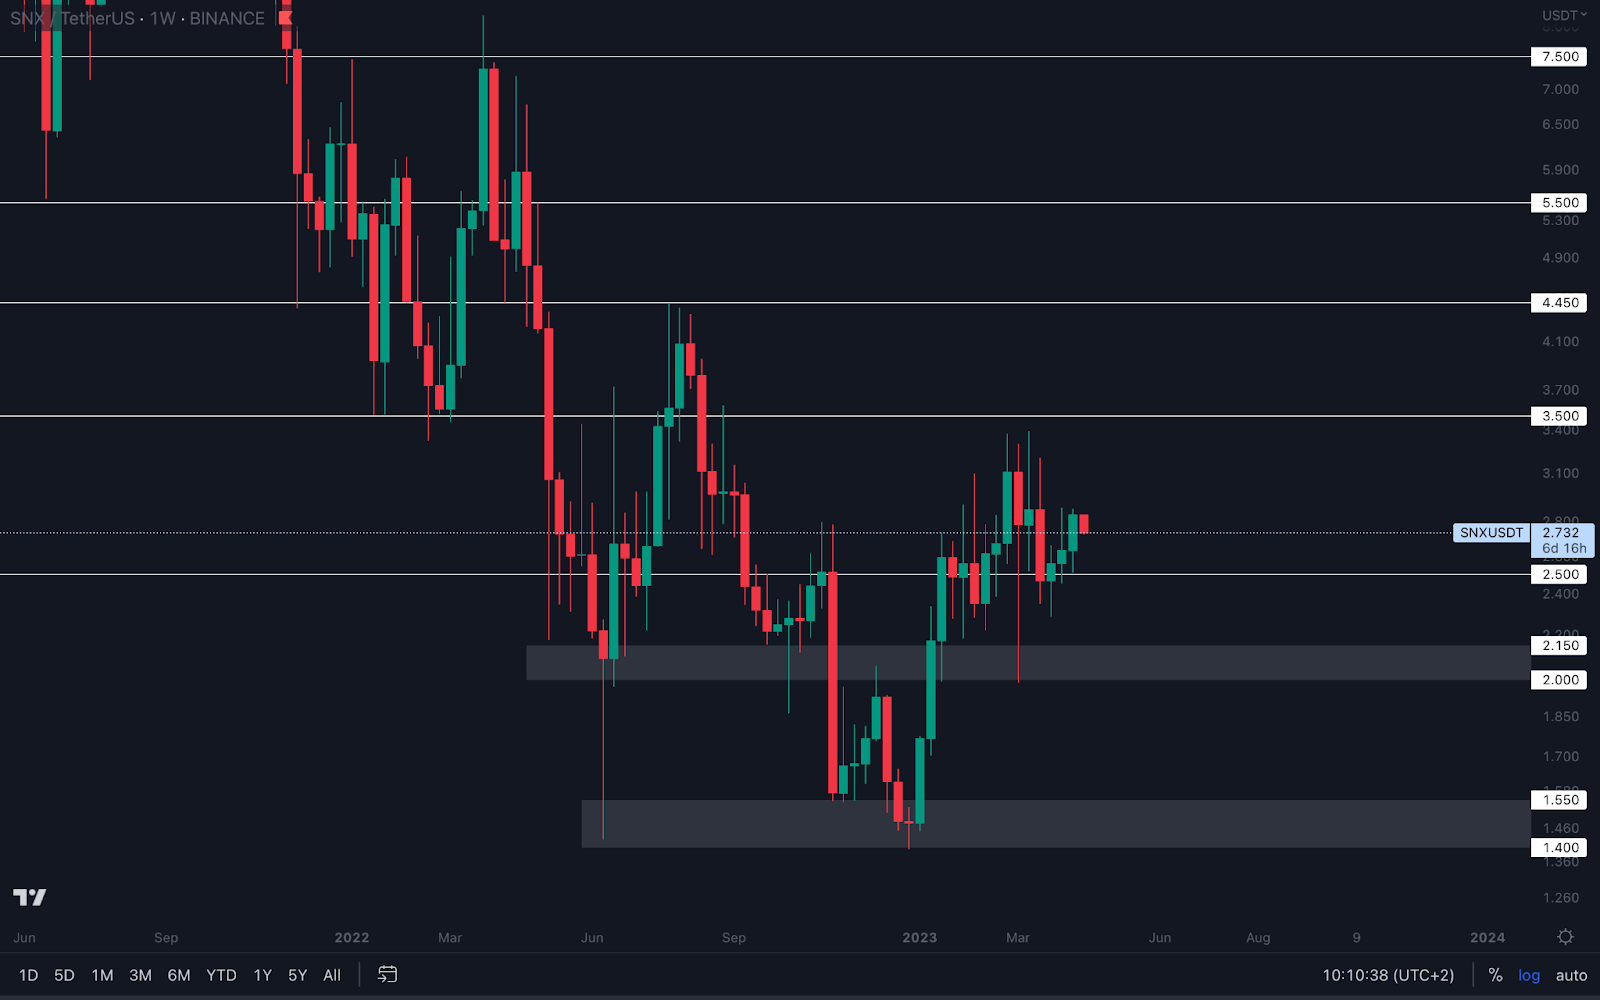
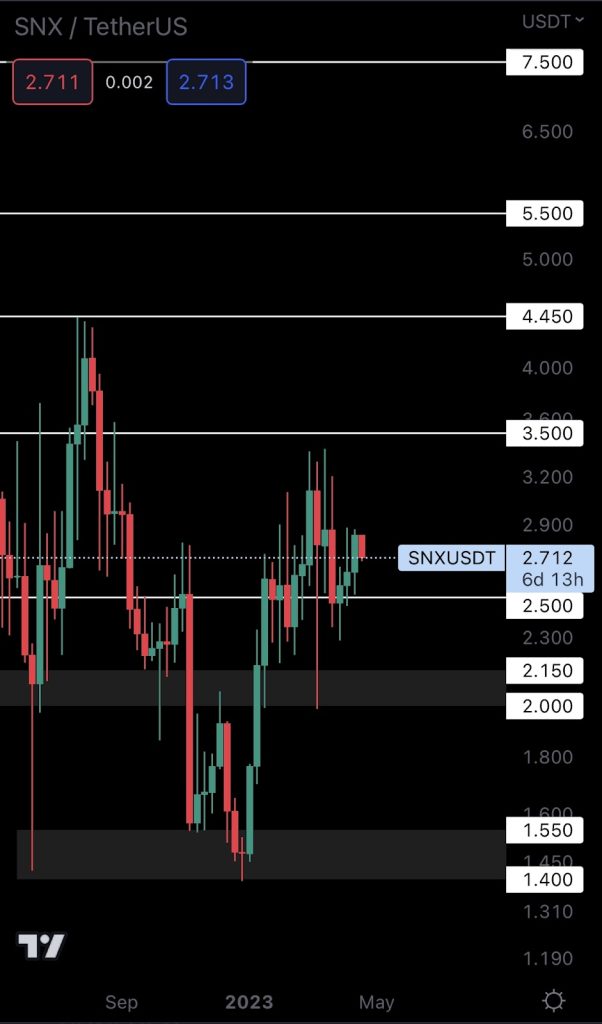
SNX bounced from its $2.50 support level and is now on track for $3.50. Whether this level is reached remains in the hands of Bitcoin, as only a break above $32,000 will give SNX the necessary momentum to reach $3.50.
SYN | Synapse (Weekly)
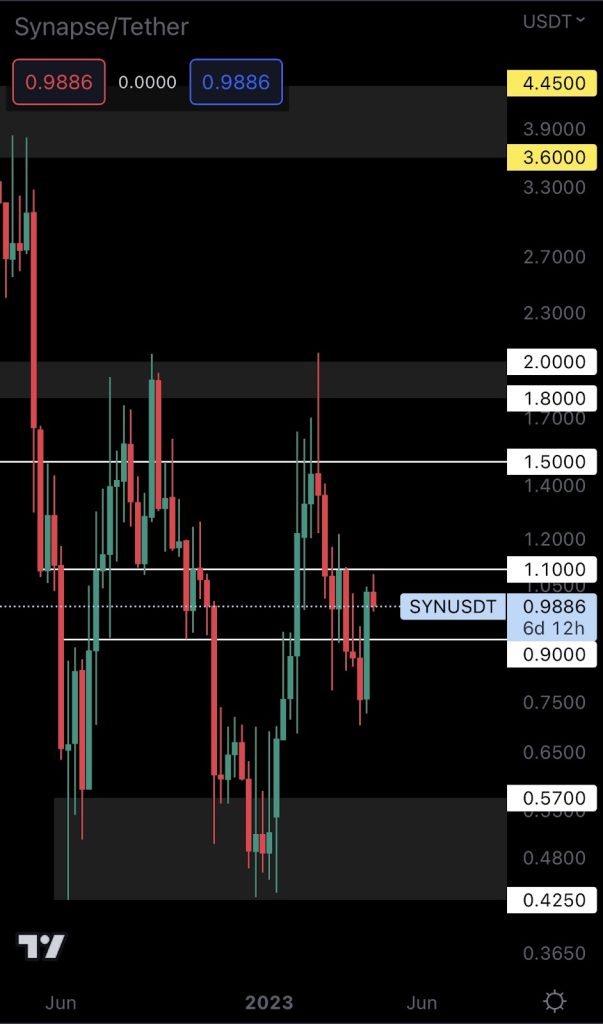
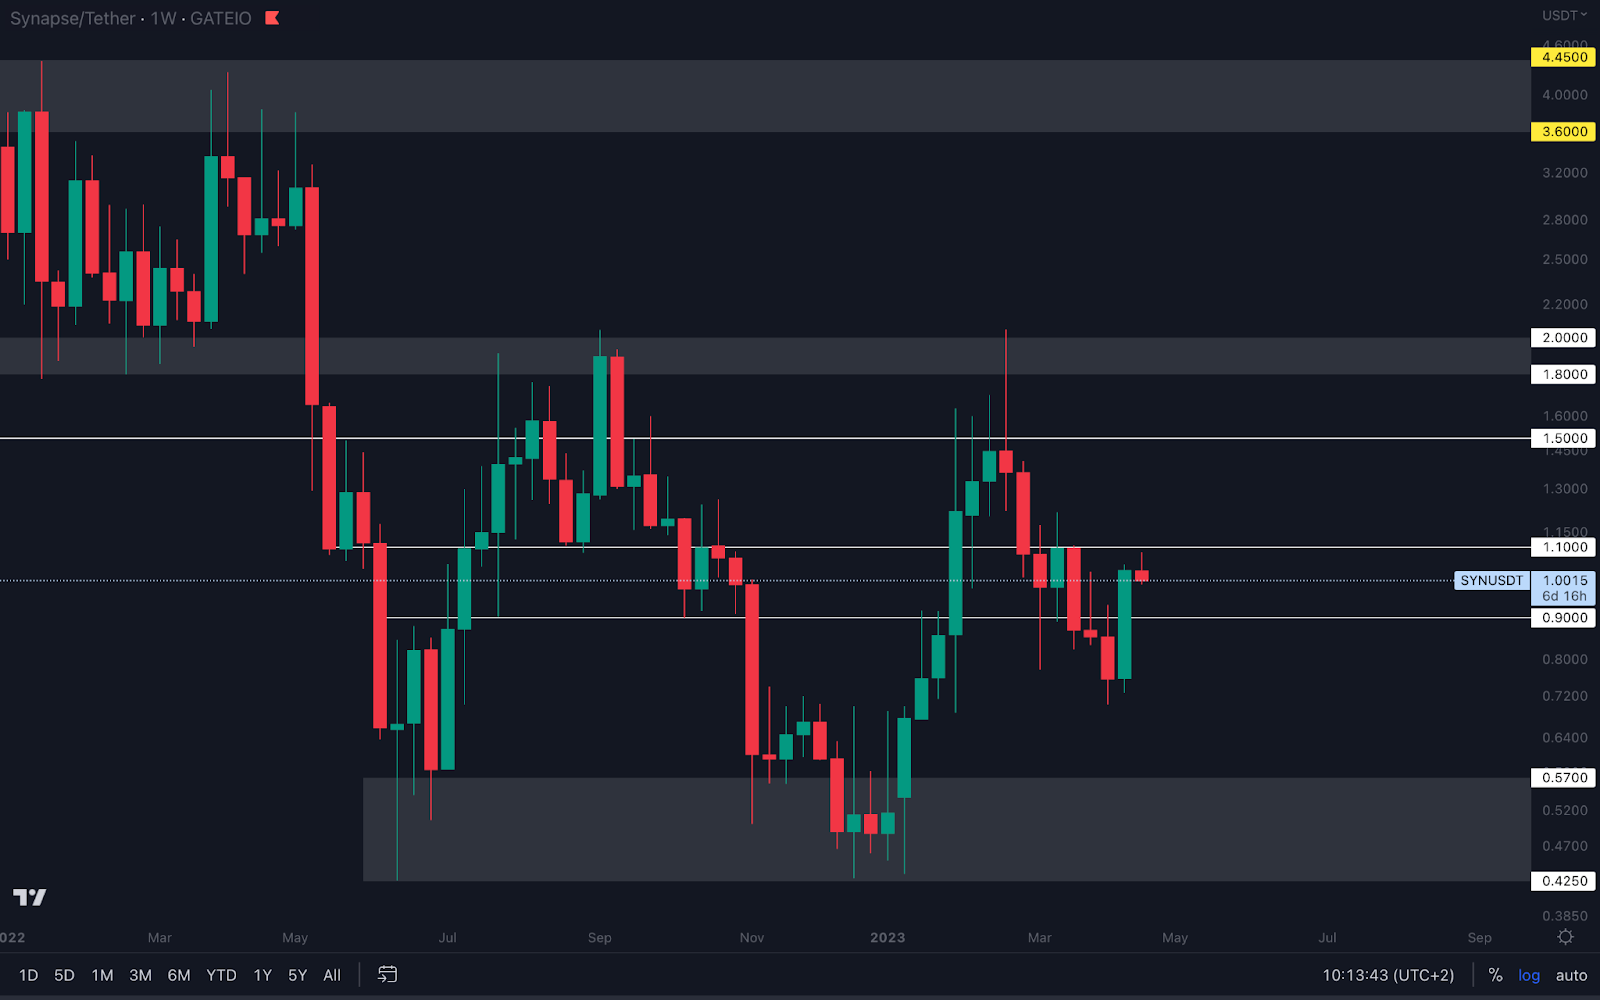
SYN saw a ~36% increase last week, flipping $0.90 into support. Today, SYN tested $1.10 as resistance, so that’s where our attention is for the time being.
Closing a weekly candle above $1.10 will put SYN on track for $1.50. In the meantime, the asset will likely range between $0.90 and $1.10 until either one of these levels is broken.
MINA | Mina Protocol (Weekly)
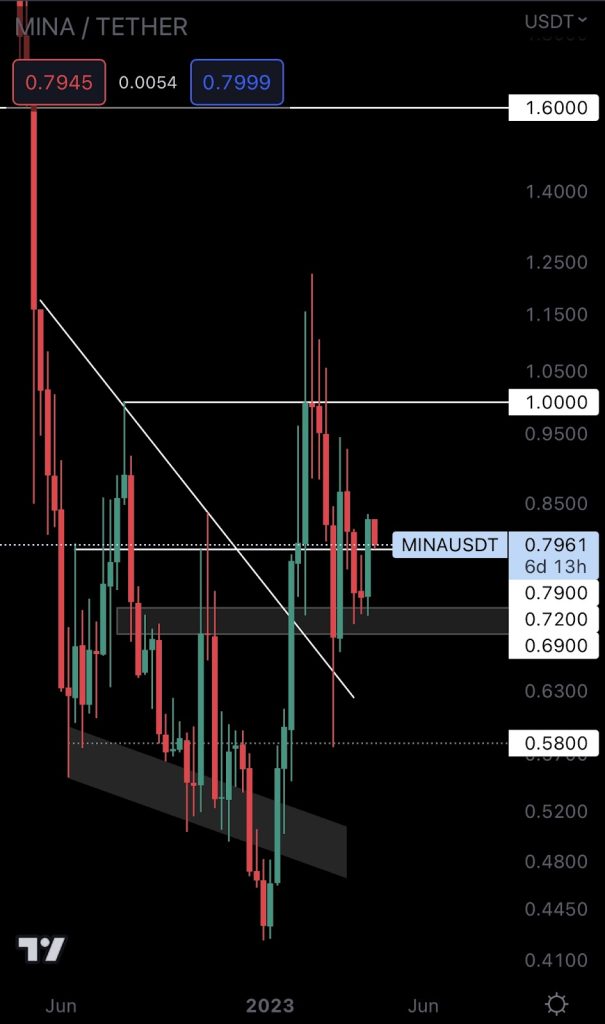
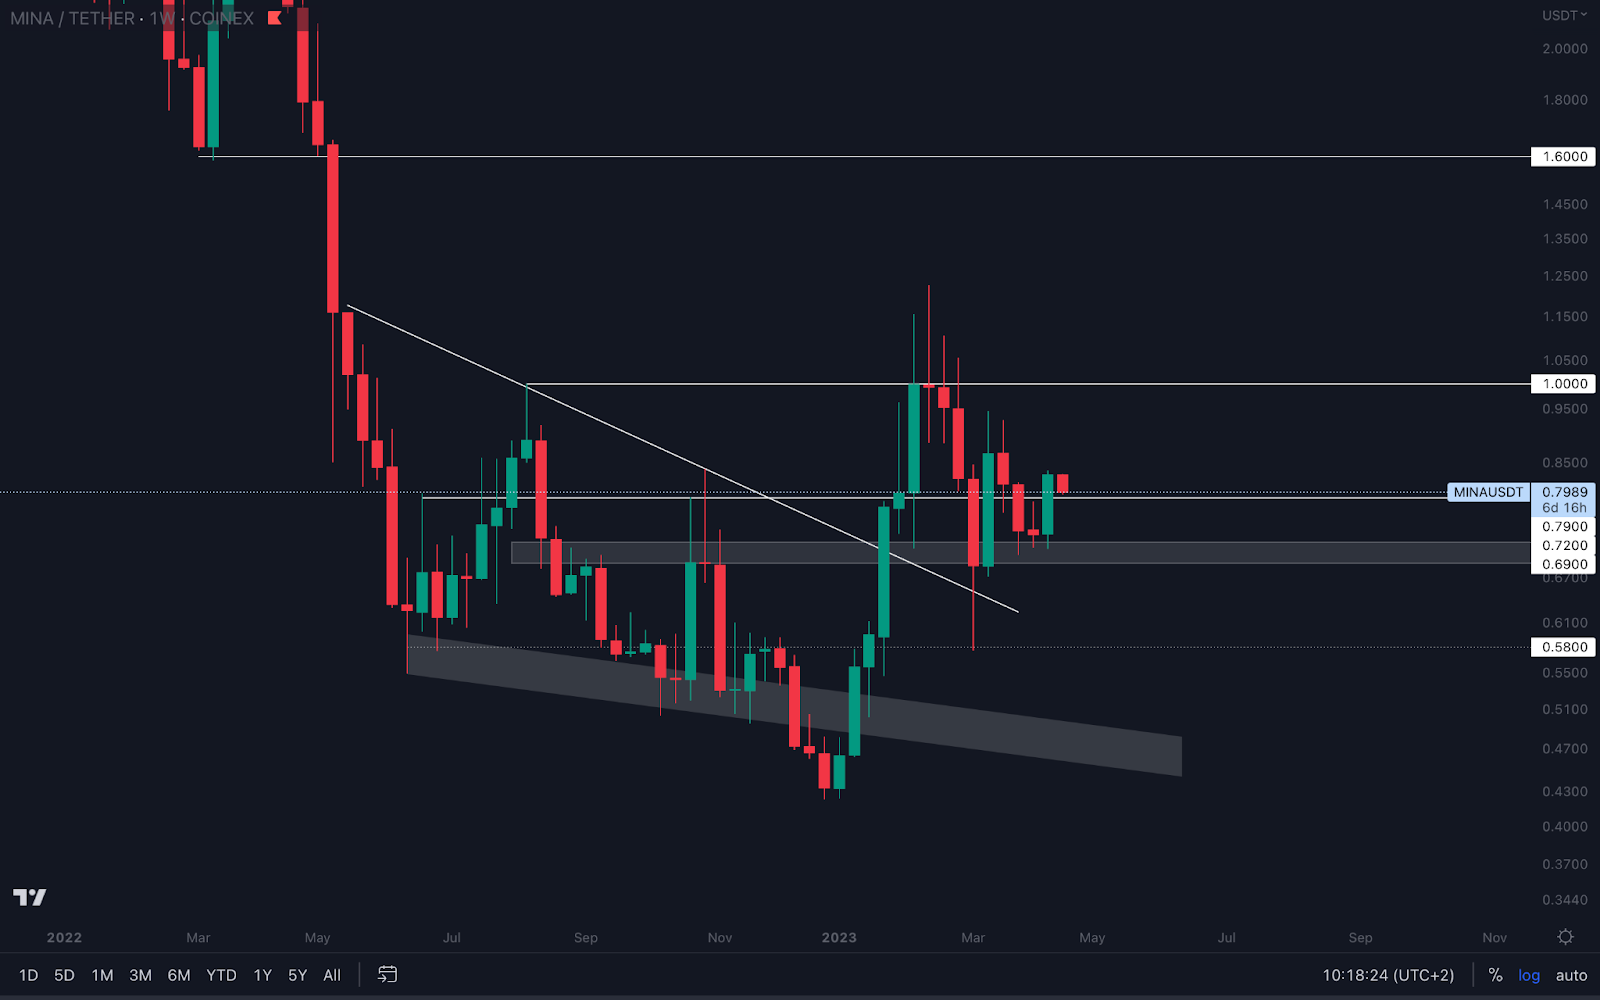
After staking out $0.69 - $0.72 as support, MINA bounced and closed the week above $0.79, flipping this level into support. The asset is now on track for $1 unless we see a weekly closure under $0.79.
Astar | ASTR (Daily)
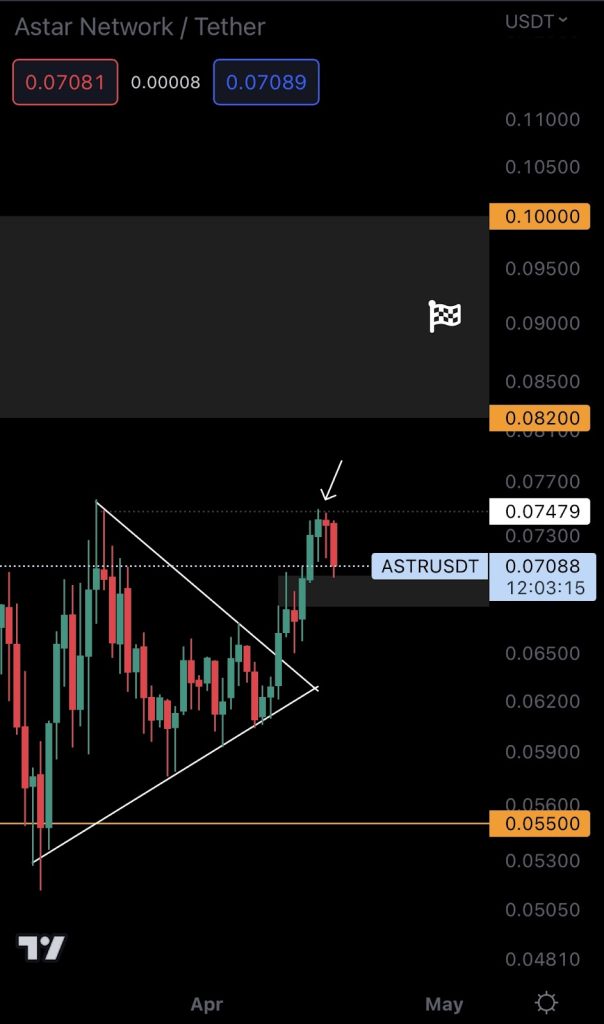
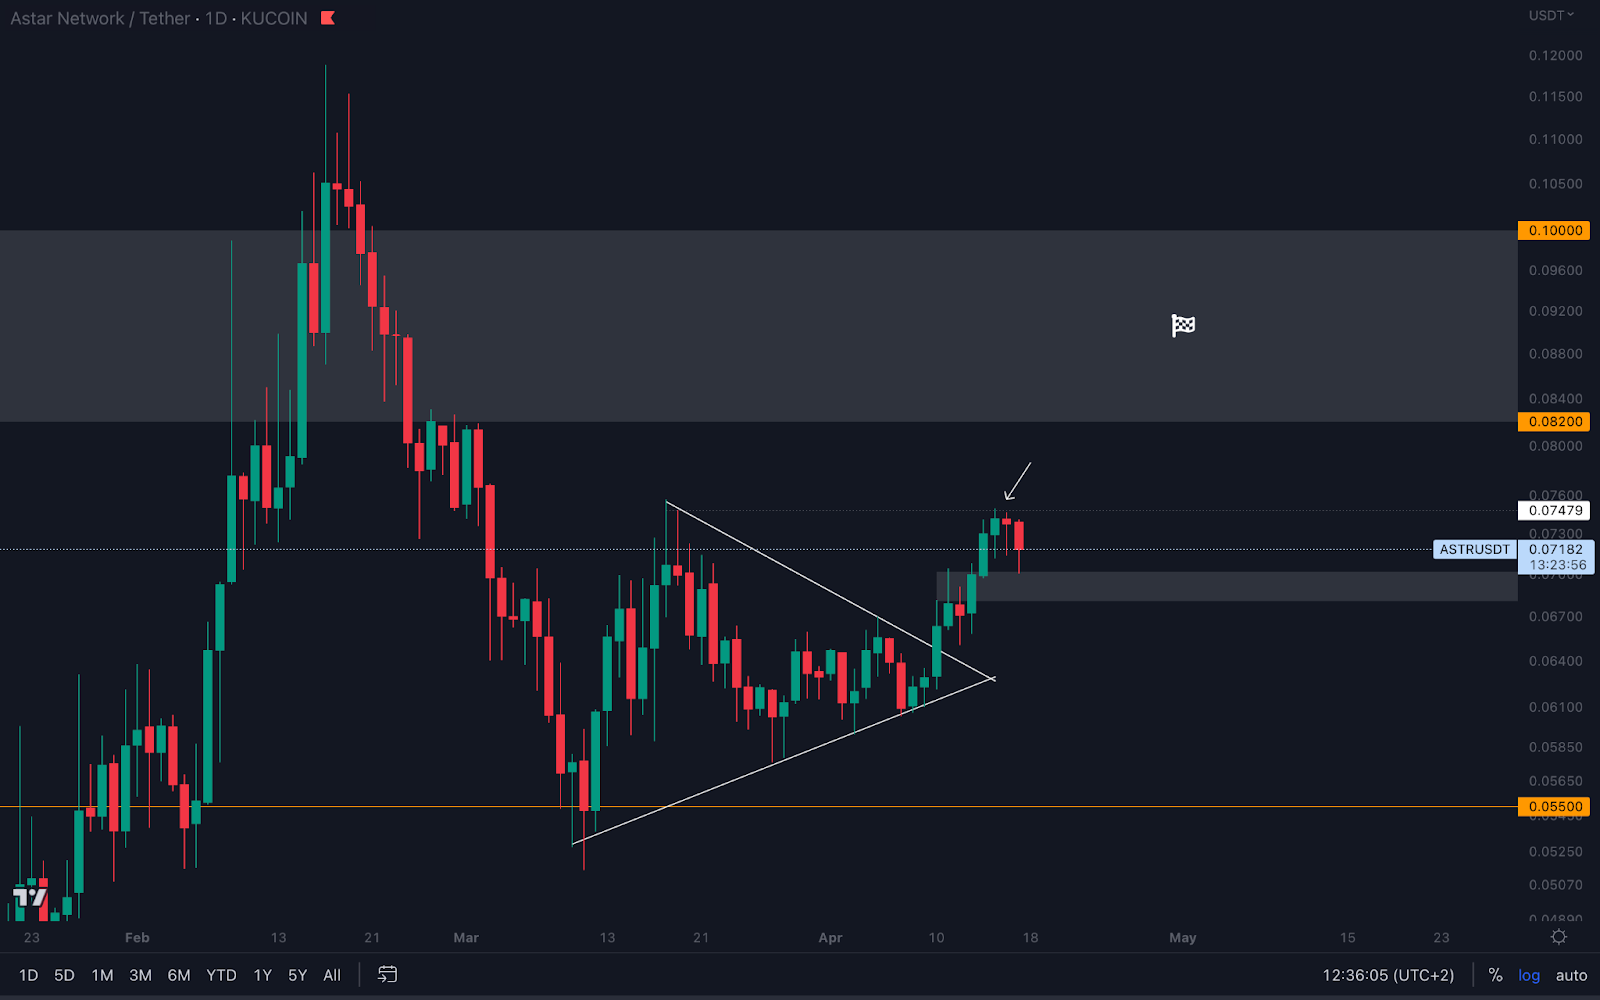
ASTR has been performing well since the breakout from this symmetrical triangle, but yesterday’s candle hints at a local top.
Fortunately, that doesn’t affect its path toward $0.082, and a local top could provide an opportunity for a second entry. We’ve highlighted a potential region in which ASTR could form a higher low on the daily timeframe and continue rising. Nonetheless, the asset remains on track for $0.082.
THOR | THORSwap (Weekly)
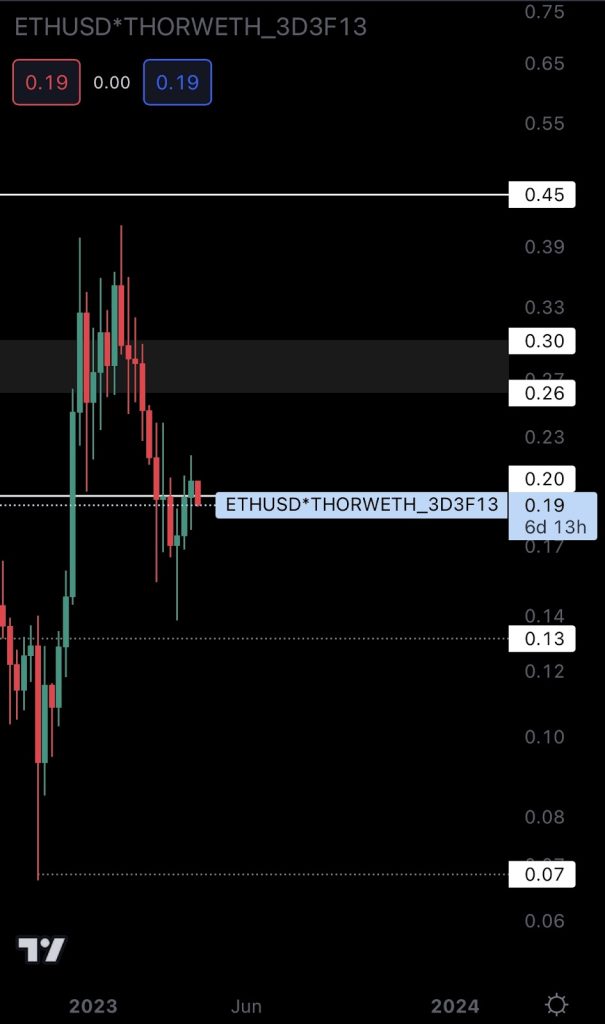
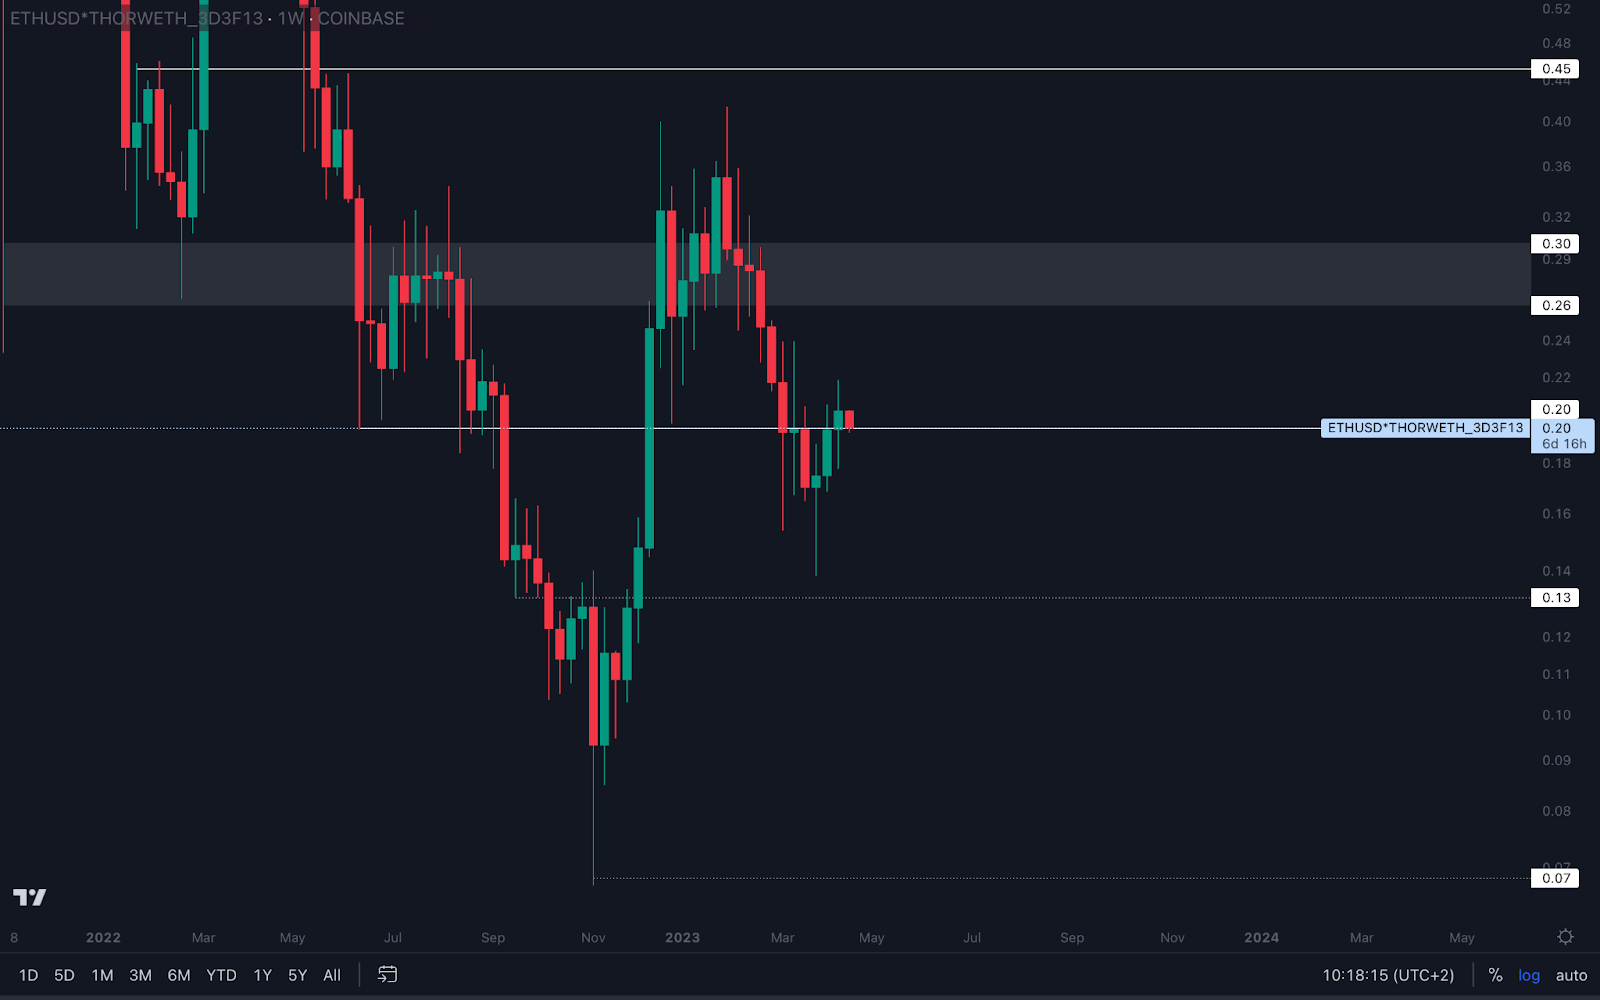
THOR flipped $0.20 into support last week, so only losing this level can invalidate further upside. As long as it holds $0.20 as support on the weekly timeframe, THOR is on track for $0.26.
OP | Optimism (Weekly)
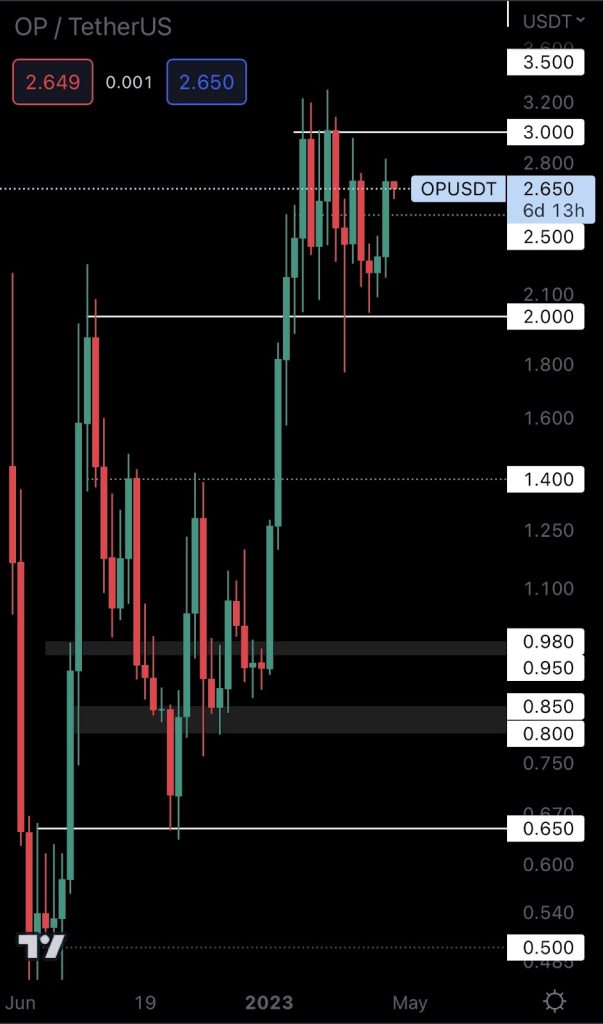
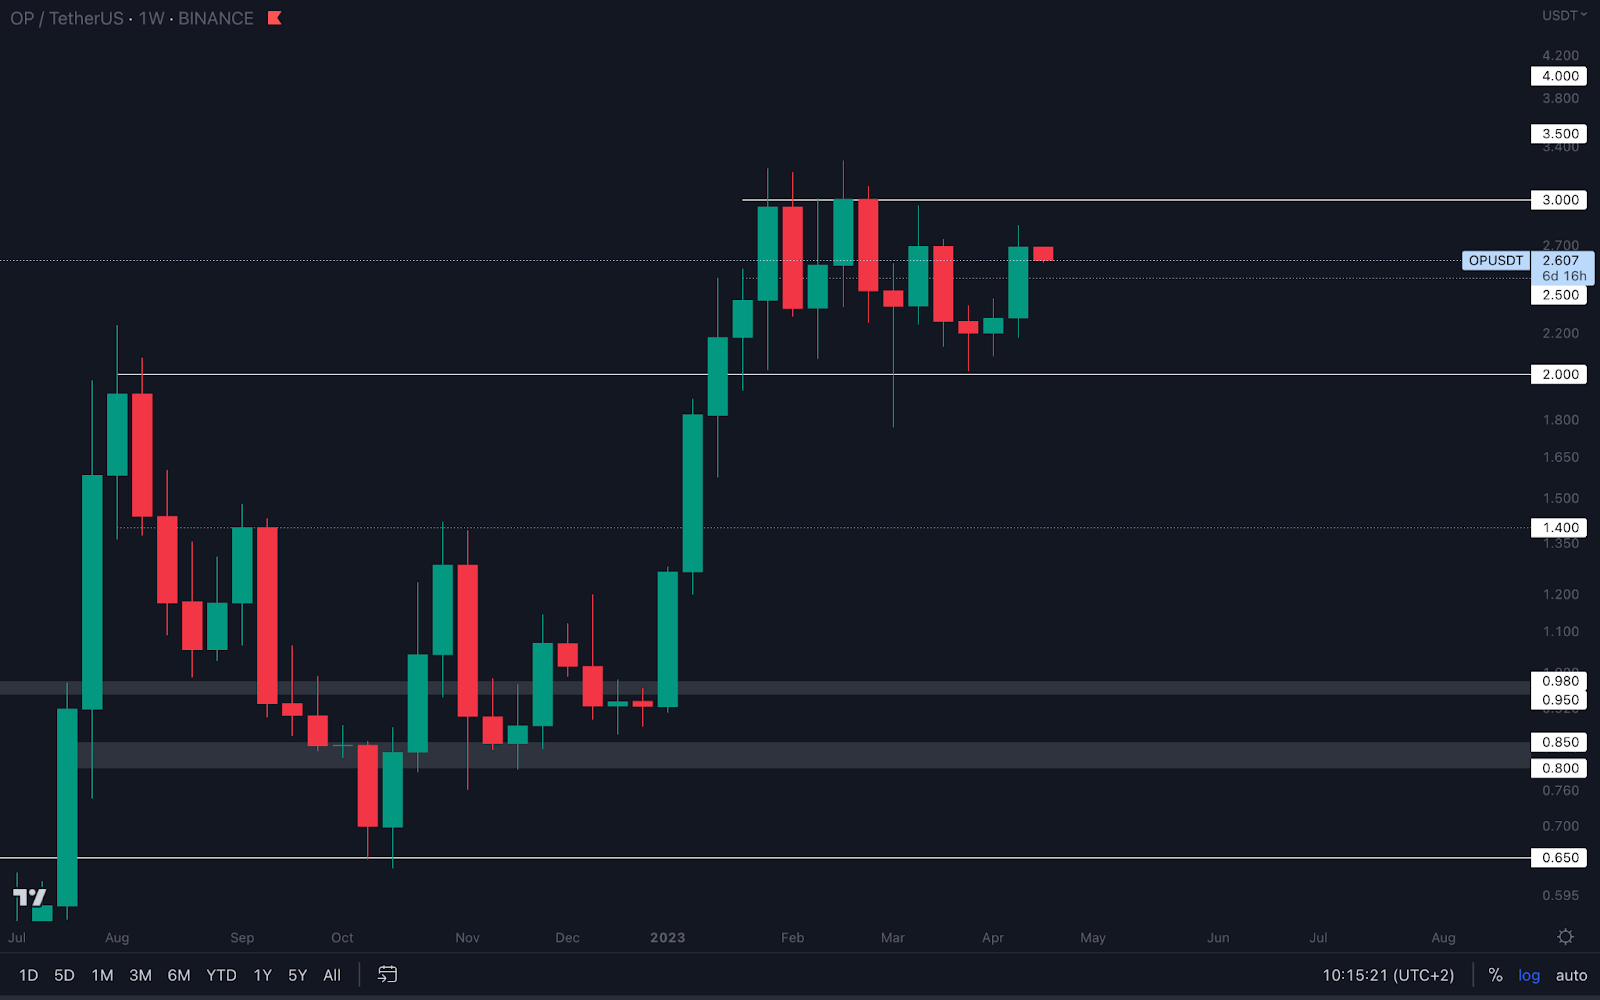
$2.50 has been flipped into support on the OP weekly timeframe. This level was very accurate on short timeframes, which is why it's an important level for OP’s short-term direction.
Holding $2.50 as support on the weekly timeframe will keep the door open for $3. We’ve seen the asset struggle with the $3 mark, so the same can be expected when it tests this level again.
Flipping $3 into support will put OP in price discovery with psychological levels such as $3.5, $4, $5, and so on as potential resistances. In the meantime, expect the asset to range between $2.50 and $3 until one of these levels is broken.
Cryptonary’s take 🧠
The market might have more to offer, but it's important to think about the ratio between risk and reward. Would you rather risk more for little gain, or risk less for more gains?
You already know which one we’d pick.
If you already hold crypto and are looking to sell for profits in the short-term, now might be the best time to do so.
Action points 🎯
- We’ve highlighted both bullish and bearish outcomes for BTC with targets and invalidations. Use that information well when the time comes.
- 👀 on ASTR. This could be a good opportunity in the short-term.
- Picking sides (bullish/bearish) shouldn’t cross your mind. Understand both possibilities, and be prepared for each one in order to profit as much as possible.
Please visit or Discord community with questions and comments.
✌️