Save 23% ($351) & Get a Free 1-1 Call with our Team ⏰ : 0d 2h 59m 43s

Disclaimer: This is not financial or investment advice. You are responsible for any capital-related decisions you make, and only you are accountable for the results.
TLDR:
- Macro: Key data next week (Jobs, PCE, FED) likely to drive markets.
- Powell: Under pressure, but resignation rumours unfounded.
- Trade: US-Japan deal and EU talks lift market sentiment.
- Crypto: Altcoin rally showing signs of overheating, consolidation or pullback likely.
- Outlook: Short-term caution, but bullish through 2025–2026.
Topics covered:
- Macro Data.
- Powell Under Pressure and Trade Deals.
- Indexes and Local Signs of Froth.
- Cryptonary's Take.
Macro Data:
This week is a quiet week on the macro front, with perhaps the data the market is most focused on being the Jobless Claims on Thursday. However, in recent weeks, we've seen Jobless Claims (and Continuing Jobless Claims) remain relatively flat at 220-240k, so it's unlikely that this data release will really move markets.
On the macro data front, next week is jam packed. We have Jobs data (JOLT's on Tuesday and then Unemployment and Non Farms on Friday), Core PCE, Personal Income and Spending on Thursday, and the FED Meeting on Wednesday. From a macro data perspective, next week is likely to set the tone for the upcoming 2-3 months.
We will cover this in greater detail early next week.
Powell Under Pressure and Trade Deals:
FED Chair Powell has been under an onslaught of pressure from the Trump administration for some time now the hope that this pressure will result in him lowering Interest Rates - despite that this is a committee decision and not a one-man decision. In the last week, we've seen this pressure on Powell escalate, with the administration now questioning whether Powell and the FED have overspent on the renovations taking place at the FED. This level of pressure has happened before between Presidents and FED Chairs, although this example is one of the more extreme.
In the last days, we did see rumours circulate that Chair Powell was going to resign from his position. These were just that, rumours, and they're likely to continue to be. Our expectation is for Powell to remain in his position (as FED Chair) until his term is up in mid-2026, and should he be fired or resign, it would really throw into question 'FED independence' and markets would likely react strongly negatively to this.
Trade Deals:
This morning, we woke up to the announcement of a trade deal between the US and Japan. Markets seemed to celebrate a trade deal being done with what was previously touted as a tricky negotiation with Japan, and for the tariff rate to be at 15% rather than the 25% that was initially thrown out by the administration. Markets have also liked this as it potentially increases the likelihood that more trade deals get done, and at the lower bound (15%) rather than the higher levels of 25-30%.
We have also seen a more positive tone this morning from Treasury Secretary Scott Bessent, who mentioned that negotiations with the Europeans have been going better than previously expected, and that the August 12th deadline would likely be extended. This is all positive for markets as it removes the worst-case scenarios.
Indexes and Local Signs of Froth:
We'll now dive into the core Crypto Indexes along with some other metrics to assess as to whether there are signs of froth.
Firstly, we'll look at Bitcoin Dominance (BTC.D). Looking at this on the 3-day timeframe, we can see a clear breakdown from 66.0% BTC dominance to 61.0%. 60-61% does represent a horizontal support area in the BTC.D chart, and therefore it's possible that Dominance can put in a small bounce here.
BTC.D 3D Timeframe: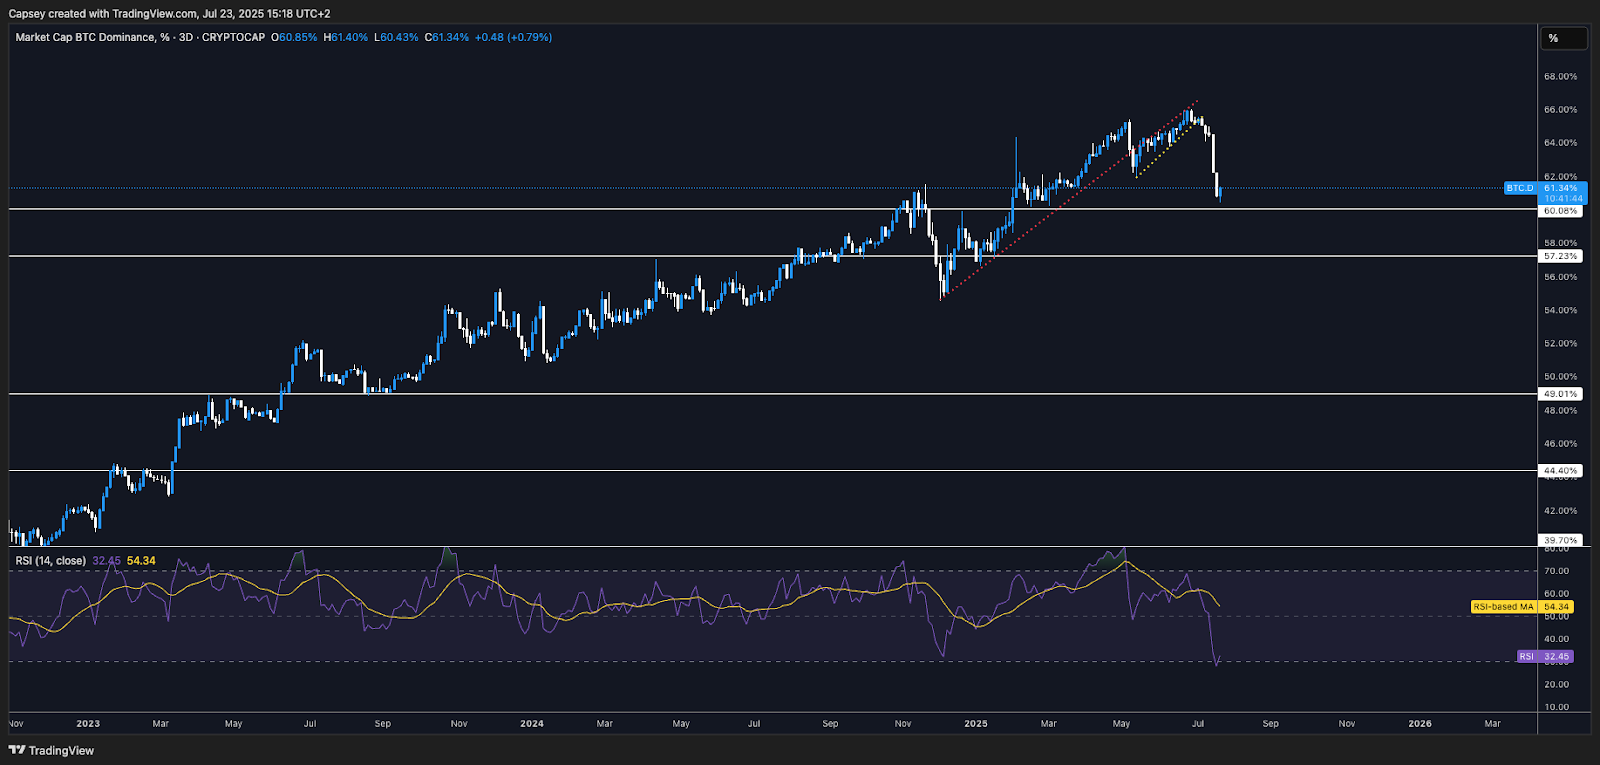
We can also see this breakdown in Bitcoin Dominance reflected in the ETH/BTC chart, which has seemingly bottomed and now made an explosive move higher.
ETH/BTC 3D Timeframe: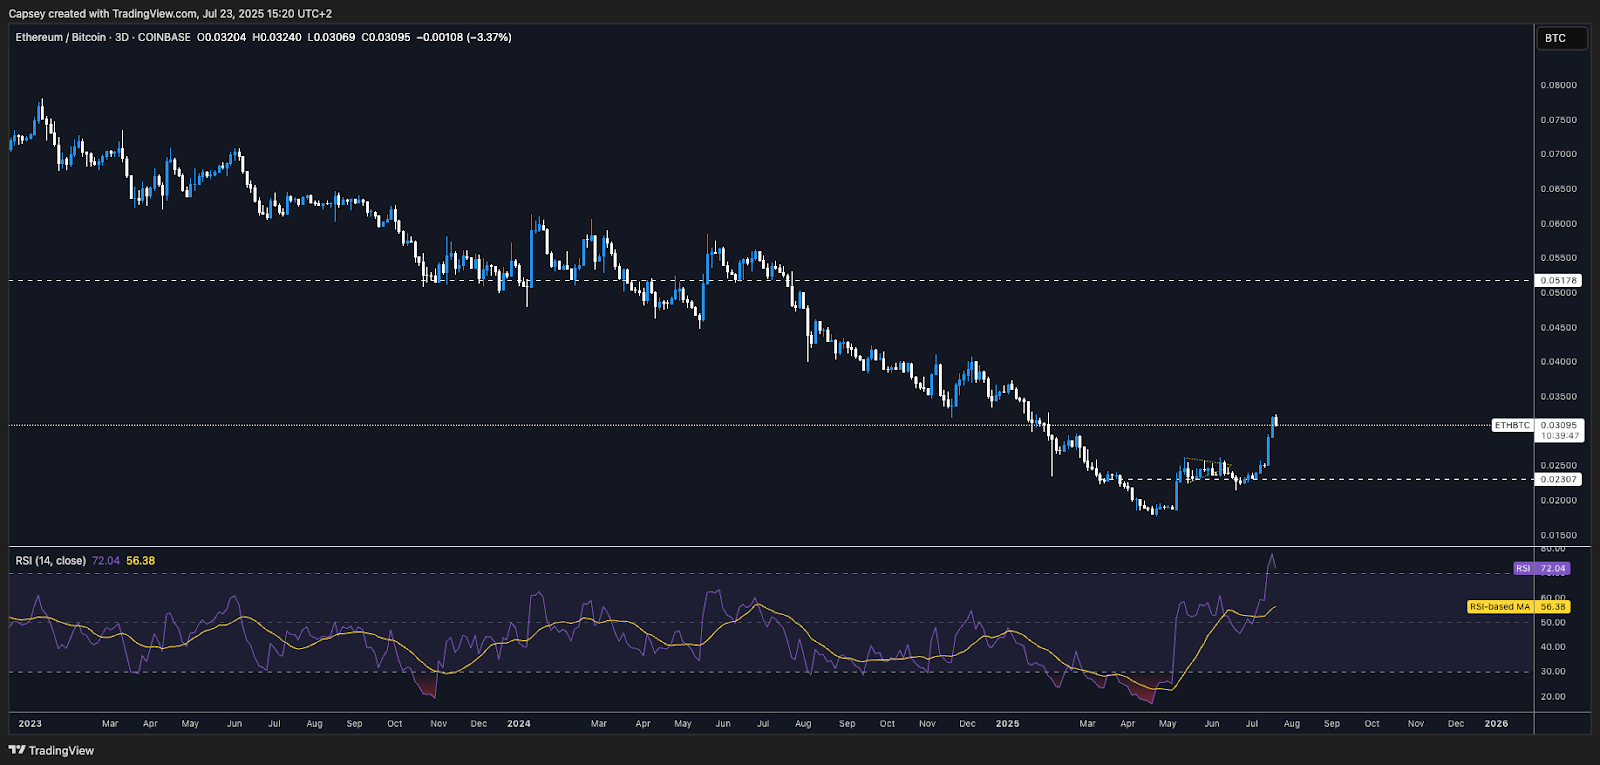
TOTAL3 also confirms the breakout from the rest of the space (excluding BTC and ETH). TOTAL3 broke out of the major horizontal resistance at $930b, and it has made its way to $1.1t, which is a resistance area for this chart.
TOTAL3 3D Timeframe:
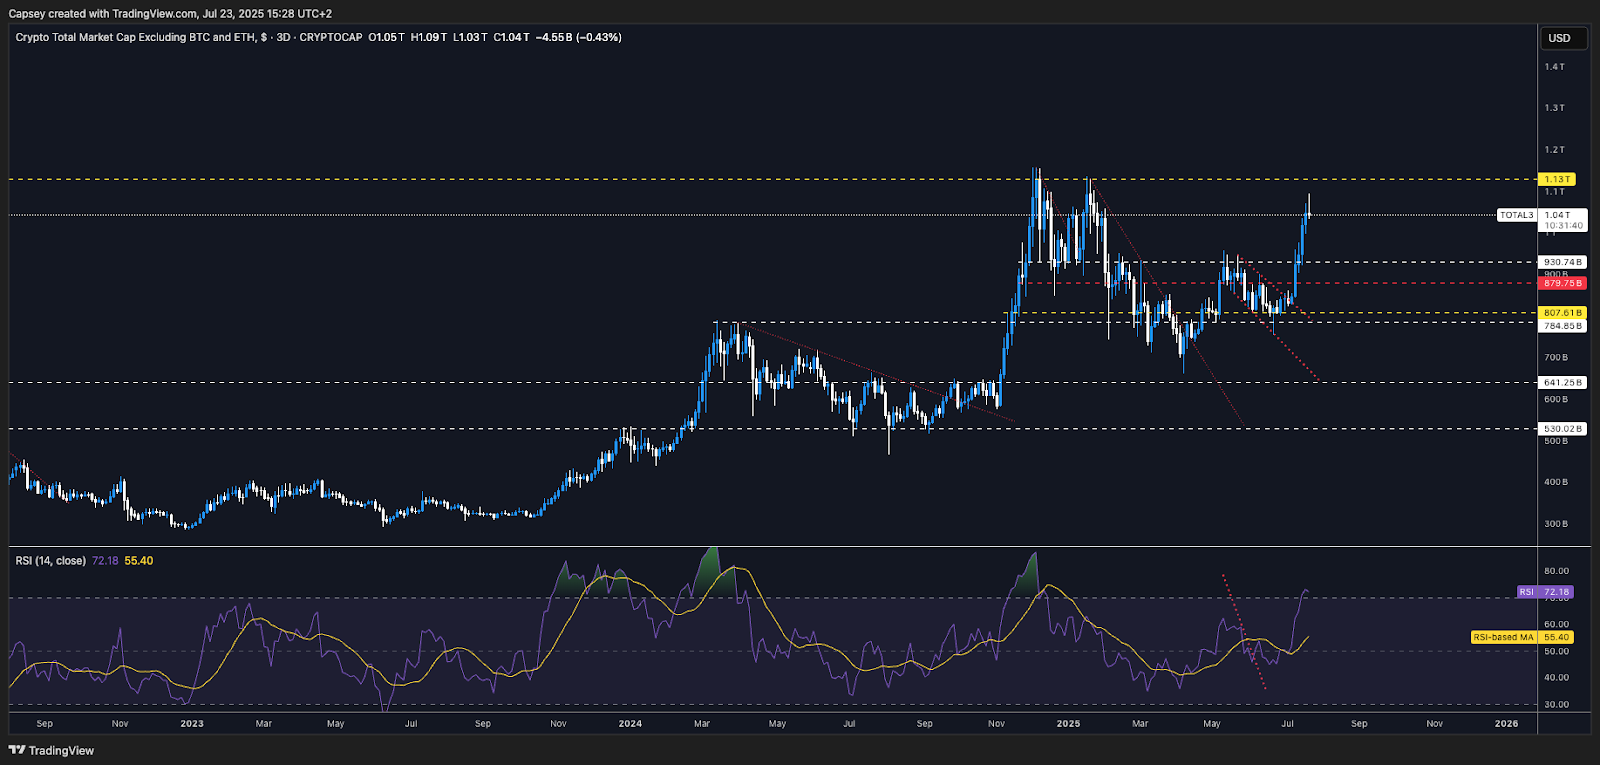
To summarise the above, we can say that there has been a clear breakdown in Bitcoin dominance, which has resulted in a mini "alt season". However, BTC.D has reached a local support, whilst TOTAL3 has reached a resistance level. It's therefore possible that we see a small bounce in Bitcoin Dominance as Alts/Meme's pull back. But, following an explosive run in the Alt/Meme space, a period of consolidation/a slight pull back, is healthy here.
Two charts that support the thesis for a price pull back here is the Speculation Index and the Bitcoin Heater charts. The Speculation Index shows the percentage of altcoins with 90-day returns greater than Bitcoin. High readings suggest heightened speculation and therefore potential over leverage and increasing odds of a pull back for prices.
Speculation Index:
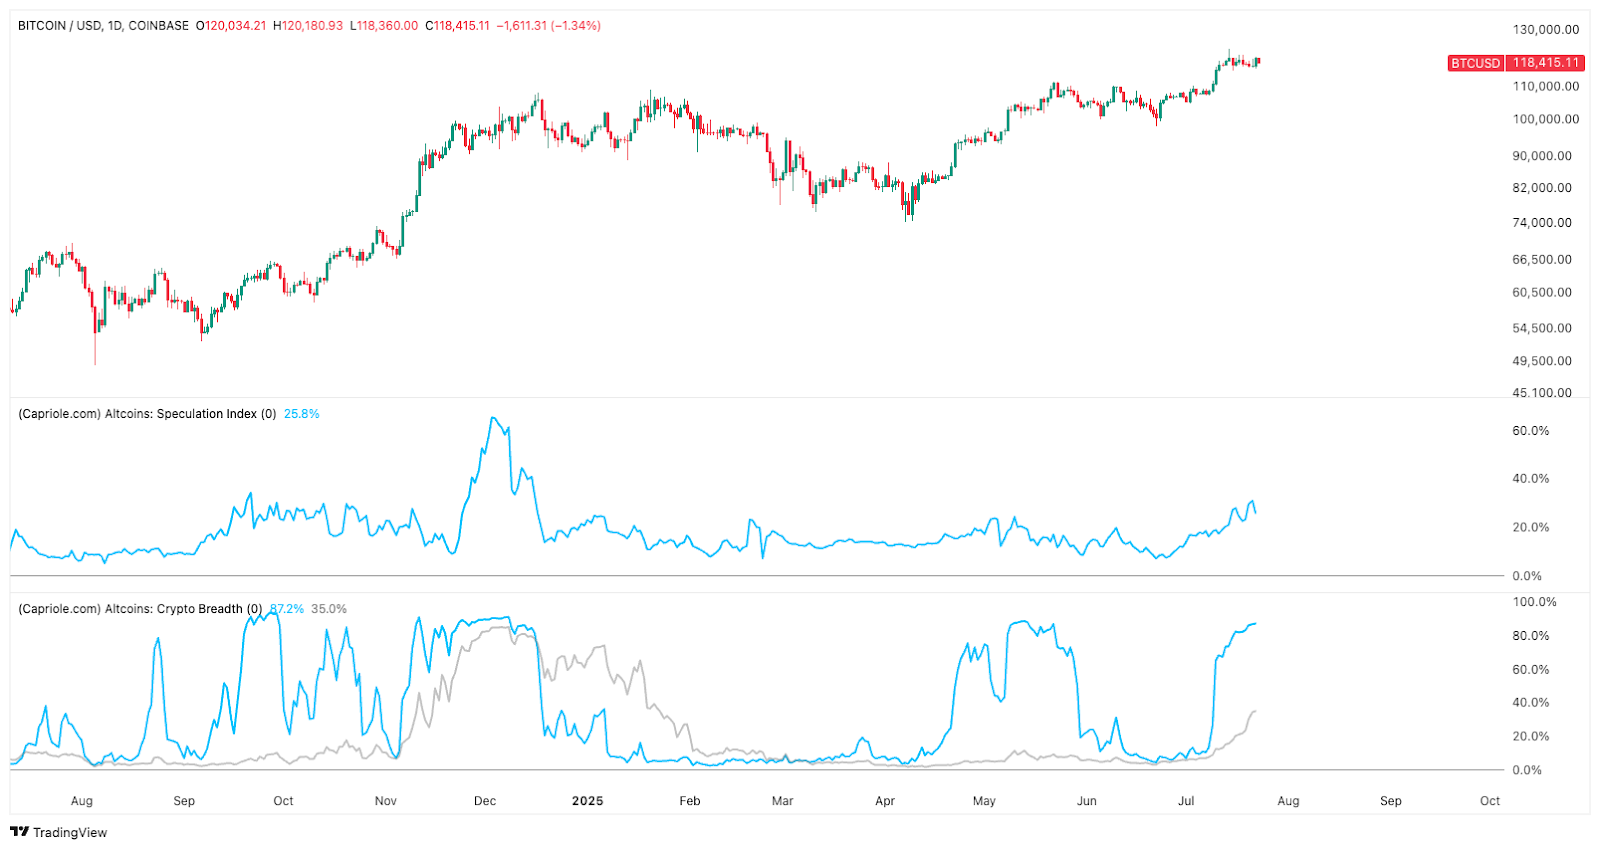
In the above, we can see that this metric has increased substantially, and we should therefore be more cautious in the short-term.
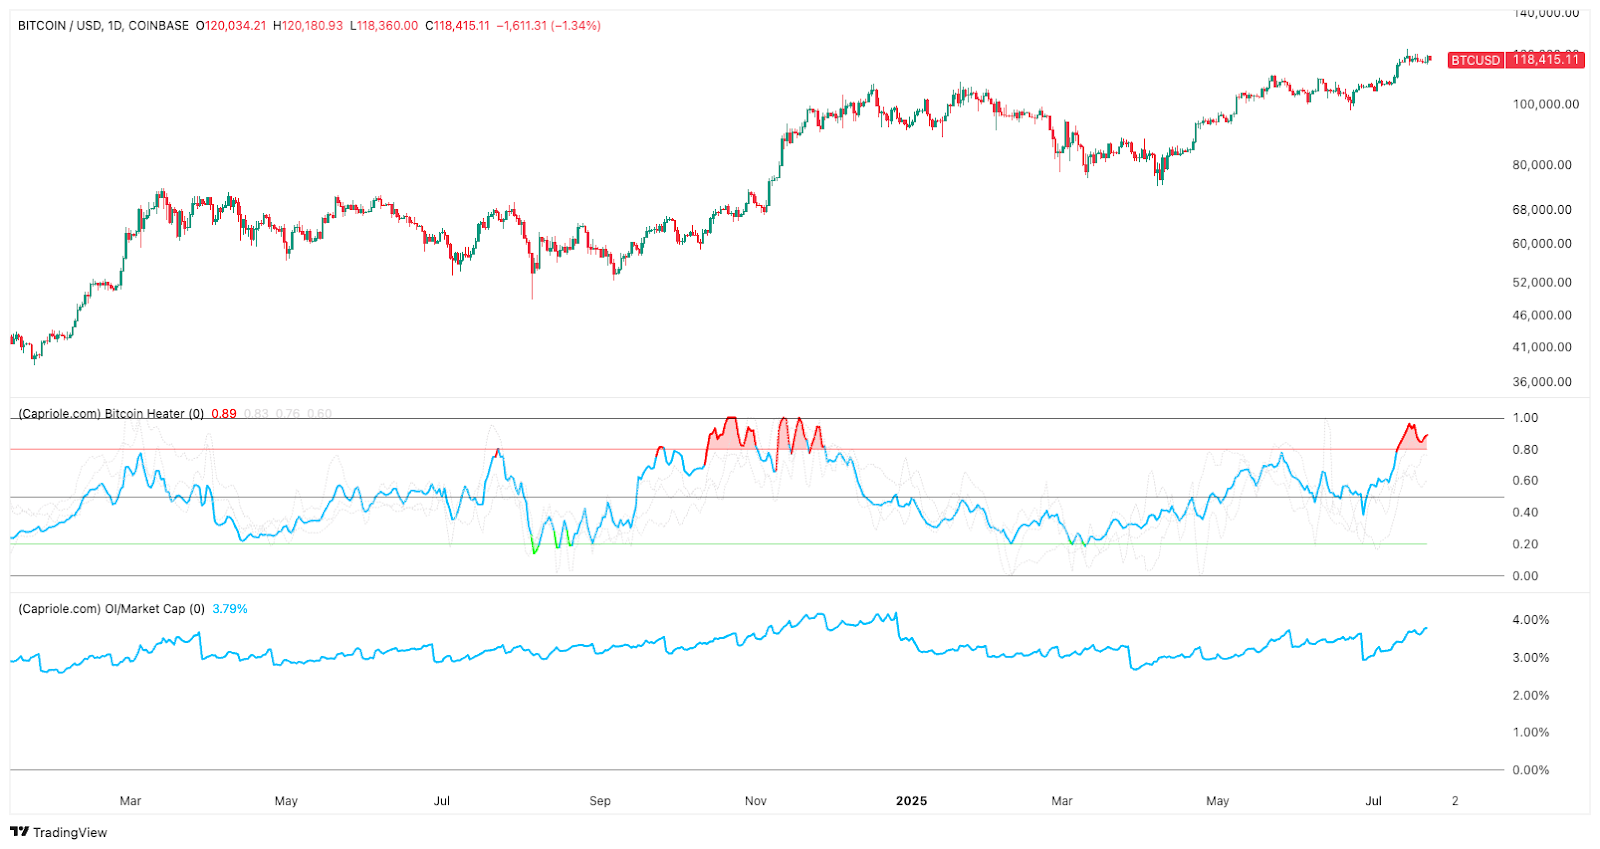
The Bitcoin Heater also reflects this sentiment - heightened speculation, meaning we should increase our level of caution in the short-term.
The Bitcoin Heater is at high levels, indicating increased leverage (speculation) in the market. This is a bearish indicator, and therefore greater caution should be taken here.
Bitcoin Heater:
Cryptonary's Take:
Bitcoin and the rest of the market has become slightly overheated here in the short-term, which we can see from the increased levels of speculation which are shown in the above metrics. As a result, it's possible we see Bitcoin Dominance bounce and Alts/Meme's pull back in the short-term. This would be a healthy development, as for rallies to be sustainable, they need to go through periods of pull backs and consolidation, which essentially shakes out the over-levered players - an almost cleansing effect.
The above update has placed a greater focus on the immediate/short-term, where we do now see a pull back or a period of consolidation as highly likely to happen. However, our base case for the remainder of the year is that the FED are going to restart their Interest Rate cutting cycle (beginning in either September or October) and this will spur risk assets (particularly Crypto) to heavily outperform.
We're expecting an extremely positive and fruitful period for the rest of 2025 and going into the first half of 2026.
Recommended from Cryptonary


