Save 23% ($351) & Get a Free 1-1 Call with our Team ⏰ : 0d 2h 59m 44s
Market Update: BTC Near Value Zone as Tariff Noise Peaks
Markets remain on edge as Trump’s renewed tariff threats against China inject fresh volatility across risk assets. Gold’s explosive rally appears to be losing steam near $4,400, while Bitcoin is showing early signs of stabilisation after a full leverage reset. Should you be buying? Let's dive in...
Disclaimer: This analysis is for informational purposes only and is not financial advice.
TLDR:
- Tariffs: Trump’s 155% China tariff threat adds volatility; deal expected by Nov 10th but failure could trigger short-term market selloff.
- Gold vs BTC: Gold’s rally shows signs of topping near $4,400; potential consolidation could create upside room for BTC.
- BTC Setup: Leverage reset (Bitcoin Heater < 0.20) and negative funding rates suggest buy conditions, but flows remain weak.
- Positioning: Long-Term Holders still selling and ETF flows inconsistent, sustained upside needs improvement in both.
- Outlook: BTC may bottom between $101k–$106k; dips in this zone seen as long-term buying opportunities amid expected Fed rate cuts into 2026.
Topics covered
- Trump's Tariffs and Their Potential Market Reaction.
- Gold's Explosive Moves and What It Might Mean for BTC.
- How Is BTC Positioned?
- Cryptonary's Take.
Trump's Tariffs and Their Potential Market Reaction
In the last 24 hours, we've had new comments from Trump on the trade tensions between the US and China. Trump said, "as of Nov 1st, tariffs on China will be about 155%" and "higher tariffs on China won't be sustainable for them".We’re continuing to see this hardline approach from Trump despite him also saying that he expects a deal to be reached.
We've also seen similar comments from White House Senior Advisor Kevin Hassett, who has "high confidence that Trump and Xi will come to an agreement".
Ultimately, both sides need each other and, therefore, it's our base case that a new trade deal is agreed by the November 10th deadline, although we expect to see more headline volatility between now and then.
If a new trade deal isn't reached by the deadline, markets will likely react negatively to this initial news, despite it probably being a good opportunity to buy quality assets.
Gold's Explosive Moves and What It Might Mean for BTC
Recently, Gold has been on a tear higher; however, yesterday, we saw a 5% move down, which resulted in a significant bid coming into BTC, driving the price from $107k swiftly up to $114k.But as Gold wicked into $4,000, it was bid back up, recovering to $4,140, and BTC unwound its entire move up with price now trading back in the $107k's.
BTC Overlayed Against Gold - 1 Hour Timeframe
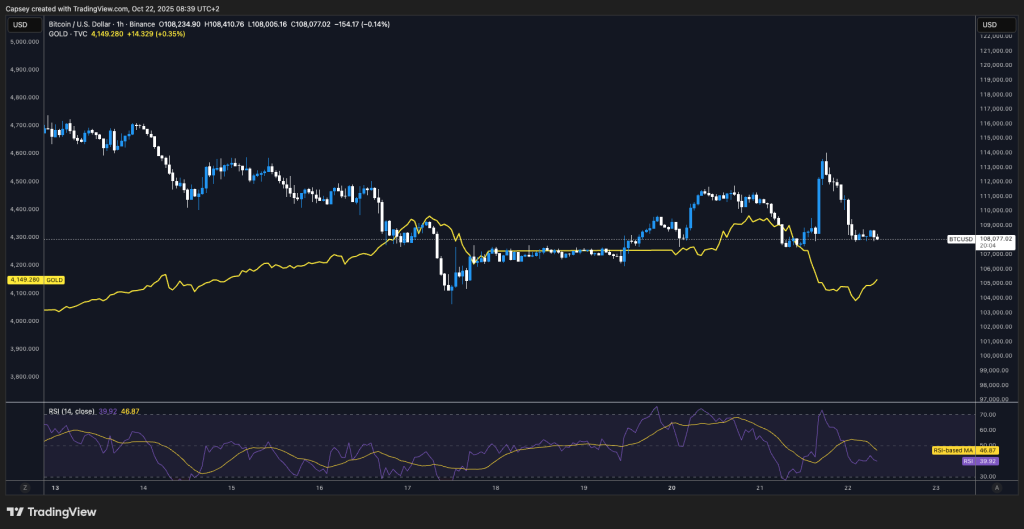
In this 1h candlestick chart, we can see that as Gold moved higher, BTC came down. This then followed a swift move down for Gold in which BTC moved higher. Gold has now stabilised and bounced, and the BTC move higher was unwound.
BTC has struggled for performance for most of 2025, with prices being at the same level ($107k) as mid-December 2024, particularly when we compare it to Gold's performance: Gold is up 57%, whereas BTC is up just 10%.
However, Gold and BTC hold an inverse correlation. We can see in the chart below that when Gold pulls back or consolidates, that's when BTC sees outperformance to the upside. And when Gold moves higher, BTC consolidates or pulls back. This is shown in the chart below with the orange shaded area representing Gold consolidation with BTC outperformance.
Gold and BTC Correlation
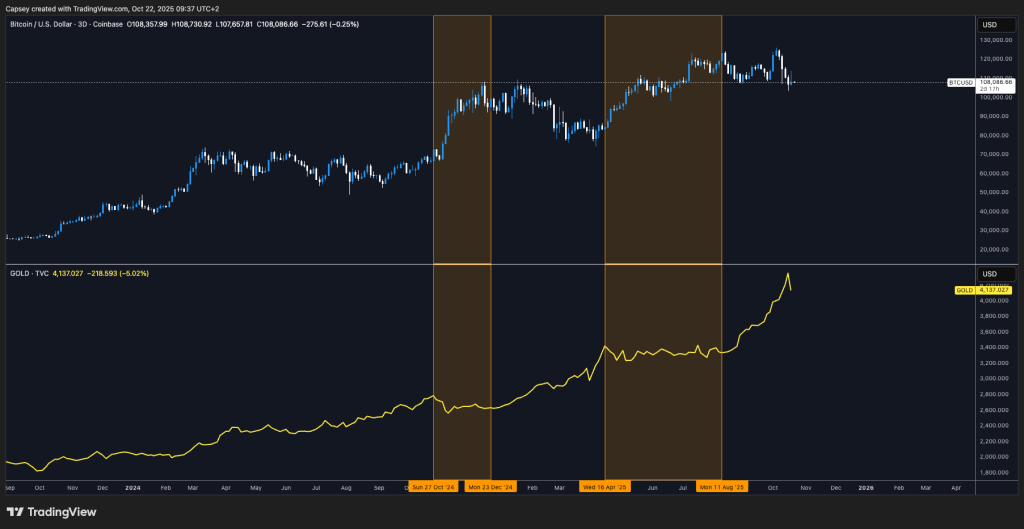
Gold can keep going higher in the near-term, but we're seeing a few top signs (people queuing outside stores to buy physical Gold) that suggest to us that perhaps the greater likelihood in the short and medium term is for Gold to consolidate between $4,000 and $4,400, despite the fundamental case for Gold remaining solid. This would potentially give way for BTC to outperform in the medium term. But, Gold will top out and consolidate at some point, and there, we’d expect BTC to see a substantial rally as a result.
How Is BTC Positioned?
We're now nearly 2 weeks on from the 10/10/2025 deleveraging event, and we've seen Majors mostly grind lower, filling their 10/10/2025 wicks.But despite the price moving lower, we've seen a healthy resetting in the leverage metrics such as the Bitcoin Heater and Funding Rates. The Bitcoin Heater is a metric that shows the overall level of the leverage market. Low readings indicate good buying opportunities, whereas high readings indicate lots of built-up leverage that usually needs to be flushed out.
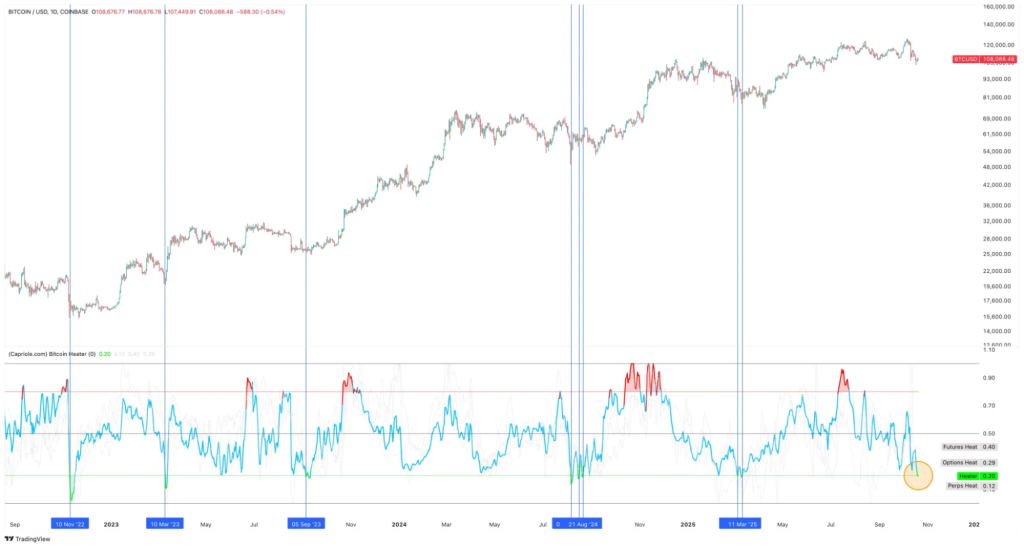
The Bitcoin Heater has now fully reset, and it's below its 0.20 reading - this has historically been a good buying opportunity.
Bitcoin Heater
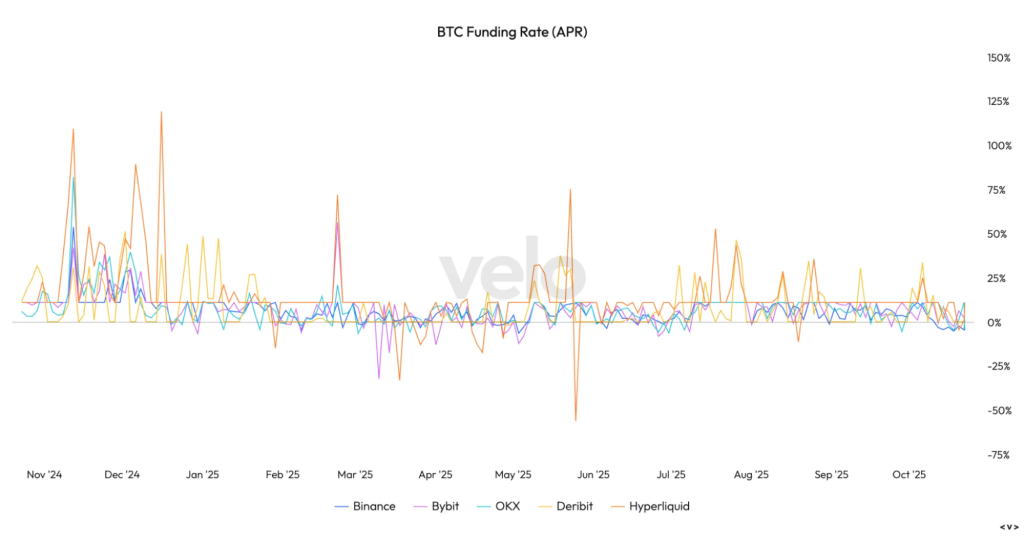
Alongside this, Funding Rates across most exchanges are in negative territory. When price is at local lows, and Funding Rates remain negative for a period of days, this has historically been a good buying opportunity. We can see that the last time Funding Rates were negative for a few days was late-June 2025, where BTC moved up to $107k (from $100k), a Short-squeeze played out, and BTC was at $120k 10 days later.
BTC Funding Rates
Funding Rates are the rates paid between Longs and Shorts. A negative rate indicates that Shorts are paying Longs the premium to be Short. If increased negative Funding Rates persist for more than just a short period, this can lead to a Short squeeze.
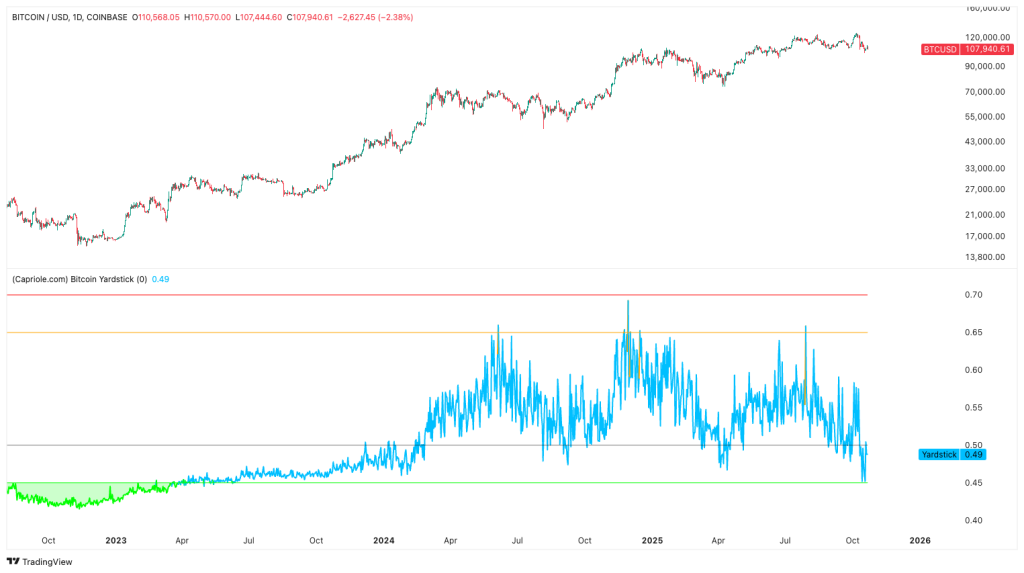
Some on-chain models are showing that BTC is in value territory, for instance, the Bitcoin Yardstick (another metric from Capriole) - the Yardstick is taking the ratio of energy work down to secure the Bitcoin network in relation to price. Lower readings = cheaper Bitcoin. This metric has recently reached its lowest level since mid-2023.
The Bitcoin Yardstick
Credit: Capriole
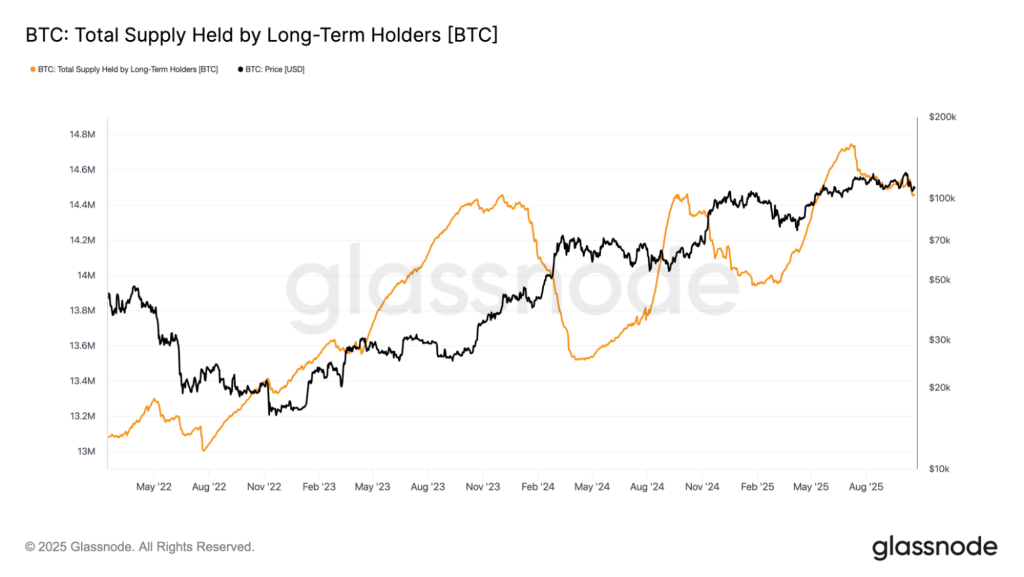
However, despite this, Long-Term Holders have continued to reduce their supply (of BTC) since mid-July, which has been a headwind for price, and ETF flows are inconsistent and nondirectional.
Long-Term Holders
Long-Term Holders continue to reduce their supply. We'd like to see this metric bottom and begin sloping higher again.
ETF Flows
ETF Flows are currently nondirectional.
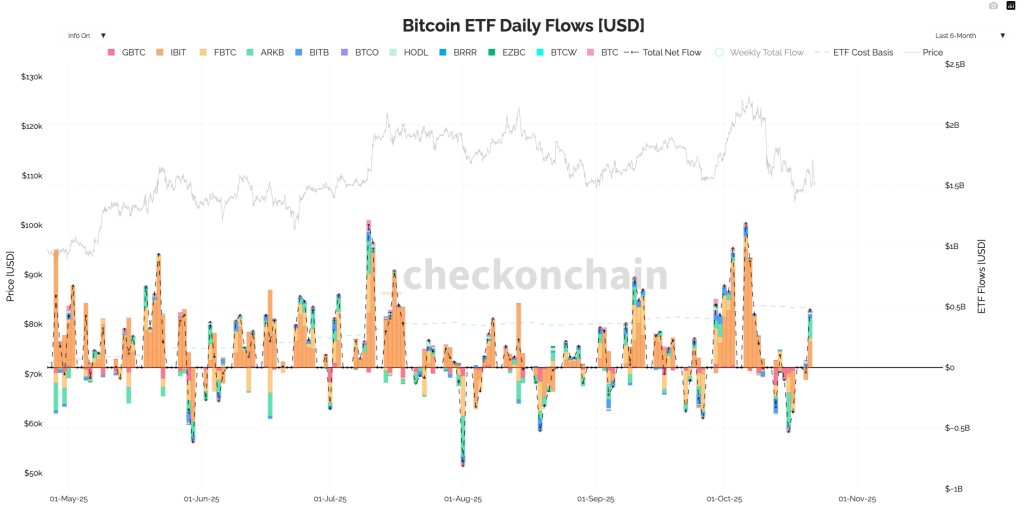
From a leverage perspective, the fundamentals are there for price to form a local bottom, but for more significant upside to happen, we'd need to see the flows improve, i.e., stronger ETF inflows, and for Long-Term Holders to stop reducing their supply (preferably for them to increase it).
We saw yesterday that price can move up substantially as there's less liquidity in orderbooks. But for these moves to be sustained, we will need to see the flows (ETF flows) improve, and hence we'll place increased importance on this going forward.
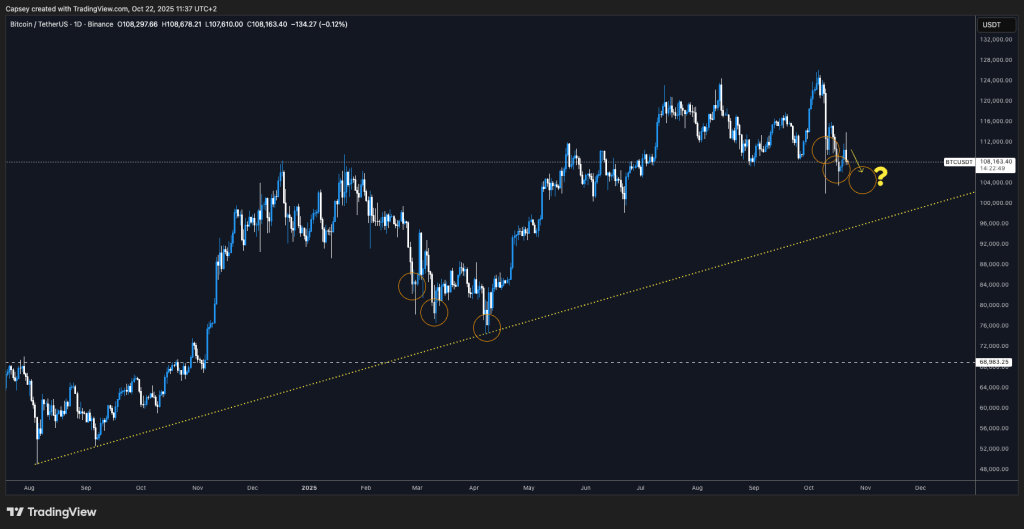
It's still our current thinking that BTC can put in a lower low (similar to the "tariff tantrum" in March) between $101k and $106k, and this would be a long-term buy zone for us.
BTC 1D Chart
Cryptonary's Take
The market is still vulnerable to headline news (mostly tariff-related), and this is likely to be the case for more weeks. However, we do expect a deal to eventually be reached, and therefore, if we do get more significant price pullbacks due to tariff news, we would see those as buying opportunities. This is particularly the case following the leverage and positioning resetting that we've seen, which has essentially cleared out the excess that was built up.If we can then see Gold begin to slow or consolidate, and the BTC ETF flows improve, and the Long-Term Holder Supply start to turn up, then we'd expect this to be a trend change - prices to then start moving higher.
Ultimately, we expect that we're not too far away from a price bottom, and we think this could be between $101k-$106k, although a move into the high $90k's wouldn't invalidate our thesis. Therefore, if price traded in these given price zones, we would look for buys, particularly as we still expect a constructive macro backdrop for at least another 6-9 months with Fed cuts likely to well into 2026, taking the rate below 3.00% - meaning we expect at least 5 more interest rate cuts between now and year-end 2026.
Peace!
Recommended from Cryptonary


