Save 23% ($351) & Get a Free 1-1 Call with our Team ⏰ : 0d 2h 59m 44s

Disclaimer: This is not financial or investment advice. You are responsible for any capital-related decisions you make, and only you are accountable for the results.
TLDR:
- Fed cuts are unlikely before mid-2026, keeping near-term pressure on risk assets.
- Rising US bond yields from sticky inflation and geopolitical risk are weighing on equities and crypto.
- Investors are favouring Gold as a safe haven, while Bitcoin continues to trade like a risk asset.
- Bitcoin fundamentals have weakened, with ETF outflows, renewed long-term holder selling, and a negative Coinbase premium.
- BTC remains in a bear flag, with downside risk toward the low $80k range; overall stance stays risk-off and patient.
- Data This Week & Pricing for Cuts.
- Yields Causing A Headwind for Risk Assets.
- Outlook for Bitcoin.
- Cryptonary's Take.
Data This Week & Pricing for Cuts:
Yesterday, we had a plethora of economic data out; PCE, Jobless Claims, and Personal Spending and Income.In short, the data showed inflation remaining in the high 2 percent (2.8% for both PCE and Core PCE YoY) and Jobless Claims remaining stable. If we pair this with an Unemployment Rate of 4.4%, we have inflation in the high 2's (percent) whilst the labour market is still relatively resilient, despite the slowdown in hiring that we're seeing.
This allows the Fed to keep rates unchanged for the foreseeable future - that is likely until a new Fed Chair comes in and replaces Powell in mid-May 2026. But, between now and then, the market isn't priced for cuts. The market is currently pricing that the Fed keeps rates unchanged for the next 3 meetings. The next cut is priced for the June meeting, where Powell will no longer be the Chair.
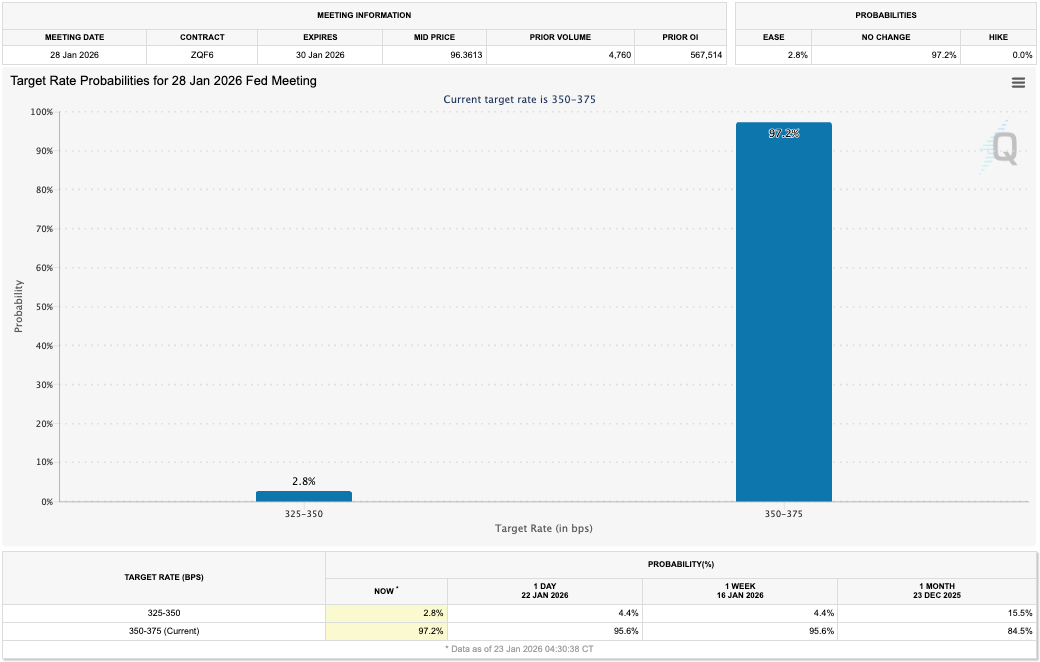
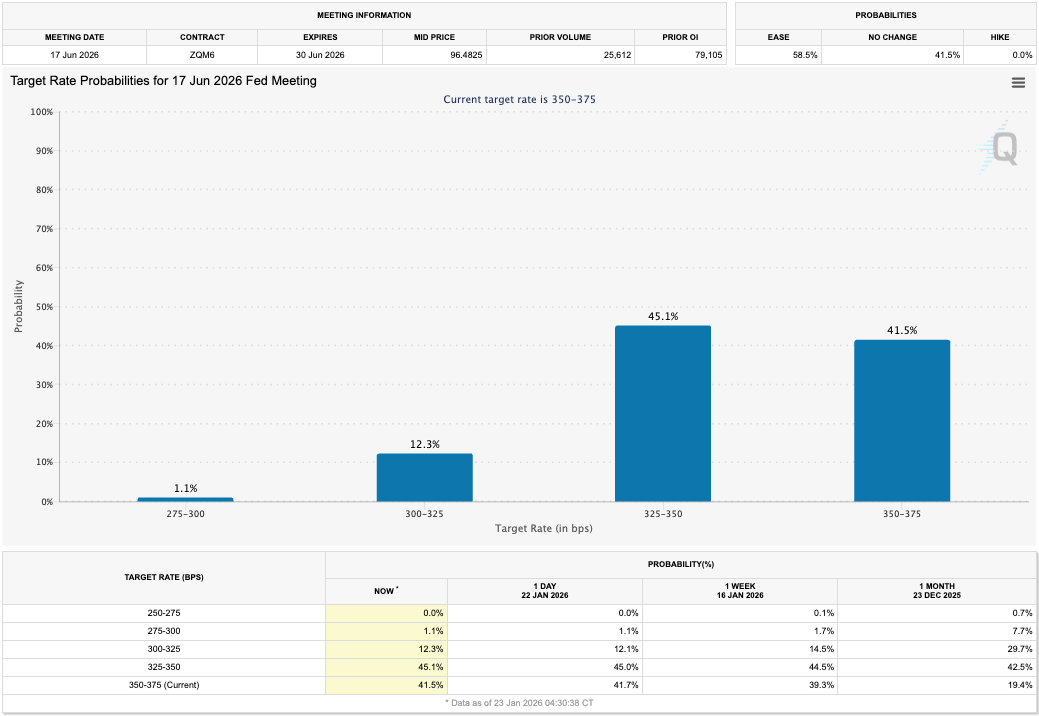
The odds of the Fed keeping rates unchanged at the late-January, mid-March, and late-April meetings are: 97.2% (for January), 84.1% (for March), and 71.9% (for April). However, the odds of the interest rate remaining unchanged at the June Meeting are 41.5%.
Target Rate Probabilities for 28th January 2026 Fed Meeting:
Target Rate Probabilities for 17th June 2026 Fed Meeting:
This is a headwind for risk assets over the coming 1-2 months, particularly Crypto. Now, should Powell's successor start talking very dovishly before he/she takes their seat, the market will begin pricing in more cuts, and this can be a tailwind for risk assets going into May.
But, essentially, this means our current lean is as follows: another tricky few months, say February and March, but for more cuts to start to be priced in April, for May and onwards. So the tailwind for markets is likely from April onwards.
Yields Causing A Headwind for Risk Assets:
In the last 1-2 weeks, we've seen US Bond Yields across the curve move higher, particularly at the long-end. This is due to a number of reasons:1. Renewed trade tensions: This is from the Trump administration putting a 10% tariff on some European countries over the US's want to take control of Greenland. The Trump administration has since undone this. However, it just highlights the volatility that remains around tariffs and the Trumps' administration's use of them - as a threat. The result of this is that countries around the world look to de-risk from US debt in order to reduce the level of control that the US has over them.
2. The Trump administration weaponises its debt: We've seen this recently, where countries may try to move away from the US and therefore buy less US debt, and even sell US debt. Whether the Trump administration is directing this at that specific country or not, others see this, and therefore they make preparations to decouple from the US also.
3. Stickier inflation in the high 2 percent whilst the labour market continues to hold up: Stickier inflation which is then potentially supported by accommodative fiscal policies, limits downside risk for Yields. This is only emphasised further with the odds of future rate cuts decreasing.
4. Trump constantly calls for lower rates and threatening legal action over Fed members: This threatens the Fed's independence, and therefore the sustainability of that country's debt (in this case the US). Again, the result is higher Yields.
5. Geopolitical tensions: perhaps the most relevant example today. Geopolitical tensions between the US and Iran see investors flock to safe assets, although you're seeing the move to safe assets be to Gold and Silver, rather than US debt.
Ultimately, there are a mix of reasons as to why Yields are moving higher. This can be simplified as follows: investors are demanding greater compensation for these increasing risks - this is an increase in term premia.
Rising Yields are negative for risk assets for a number of reasons, here are a few:
1. Increases borrowing costs: this squeezes corporate margins, meaning less profits, and therefore lower share prices.2. Higher Yields can result in a shift out of Stocks and into Bonds: why buy Equities when Bonds are receiving a "risk-free" rate of 4.00% say. This means a stock would need to beat 4.00% as its hurdle rate. The higher that hurdle rate, the more attractive Bonds become and the less attractive stocks become.
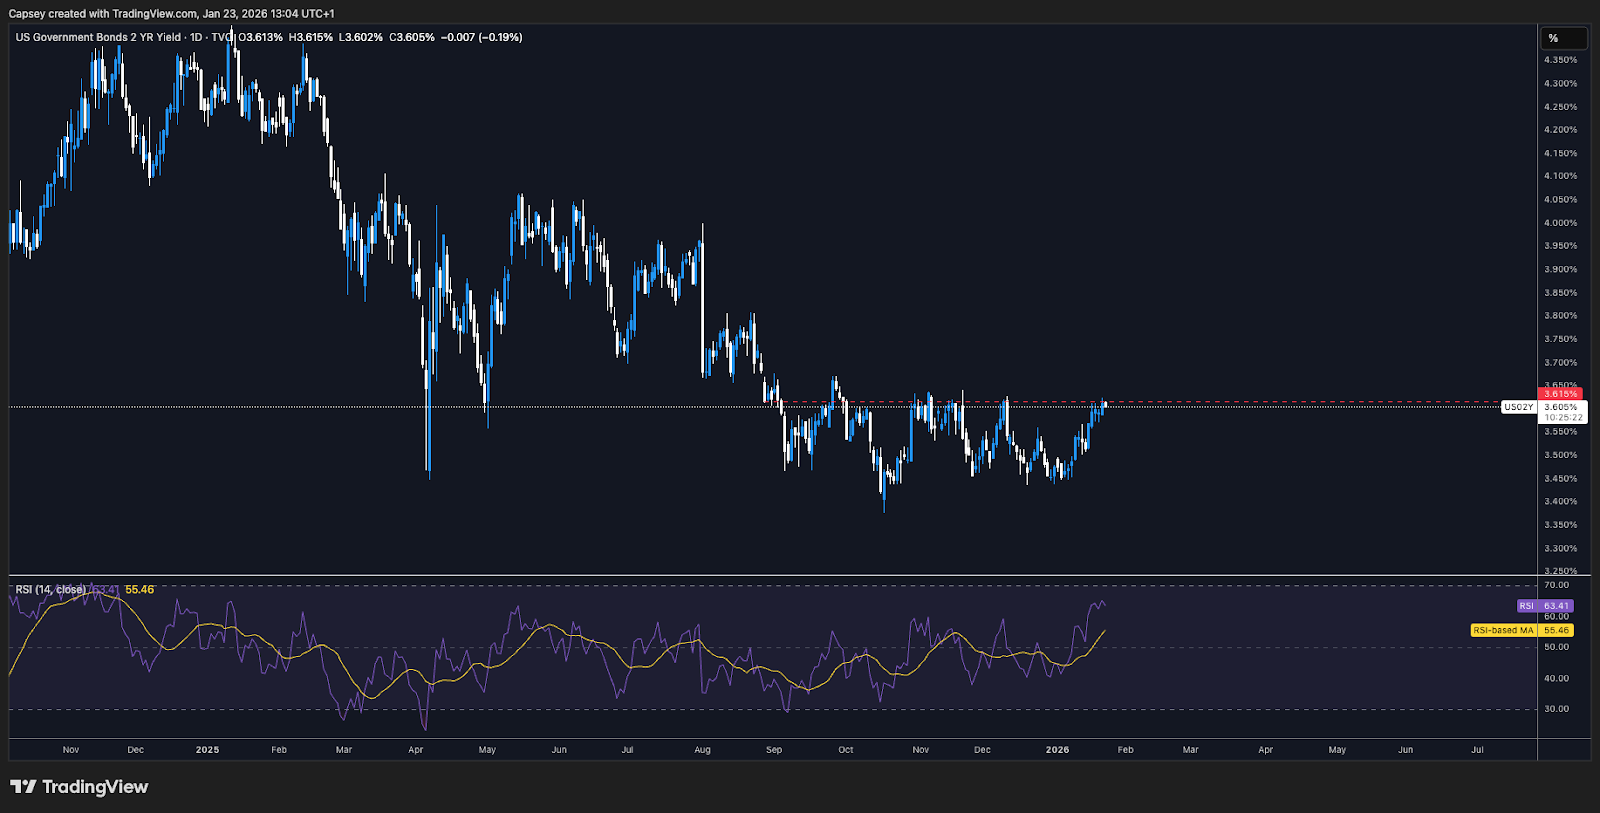
If we then look at the below, we can see that Yields across the curve have broken out to the upside, particularly at the long-end of the curve (US30Y).
US2Y Yield testing resistance:
US5Y Yield has already broken out of its resistance with it coming back down to retest that resistance as new support.
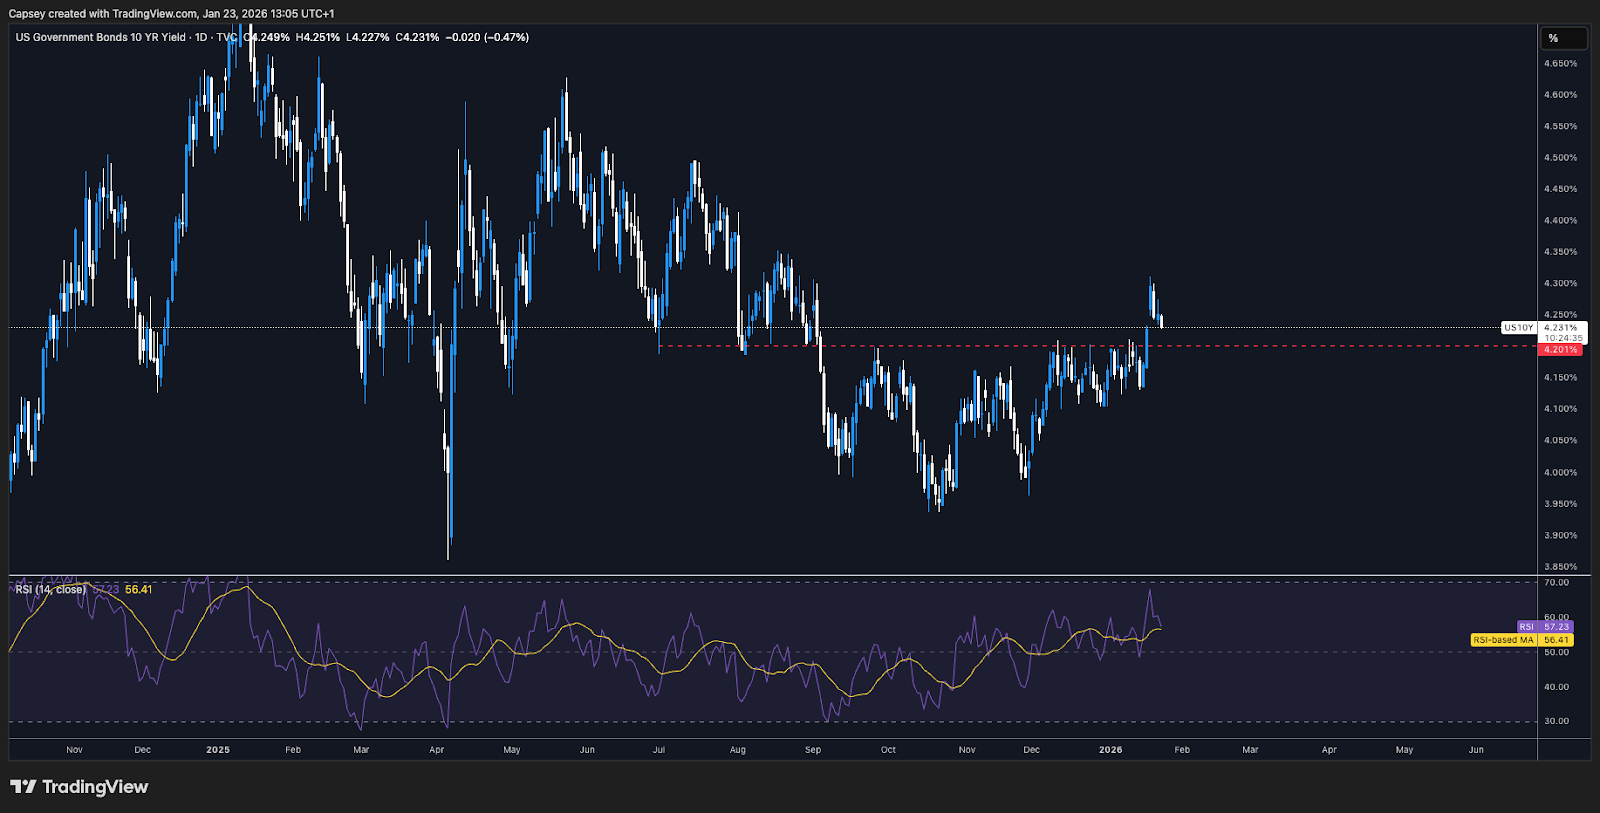
US10Y Yield has also broken out of resistance:

US30Y is pulling back, having broken out to the upside back in mid-December:
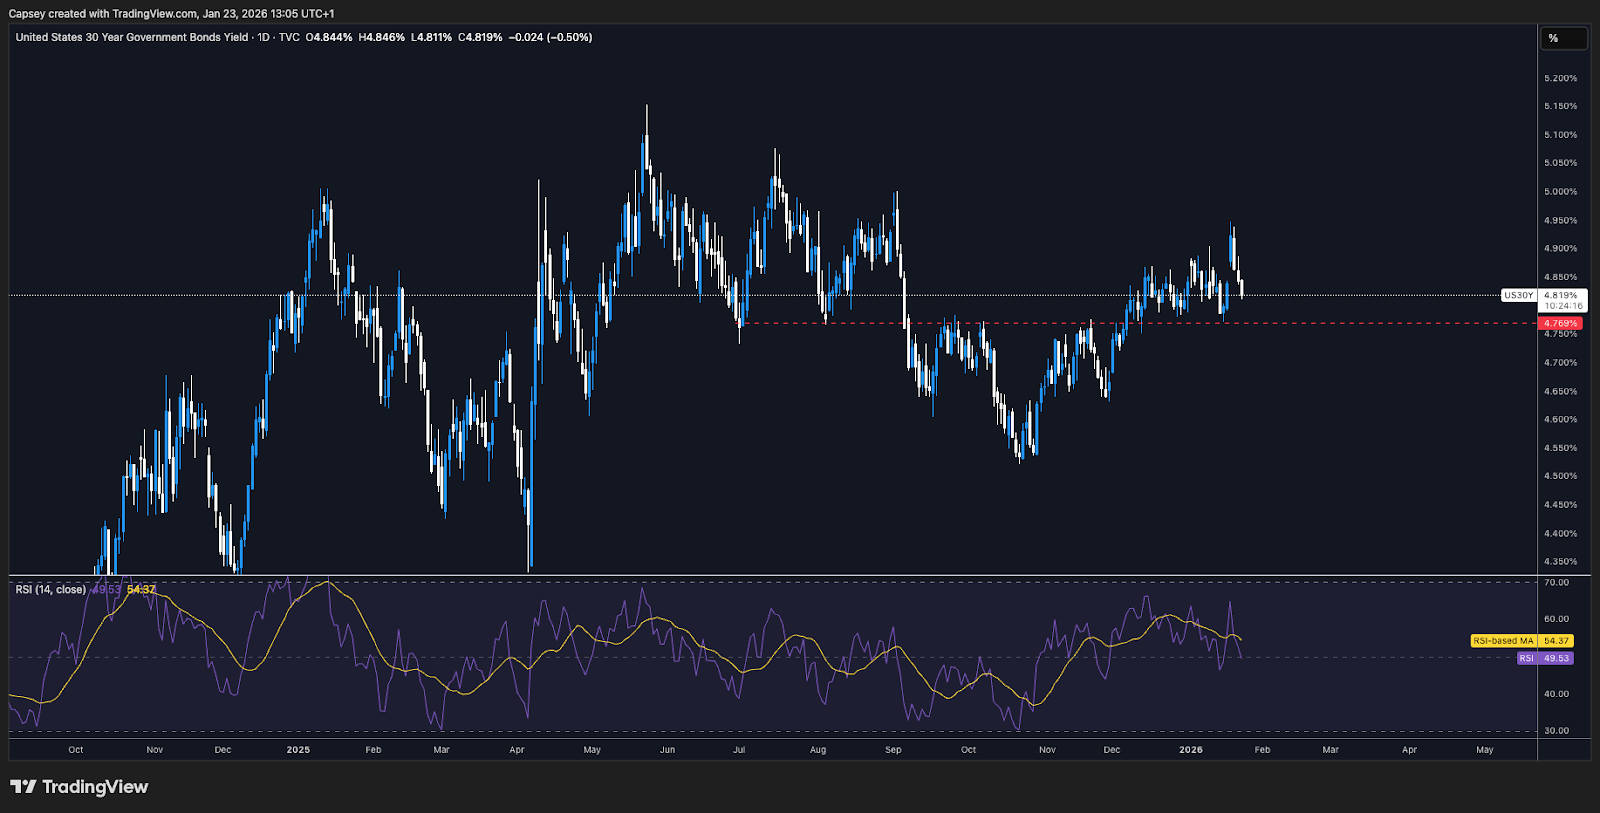
So we're not seeing investors move to safety and therefore a move into Bonds, but rather a move into Gold, which has essentially gone parabolic.
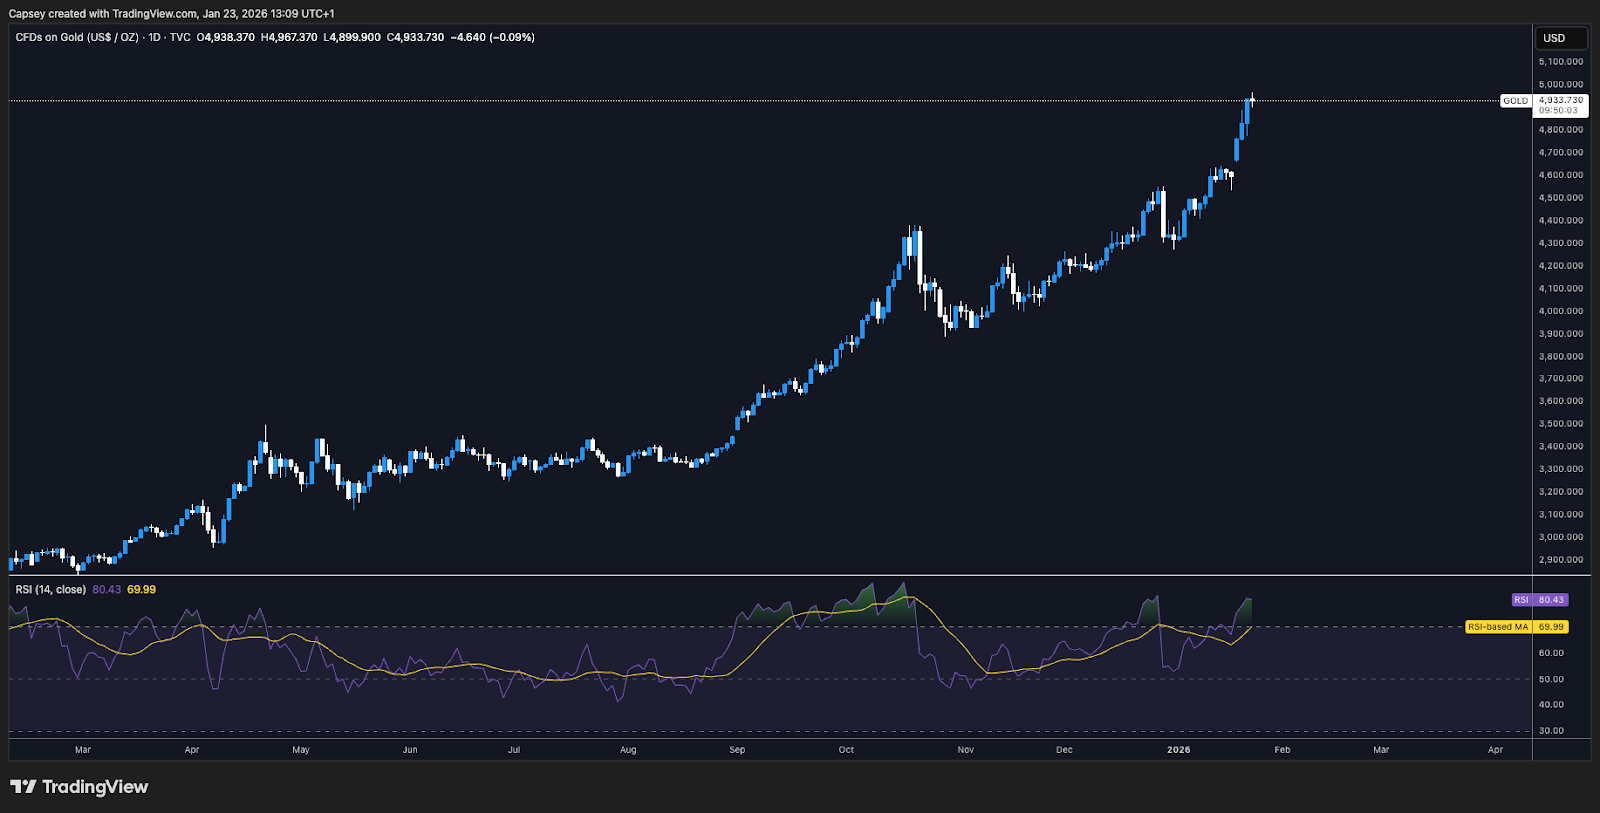
Gold 1D Chart:
Unfortunately, Bitcoin has traded like a risk asset, rather than a flight to safety (a safe haven asset) like how Gold is currently behaving as. So from the perspective that BTC might follow Gold, we're not hopeful of that playing out as BTC is still more correlated to Mag7 rather than Gold. So, we don't expect the tailwind for BTC to come from there.
Let’s now dive into BTC and assess its outlook.
Outlook for Bitcoin:
In the last few months, the key metrics we've covered for Bitcoin have been ETF flows, and Long-Term Holder selling, as Long-Term Holders have been driving the sell side and we have therefore looked to the ETFs to absorb the selling, which hasn't happened too often.In early-to-mid January, the ETF flows picked up and were meaningfully positive. However, this week that has flipped and we've now seen more significant outflows.
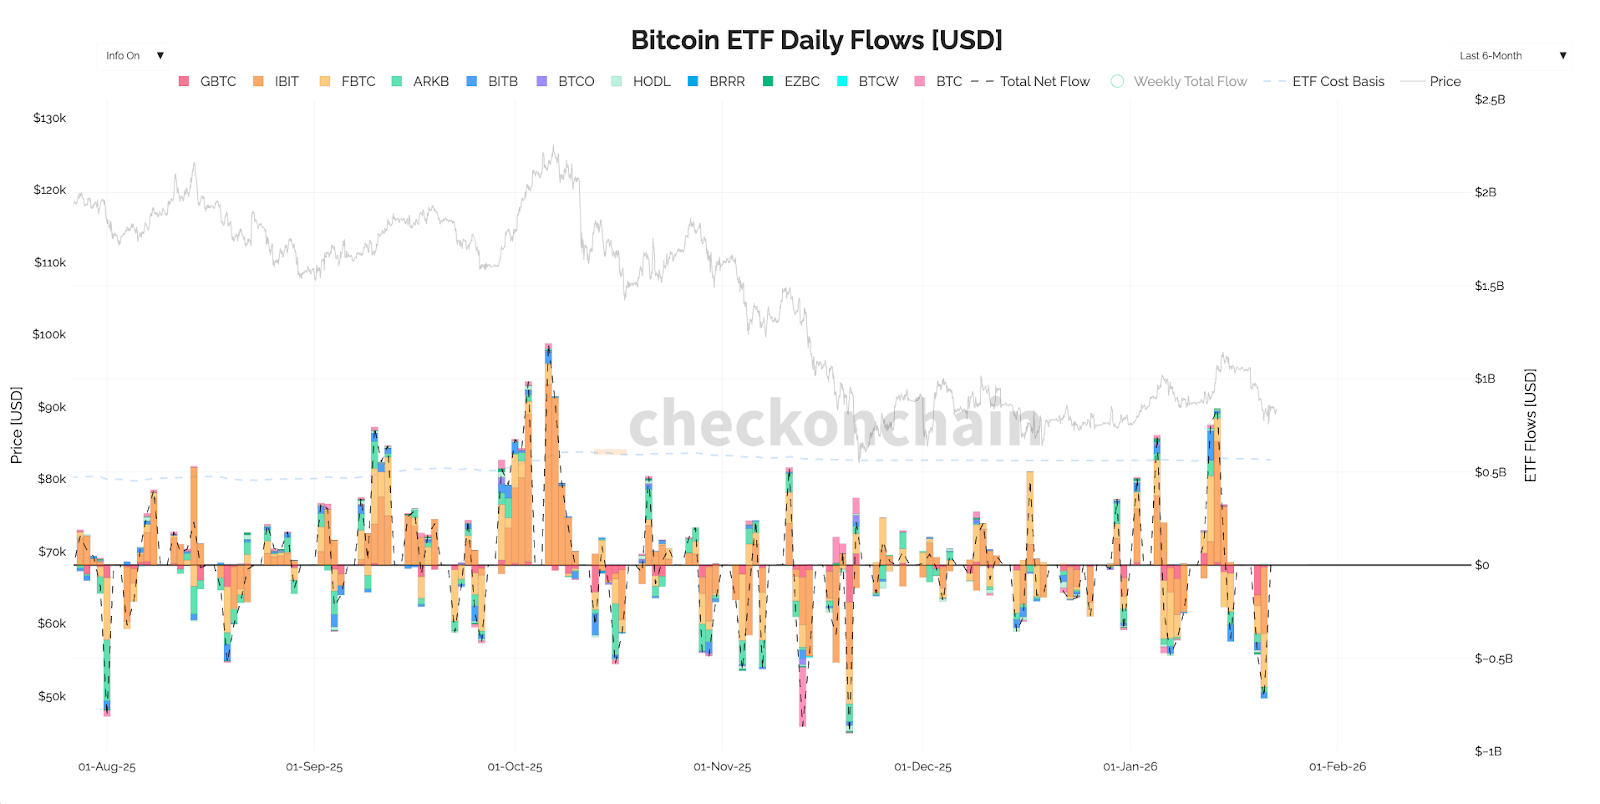
BTC ETF Flows:
Alongside, Long-Term Holders have increased their sell pressure again.
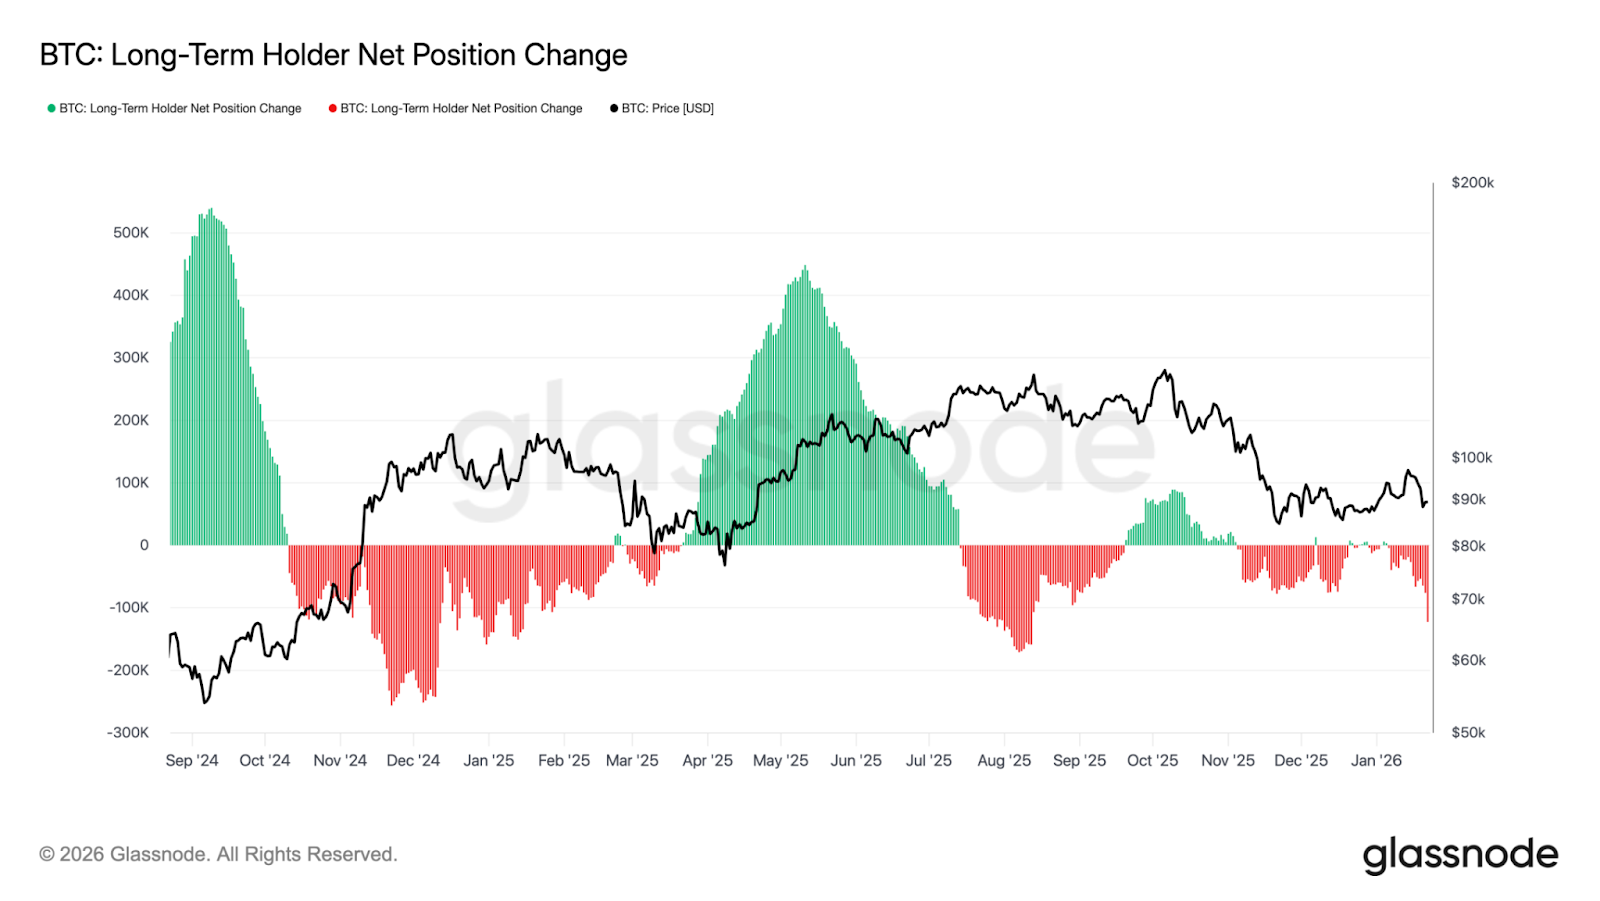
LTH Net Position Change:
In addition to the above, the Coinbase Premium has turned significantly negative again. This indicates that the price of BTC on Coinbase trades below the price of BTC on non-US exchanges, and therefore there is less of a bid from the US. A continued negative Coinbase Premium has historically resulted in BTC moving lower.
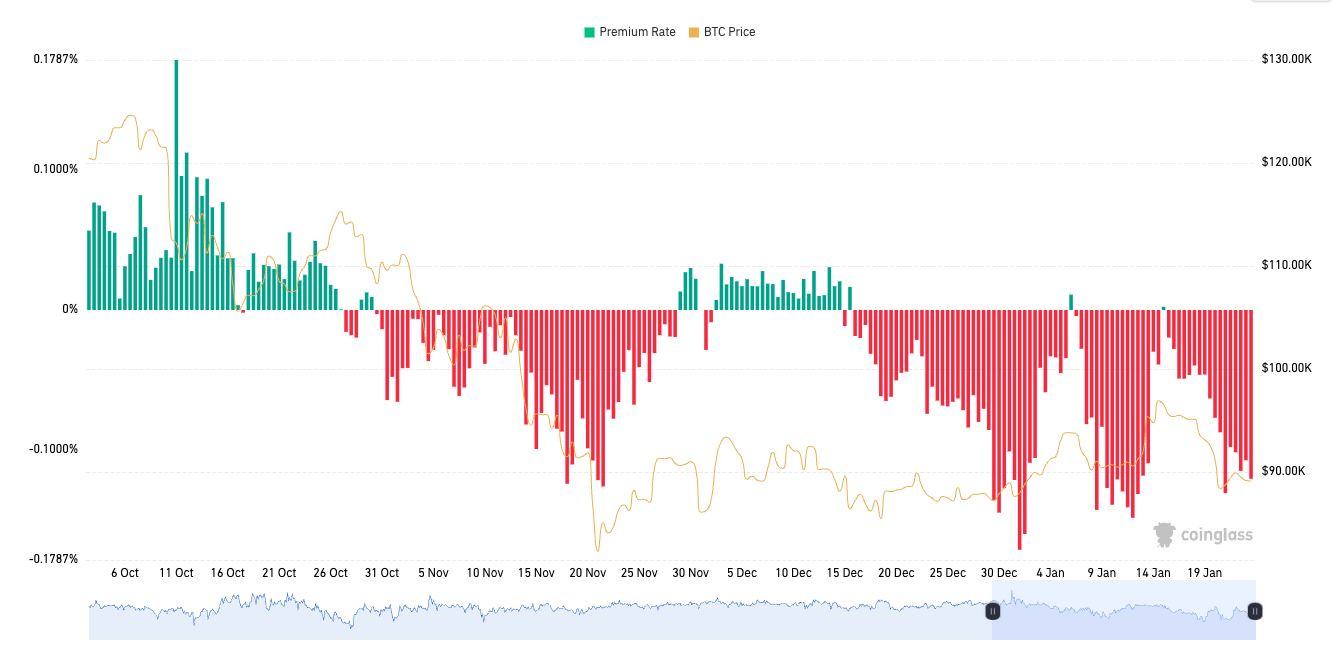
Negative Coinbase Premium:
To summarise the above metrics, we can see that the environment has shifted again. We have Long-Term Holders selling down their size again, and the ETFs aren't willing to absorb it.
If we then look at BTC from a technical perspective, we can see that price rejected from $98k which was the start of our stated resistance zone (between $98k-$105k). We determined this zone through using a plethora of on-chain data that showed that key cost basis levels lied between $98k and $105k. Therefore, this zone was always going to be a natural resistance for price, despite price technically breaking out above the $95k horizontal resistance on the chart.
But remember, this price action has all taken place in the wider bear flag formation. Price is now resting at the bottom border of the bear flag with the RSI having broken below its uptrend line.
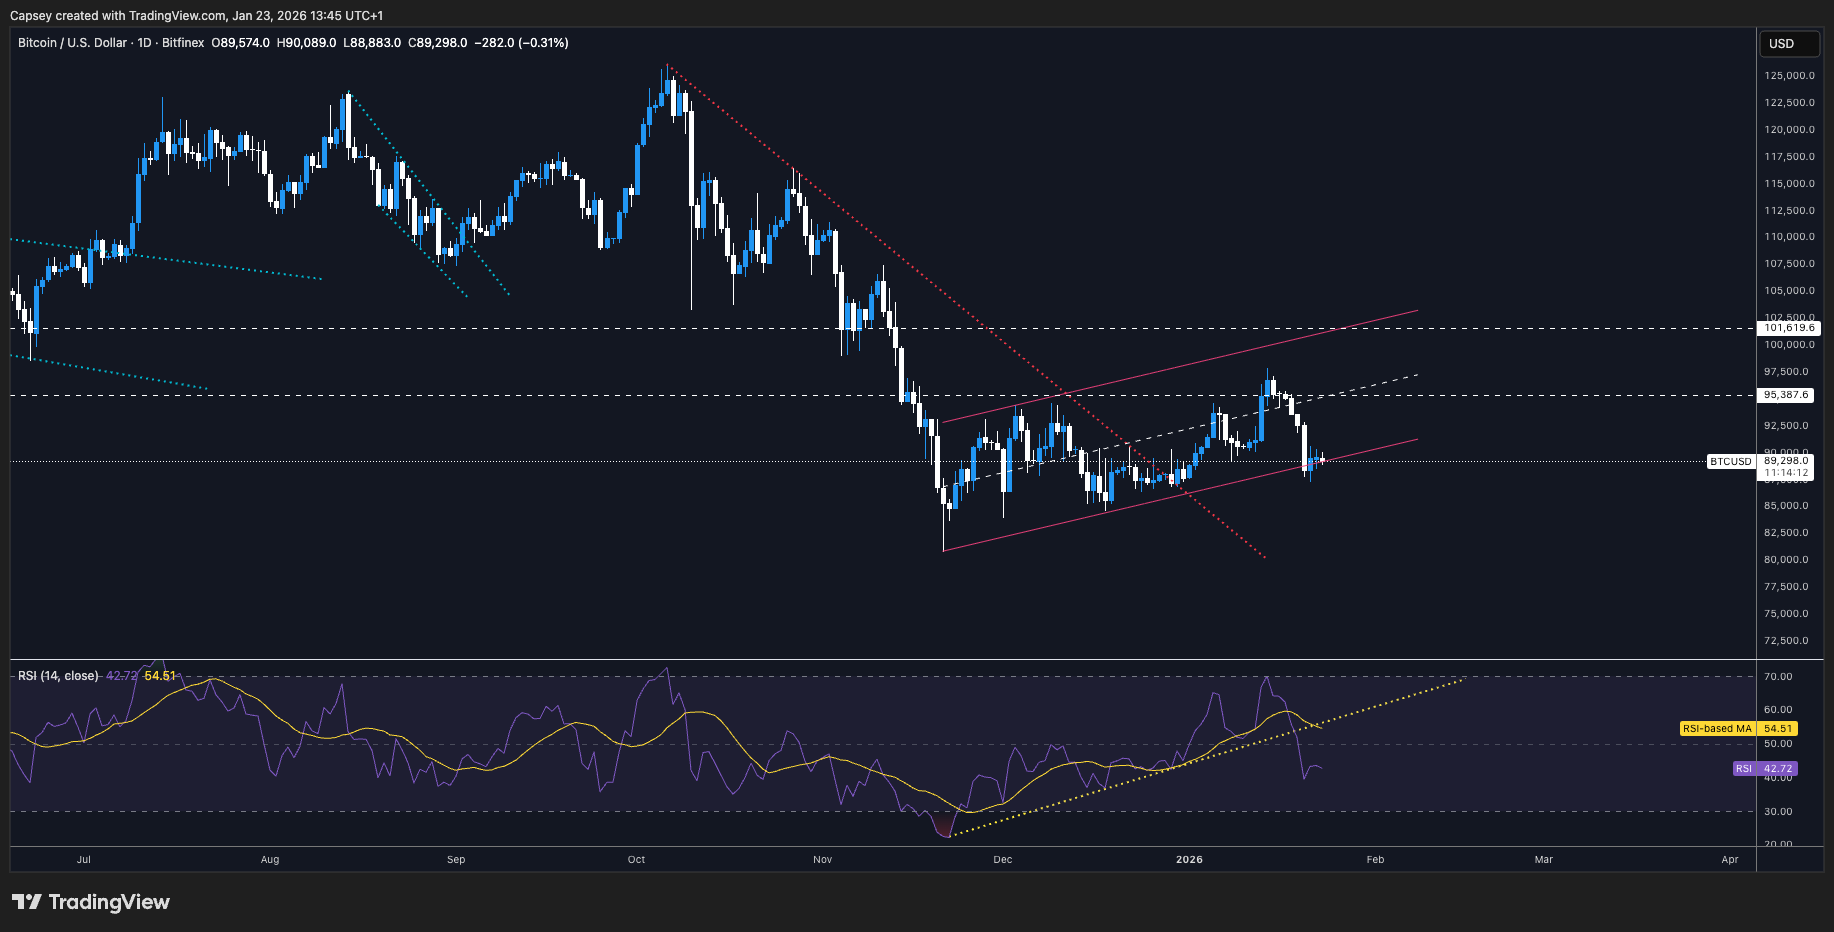
BTC 1D Chart:
In our view, BTC is likely to break down from its bear flag in the coming weeks and retest the low $80k's.
For traders: should price retest $93k-$94k, and the above metrics remain unsupportive, then we'd look to Short BTC at that level with a target of $82k-$84k. This trade would have a tight Stop of $95k.
But, should BTC break down from its bear flag (before $93k-$94k is given), then we'd become interested in a Long (re-buy Spot BTC) in the low $80k's. However, we'd want a bullish divergence to confirm on the Daily chart, and for the metrics we've highlighted above to show a meaningful improvement i.e., positive ETF flows, and little to no Long-Term Holder selling taking place.
Cryptonary's Take:
Recent economic data has seen the odds of interest rate cuts coming before Powell is replaced in May 2026 come down considerably. The market therefore will need to navigate around this lack of tailwind whilst at the same time, there's a plethora of headwinds for risk assets to contend with. That might be in the form of:- headline tariff news and the volatility that brings,
- geopolitical tensions,
- or rising Bond Yields (negative for risk assets).
If we then look under the hood of the Bitcoin market, we're seeing negative ETF flows, which is matched by Long-Term Holders continuing to sell down their supply. This negative backdrop is also matched with an unsupportive technical setup with Bitcoin in a bear flag structure, which has a breakdown target of $80k-$84k.
With everything said above, our stance is as follows:
- Our positioning is for a risk-off environment.
- Should we see a move up to $93k-$94k, we'd look to Short BTC, assuming the metrics continue to remain unsupportive.
- Should BTC break down from its bear flag, we'd look to be buyers again in the low $80k's, but we'd want to confirm this with a bullish divergence on the Daily timeframe and for the metrics to show a more supportive backdrop.
Continue reading by joining Cryptonary Pro
$1,548 $1,197/year
Get everything you need to actively manage your portfolio and stay ahead. Ideal for investors seeking regular guidance and access to tools that help make informed decisions.
For your security, all orders are processed on a secured server.
As a Cryptonary Pro subscriber, you also get:
3X Value Guarantee - If cumulative documented upside does not reach 300% during your 12-month membership, you can request a full refund. Terms
24/7 access to experts with 50+ years’ experience
All of our top token picks for 2025
On hand technical analysis on any token of your choice
Weekly livestreams & ask us anything with the team
Daily insights on Macro, Mechanics, and On-chain
Curated list of top upcoming airdrops (free money)
3X Value Guarantee
If cumulative documented upside does not reach 300% during your 12-month membership, you can request a full refund.
Our track record speaks for itself
With over 2.4M tokens and widespread misinformation in crypto, we cut through the noise and consistently find winning assets.
Our track record speaks for itself
With over 2.4M tokens and widespread misinformation in crypto, we cut
through the noise and consistently find winning assets.


Frequently Asked Questions
Can I trust Cryptonary's calls?
Yes. We've consistently identified winners across multiple cycles. Bitcoin under $1,000, Ethereum under $70, Solana under $10, WIF from $0.003 to $5, PopCat from $0.004 to $2, SPX blasting past $1.70, and our latest pick has already 200X'd since June 2025. Everything is timestamped and public record.
Do I need to be an experienced trader or investor to benefit?
No. When we founded Cryptonary in 2017 the market was new to everyone. We intentionally created content that was easy to understand and actionable. That foundational principle is the crux of Cryptonary. Taking complex ideas and opportunities and presenting them in a way a 10 year old could understand.
What makes Cryptonary different from free crypto content on YouTube or Twitter?
Signal vs noise. We filter out 99.9% of garbage projects, provide data backed analysis, and have a proven track record of finding winners. Not to mention since Cryptonary's inception in 2017 we have never taken investment, sponsorship or partnership. Compare this to pretty much everyone else, no track record, and a long list of partnerships that cloud judgements.
Why is there no trial or refund policy?
We share highly sensitive, time-critical research. Once it's out, it can't be "returned." That's why membership is annual only. Crypto success takes time and commitment. If someone is not willing to invest 12 months into their future, there is no place for them at Cryptonary.
Do I get direct access to the Cryptonary team?
Yes. You will have 24/7 to the team that bought you BTC at $1,000, ETH at $70, and SOL at $10. Through our community chats, live Q&As, and member only channels, you can ask questions and interact directly with the team. Our team has over 50 years of combined experience which you can tap into every single day.
How often is content updated?
Daily. We provide real-time updates, weekly reports, emergency alerts, and live Q&As when the markets move fast. In crypto, the market moves fast, in Cryptonary, we move faster.
How does the 3X Value Guarantee work?
We stand behind the value of our research. If the documented upside from our published research during your 12-month membership does not exceed three times (3X) the annual subscription cost, you can request a full refund. Historical context: In every completed market cycle since 2017, cumulative documented upside has exceeded 10X this threshold.
TermsRecommended from Cryptonary

