Save 23% ($351) & Get a Free 1-1 Call with our Team ⏰ : 0d 2h 59m 44s

Disclaimer: This is not financial or investment advice. You are responsible for any capital-related decisions you make, and only you are accountable for the results.
TLDR:
- Markets remain choppy as traders await key U.S. labour market data, with rate cuts expected at the September Fed meeting.
- Trump’s pressure on the Fed raises concerns about central bank independence, contributing to higher long-term yields and market volatility.
- Major crypto assets (BTC, ETH, SOL) are performing strongly while broader altcoins lag.
- Bitcoin’s key buy zones are $108K–$112K (light buying) and $99K–$105K (aggressive buying if reached).
- Cryptonary maintains a bullish outlook: BTC expected to hit $140K–$150K by Q1 2026.
Topics covered:
- This Weeks Data.
- Why Are Markets Choppy/Dipping?
- Key Levels for BTC, Where to Bid?
- Cryptonary's Take.
This Weeks Data:
This week, the market is focused on the labour market data, which is coming off the back of a downside surprise and meaningful downside revisions to prior months numbers. This is what has seemingly brought the FED back to the Interest Rate cutting table - which the market expects for the September Meeting, a cut.The first data we have is on Wednesday, which is JOLTs Job Openings. We don't expect this to be market moving, but it can be should we see a meaningful upside or downside surprise, although we see there being a slim chance of this happening. The forecast is for 7.3m Job Openings. Should it come in north of 8m, then the market might react slightly negatively in anticipation of potential strong jobs print on Friday. Should we see a downside surprise then risk assets can move up on this in that it increases the odds of a September rate cut.
But the main data is this Friday, Non Farm Payrolls and the Unemployment Rate. The forecast is for Non Farm Payrolls to come in at 70k-78k, with the Unemployment Rate potentially ticking up to 4.3%. The slight uptick in unemployment wouldn't concern the FED to any major degree, but the slowing Payrolls numbers, particularly after recent downside revisions, is what would further concern the FED, and hence bring them to cut rates.
Should the numbers come in as forecasted (which is what we expect), then markets will take them in their stride, and we'll likely see a continuation of the choppiness ahead of the mid-September Meeting.
Why Are Markets Choppy/Dipping?
We covered this in our prior Market Update (26/10/08) - check out the 'Seasonality' section. But alongside Seasonality, there's potentially a few more reasons as to why markets seem less buoyant despite the market pricing for a FED that is set to begin cutting rates again, which has historically been great for risk assets and Crypto.A few of those key reasons are:
- TradFi: threat to FED independence from Trump, leading to a steeper Yield curve.
- Crypto: DAT narrative/Treasury company demand.
One of the common themes over the last few months has been the Trump administrations' pressure on Powell and the FED. We've seen this in a plethora of examples.
- Trumps' constant callouts to lower rates.
- Trumps' barrage of Powell himself and the name calling.
- Trumps' visit to the FED to scrutinise the renovations and their cost.
- Firing Lisa Cook (voting FED member) due to issues around her mortgages.
However, what Trump is getting wrong, is that a FED that's losing independence (which his pressure is causing) is what de-stabilises markets, and it also goes against one of his key goals; bring rates down, which will result in getting "main street" (rather than Wall Street) and housing going again. However, Trump putting this level of pressure on the FED likely works against his goals. Let’s explain.
For instance, in the backend of 2024, the FED cut Interest Rates by 100bps, but the long-end Bond Yield increased (on fiscal fears, rather than FED independence fears) - not what's supposed to happen, and that certainly didn't help the housing sector.
Since then, long-end Bond Yields have generally moved higher, and as a result housing has struggled. We can see in the below that the Yield curve has steepened on a 1-month, and 1-year time horizon, in comparison to now.
Steepening US Yield Curve:
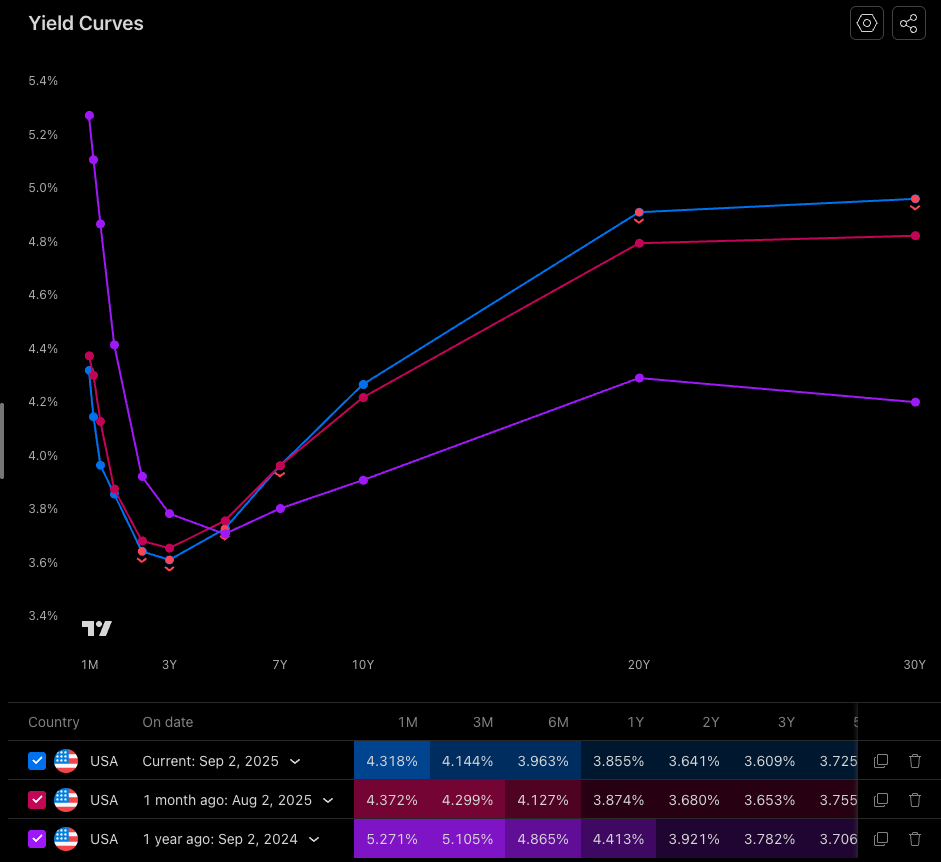
In 2024, there was arguably more supportive reasoning for FED cuts than there is today. That's due to the rate being more restrictive whilst the labour market was in a similar position, and inflationary measures were trending lower. That's not the case today. Today we have a steeper Yield curve, a less restrictive FED Funds Rate (Interest Rate), and inflation moving higher, although it's arguably a one-time price hike. Now put this alongside a market that's more greatly questioning FED independence and there's no reason as to why Interest Rate cuts won't have the same effect on the long-end of the curve again in 2025, like it had in 2024 i.e., higher long-end Bond Yields.
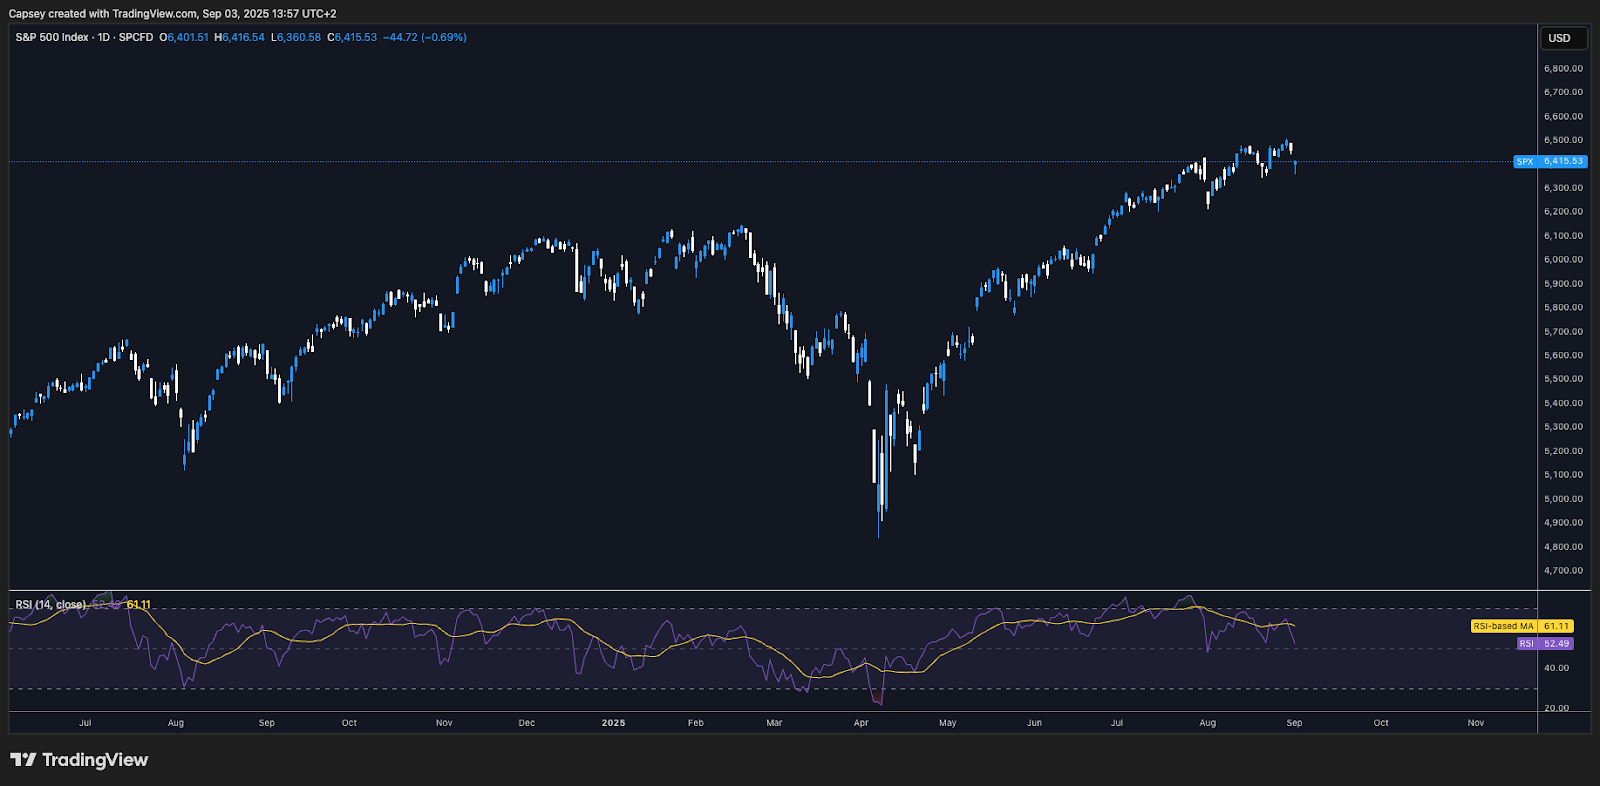
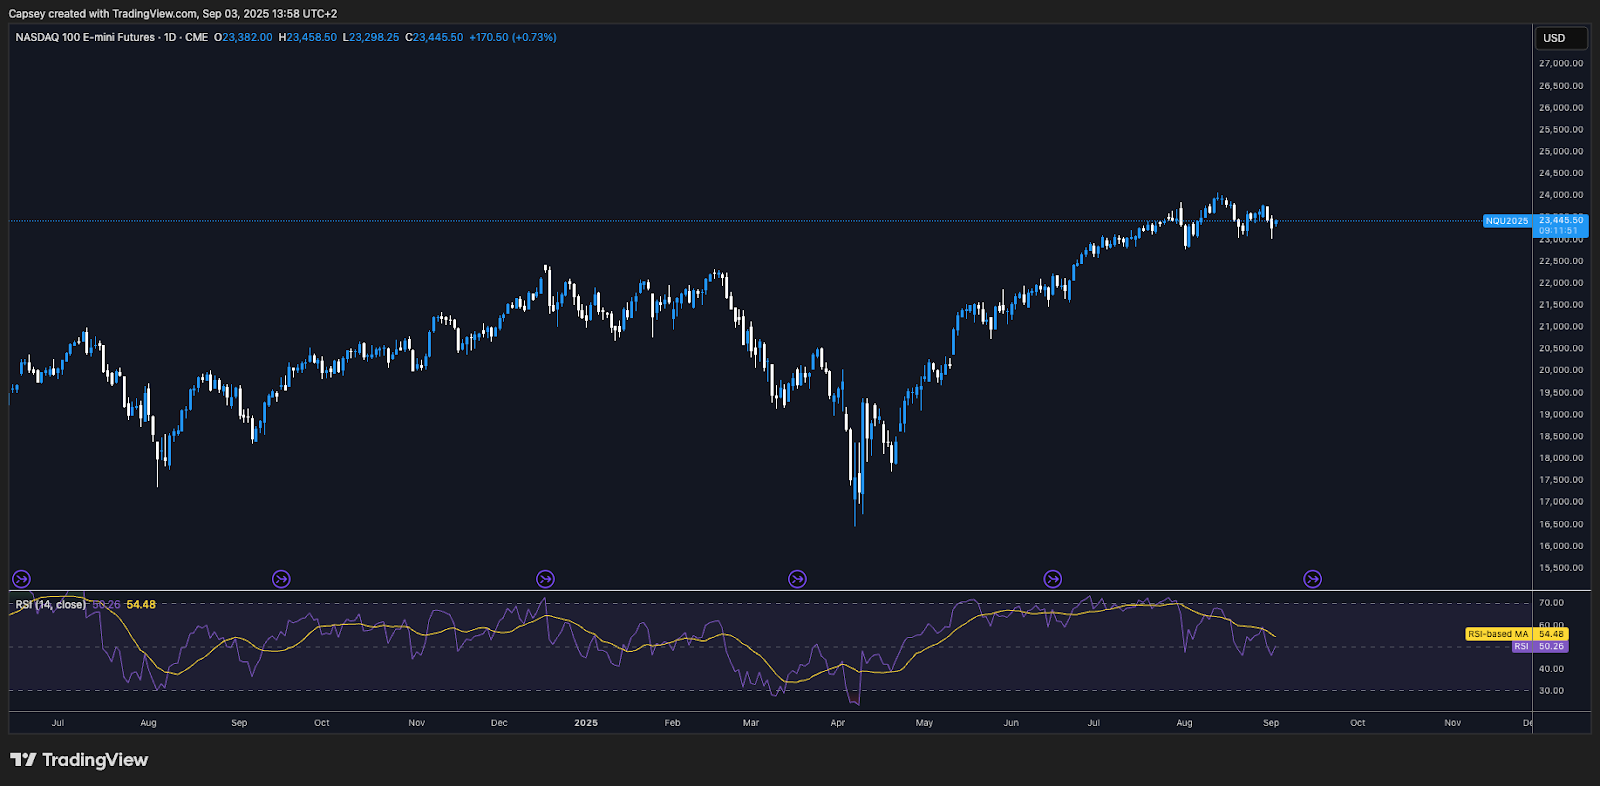
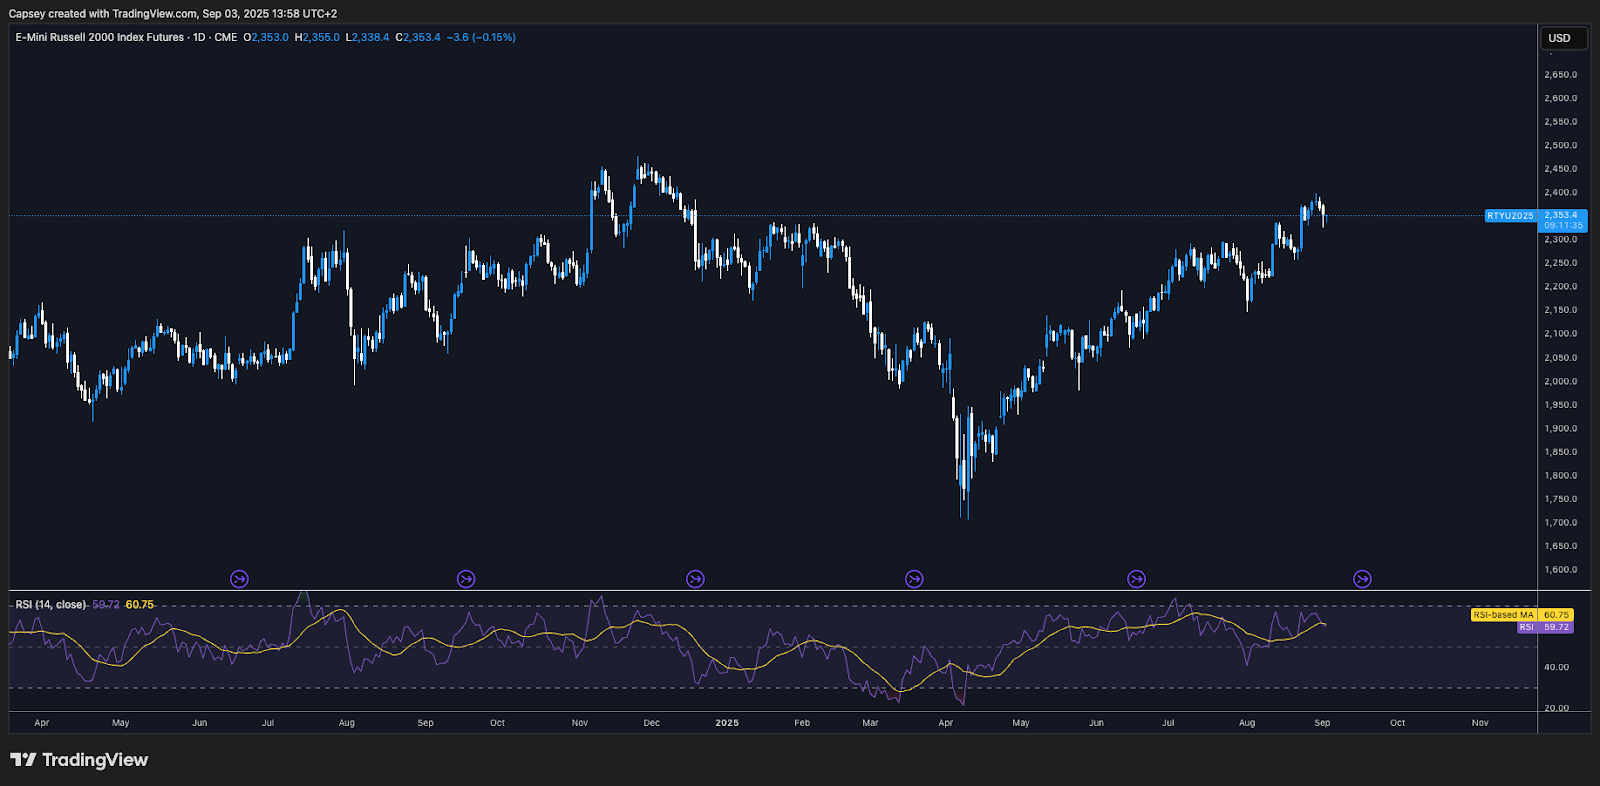
The result of this is that the Indexes have performed well, but Small Caps (the Russell 2000) have underperformed. The S&P and the Nasdaq have both made new highs in 2025, whereas the Russell hasn't.
S&P500 1D Chart:
Nasdaq 1D Chart:
Russell 2000 1D Chart:
We've seen the setup in Crypto be similar to that in TradFi, with the Majors breaking out to new highs in 2025, whilst a lot of the rest of the space has struggled for performance.
DAT Narrative/Treasury Company Demand:
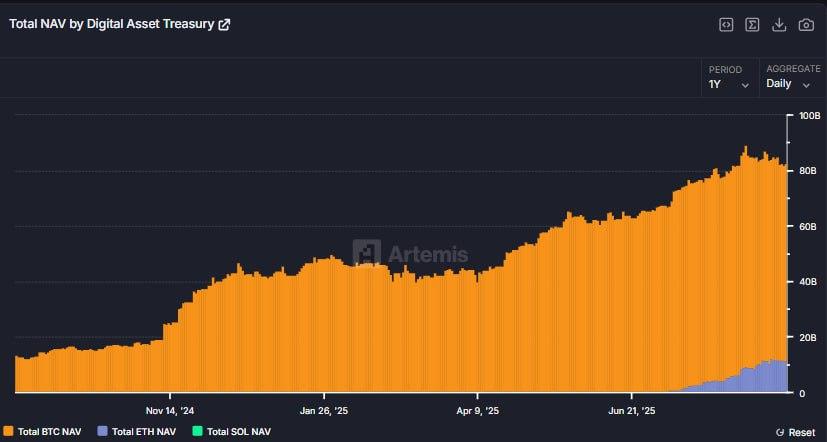
The recent narrative in the market has been the formation of DATs (Digital Asset Treasuries) for other Majors (ETH and SOL), following Saylor and MicroStrategy's success.One example is Tom Lee's BitMine (BMNR) which has accumulated an $8b ETH treasury, with the firm planning to raise $20b more to buy up more ETH. BitMine are attempting to run the MicroStrategy playbook but for ETH.
Over the last 12 months, these Treasury companies have seen tremendous inflows as we can see in the chart below.
Total NAV by Digital Asset Treasury:
Key Levels for BTC, Where to Bid?
Having outlined the reasons above as to why we might be in a choppier period and why this may last a few more weeks (seasonality), should BTC pull back, where are the key levels and at what price levels would we look to bid aggressively? In the below, we'll cover on-chain and technicals.
Key On-Chain Levels:
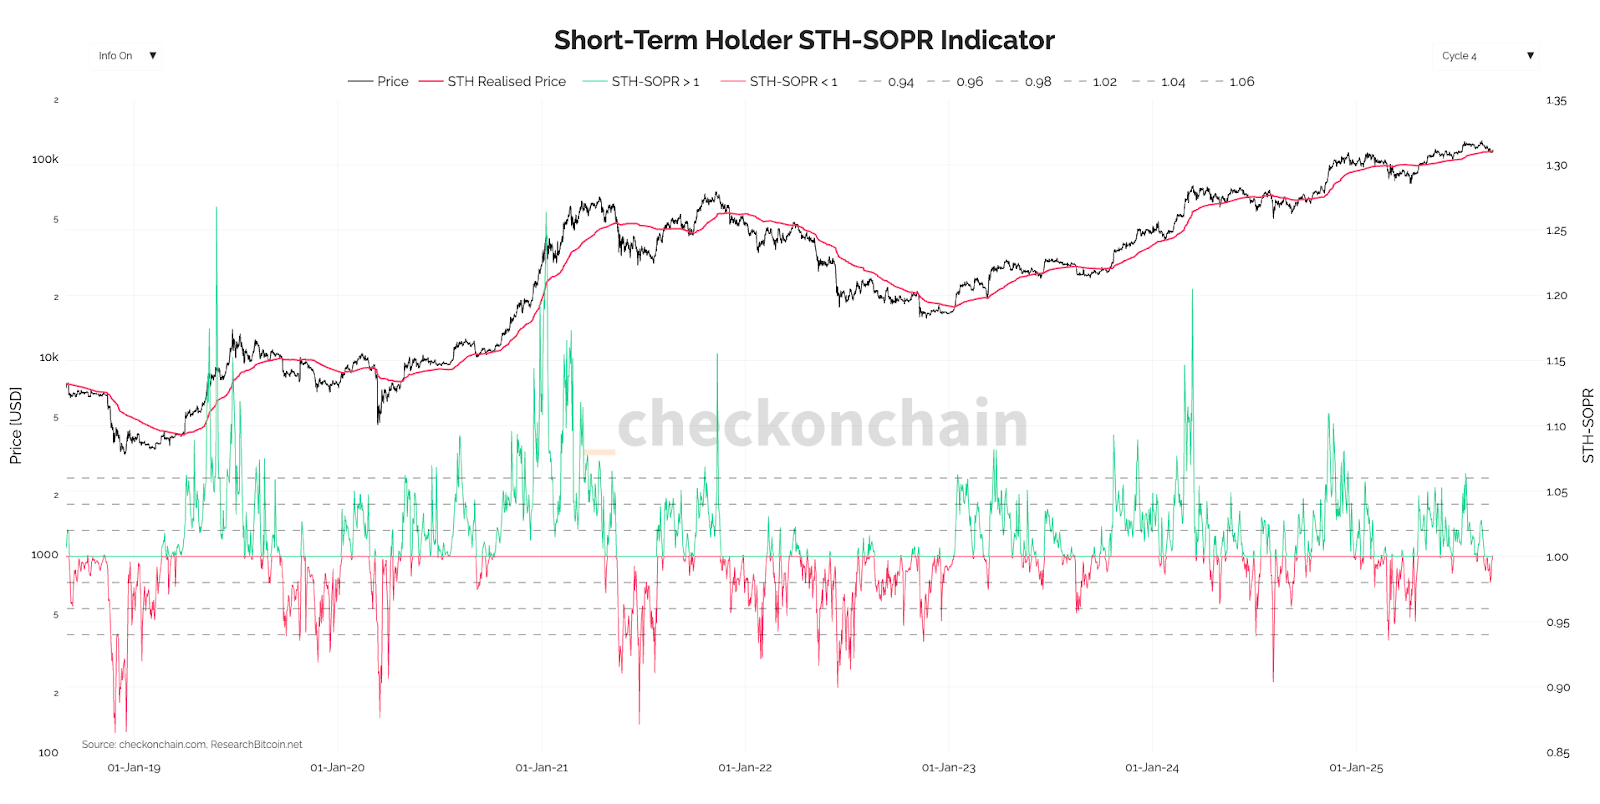
In assessing bull market pull backs (and we believe this is what we're seeing now due to our macro thesis of moving into a new rate cutting cycle), one of the more important metrics to look at is the SOPR (Spent Output Profit Ratio). This metric tracks the profit level of all moved coins. Historically, BTC has used the Short-Term Holder Cost Basis and the Short-Term Holder SOPR -0.5 and -1.0 standard deviations as key supports.We know that the Short-Term Holder Cost Basis is at $109,100 currently (it's recently moved up), and in recent days, we've seen price dip below the Short-Term Holder Cost Basis, putting STH's in an unrealised loss. However, the current unrealised loss is somewhat minimal with value territory being at the -0.5-standard deviation, and the -1.0-standard deviation.
Short-Term Holder SOPR:
The indicator has only just dipped into the red. An extension of the red line down to 0.95 would likely be enough of an unrealised loss that could then mark a local bottom.
Short-Term Holder MVRV Z-Score:
A price dip into $105k would likely be the trigger point that would see this metric hit the -0.5-standard deviation (blue dashed line).

Should BTC pull back to $105k, that would likely extend the above metrics into the value zone. Beneath $105k, the MVRV Pricing Bands has the MVRV Mean at $99k, with the MVRV Mean -0.5 standard deviation at $75k, and the True Market Mean at $77.5k.
MVRV Pricing Bands:
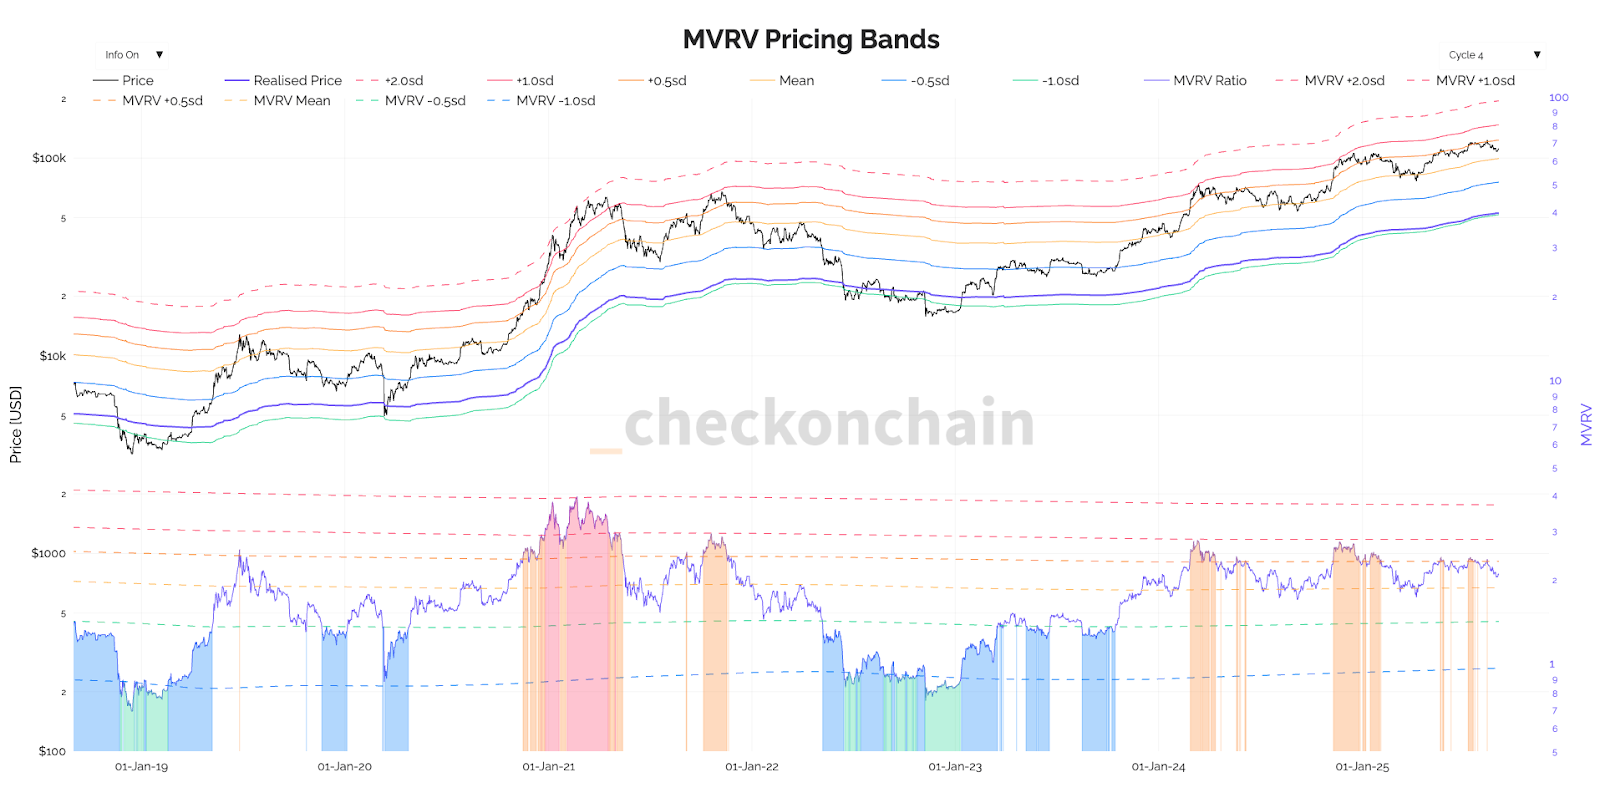
If we believed we were in a bear market (which we don't), then we'd be targeting the lower bounds closer to the True Market Mean, so between $75,000 and $77,500. However, it's our view that this is a bull market pull back, so the value territory would then be the higher range, where we see an extension to the downside in the metrics that hits the value zones; this would be between $99,000 and $105,000. Should the price pull back to that region, we'd be aggressive buyers of BTC.
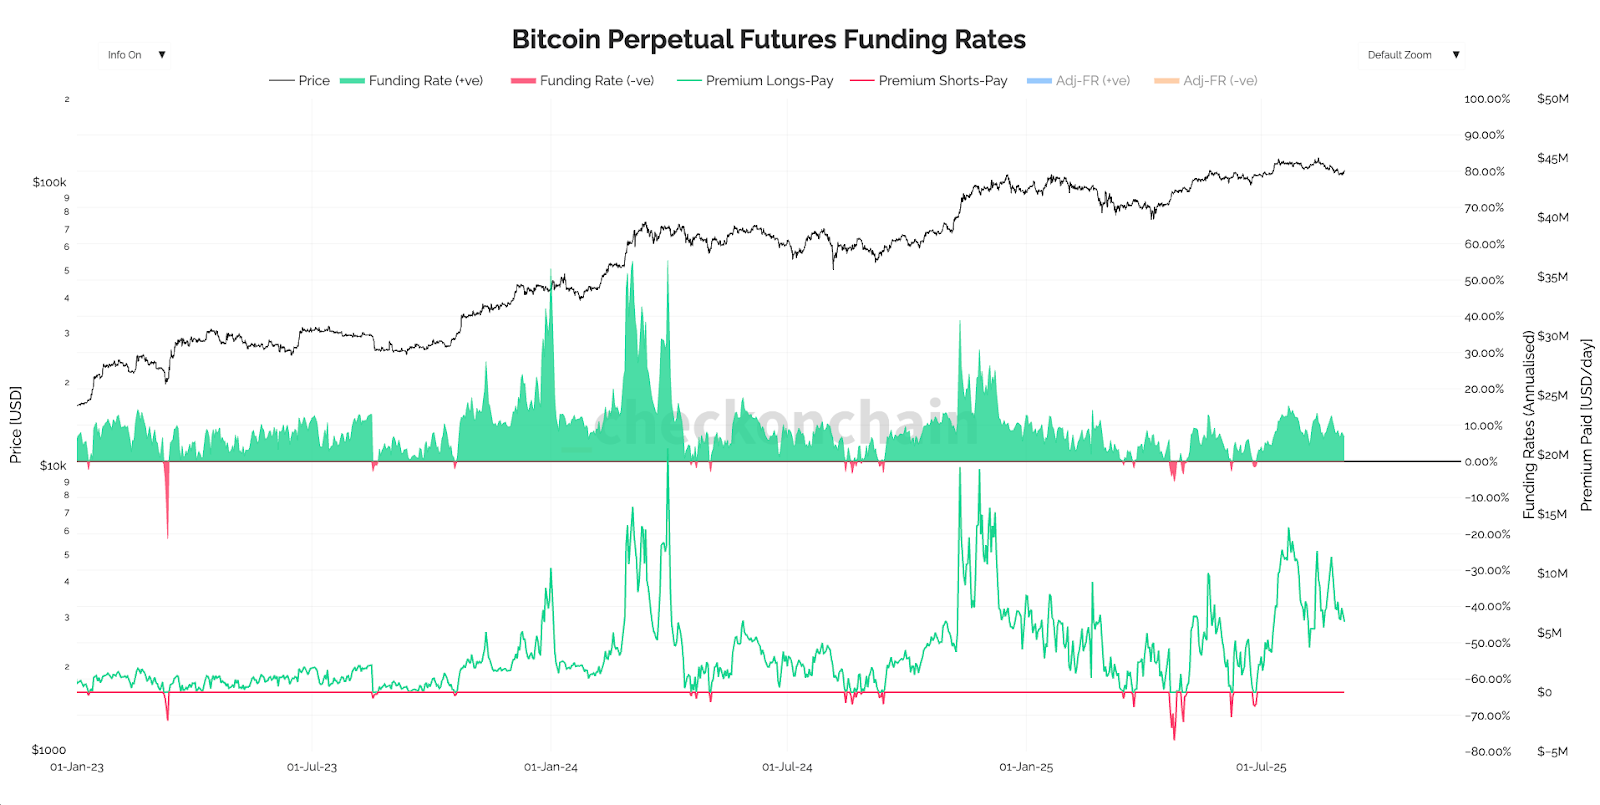
Should we see $99k-$105k be hit, we expect it would be quick. For now, we don't see a macro reason that could take us to that zone, but leverage is still relatively high even though it's pulled back in the last week. Now it's not uncommon for Funding Rates to remain elevated during a bull market, but you do get leverage flush outs during bulls. So, it's possible we get some form of leverage flush out, that resets Funding Rates, and pulls price into the $99k-$105k region. That would see the below chart reset closer to the red 0 line.
Bitcoin Perps Funding Rates:
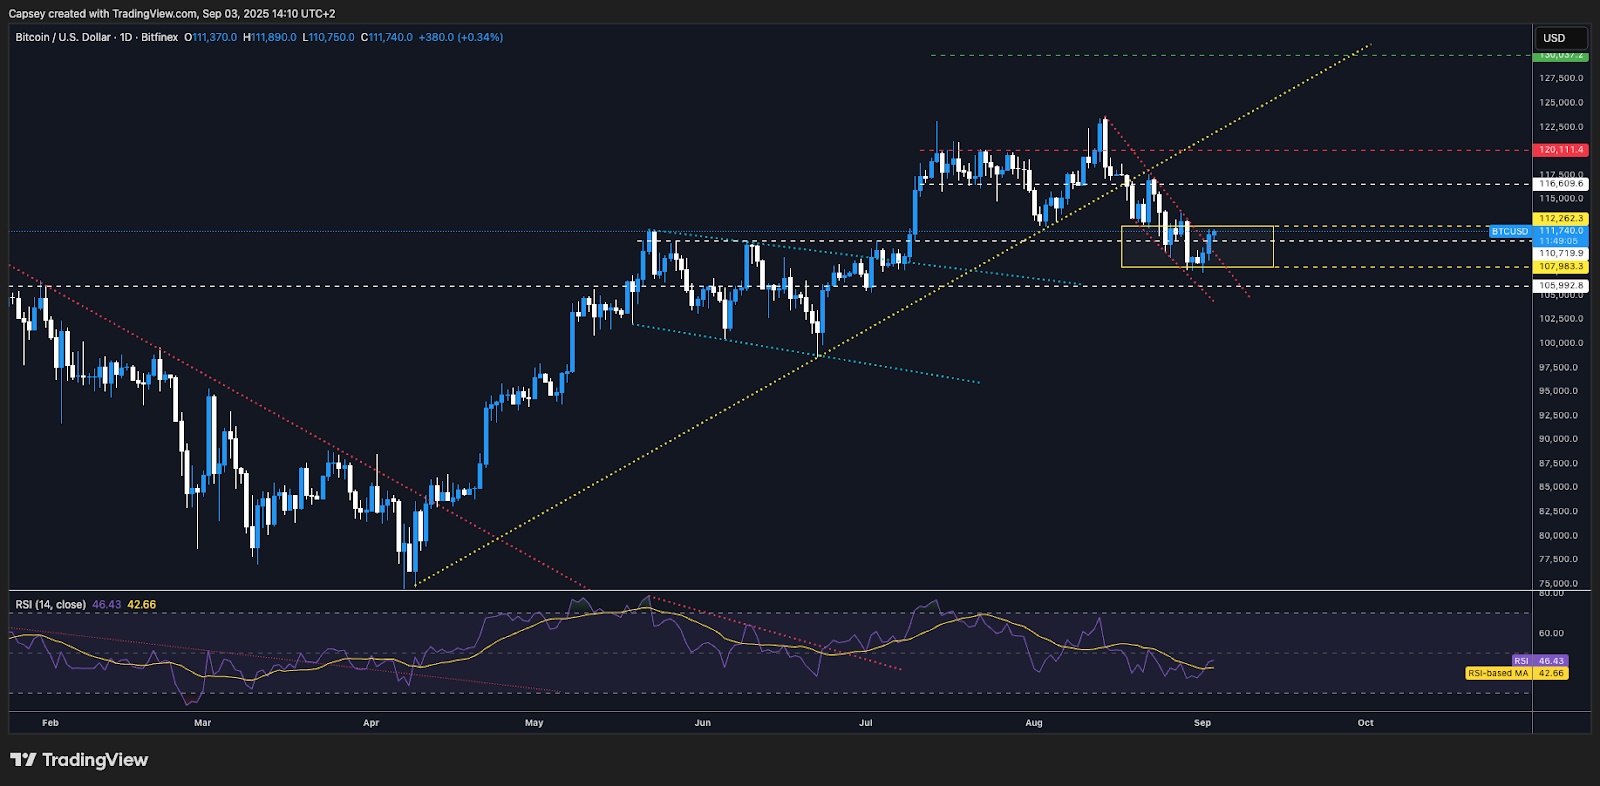
Now, it's not our base case that BTC pulls back to $99k-$105k, and we had our technical value territory on the chart between $108k-$112k, where we have been buyers of BTC. But should the price dip into the $99k-$105k range, we'd be aggressive buyers of BTC there, with a view to holding BTC into Q1 2026, where we'd expect the price to be north of $150k. Our base case is for $140k-$150k by Q1 2025.
BTC:
Cryptonary's Take:
We've had a difficult market recently that has gone against some participants' expectations. We've moved closer towards beginning a new rate cutting cycle, but that hasn't resulted in much of a broadening out in the market currently. We're continuing to see the Majors perform well yet the rest of the space is lagging in comparison.BTC is down 10% from its highs, ETH and HYPE recently hit all-time highs, and SOL is now north of $200 and looking the more positive play out of the Majors right now. So don't fool yourself, the Majors have performed.
Our expectation is that should Powell forward guide a new rate cutting cycle at the 17th September FED Meeting - we expect he will, although it'll be a gradual cutting cycle - this is what can help the broadening out trade perform, which should mean that Alts/Memes begin to outperform again.
Whilst we remain in this seemingly choppy period, our game plan is to be buyers on meaningful pull backs. For BTC, we were light buyers between $108k-$112k (we continue to hold these buys), but should the price pull back further, we'd be more aggressive buyers between $99k-$105k, as on-chain levels suggest that this is strong value territory for Bitcoin.
It's not our base case that BTC revisits $99k-$105k, but we'd have to be aggressive buyers there should we be given it as it is our base case that BTC is between $140k-$150k by Q1 2026.
Peace!
Cryptonary, OUT!
Recommended from Cryptonary


