Save 23% ($351) & Get a Free 1-1 Call with our Team ⏰ : 0d 2h 59m 43s

Disclaimer: This is not financial or investment advice. You are responsible for any capital-related decisions you make, and only you are accountable for the results.
TLDR:
- Macro: Inflation data cooled tariff fears; market prices a 96% chance of a September Rate cut, with 2-3 cuts likely for 2026.
- Markets: SPX and NDX at highs; BTC consolidating at $120k, ETH up to $4,700.
- Crypto: BTC dominance falling; ETH/BTC rising; TOTAL3 breakout above $1.13T could spark alt season.
- ETH: Institutional buying ($20B BitMine) driving gains; Majors and select memes favoured.
- Cryptonary’s Take: Hold Majors and select memes; trim some profits from recent winners (ETH) into strong consolidators (HYPE).
Topics covered:
- Tuesday's Inflation Print and What It Means for Rate Cuts.
- FED To Tilt Dovish?
- Crypto Indexes.
- Cryptonary’s Take.
Tuesday's Inflation Print and What It Means for Rate Cuts:
The market eagerly awaited yesterday's inflation data with risk assets pulling back (more de-risking) going into the event, with BTC opening on Monday strong, but price selling off and fully reversing on the day.The inflation data came out with Core Inflation increasing slightly more than forecasted, but with Headline Inflation coming in as forecasted, and at the same level as the prior month. The positives for the market were, firstly, that there wasn't a meaningful upside surprise, which might have been possible considering how uncertain the pass-through effects of tariffs have been.
The second positive was that Goods prices came in softer than expected (particularly the tariff-related components). The actual uplift in inflation was driven from Services, which might be likely due to a rebound in the economy following some further clarity on tariffs in the months that have followed 'Liberation Day' in early April. Ultimately, this put the markets' inflation fears (due to tariffs) at ease for the time being, and not seeing substantial tariff pass-through effects into inflation allows the FED to cut at their mid-September Meeting should they opt to.
The market is now pricing for a 96.4% likelihood that the FED cuts in September. This is up from 57.4% just one month ago.
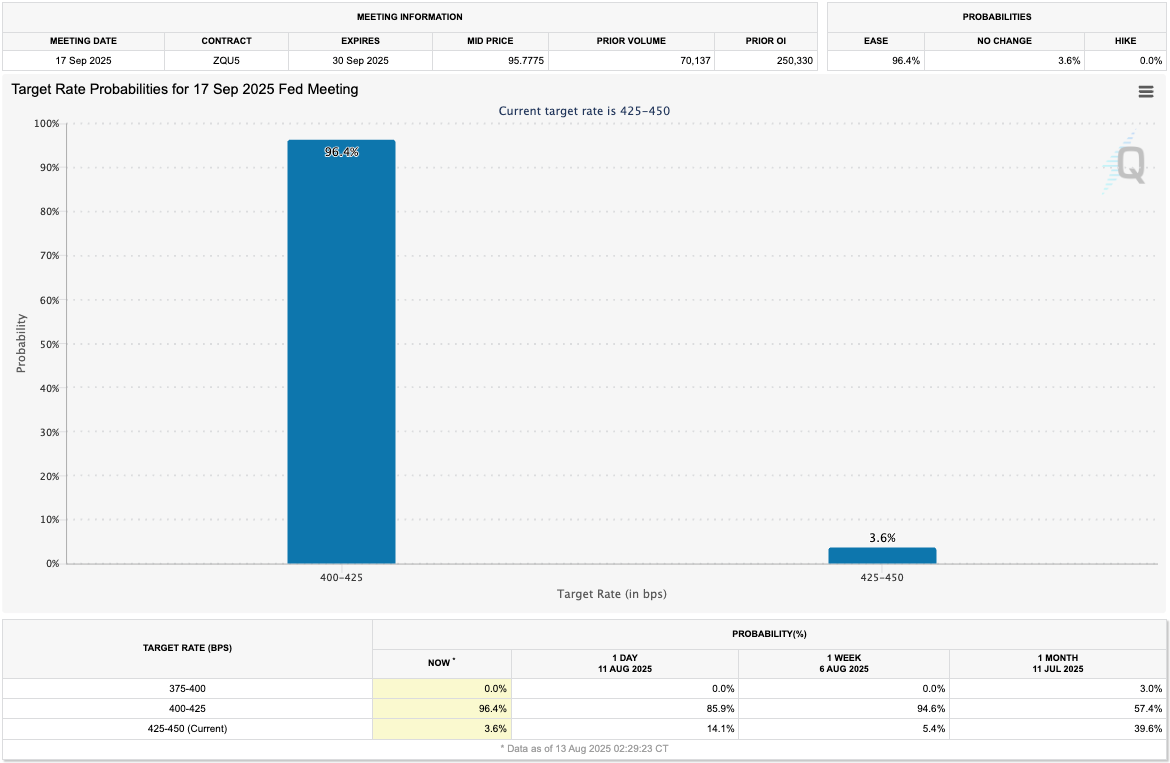
Chart Title: Target Rate Probabilities for 17 Sept FED Meeting
The market reaction to this inflation print was risk assets up (the SPX and NDX reaching new all-time highs), and the US2Y Bond Yield coming down by 6bps. This once again signals that the FED are now highly likely to cut rates at their September Meeting.BTC and ETH both pushed higher, with BTC moving back towards the top of its range at $120k, and ETH breaking out of $4,200 and reaching new highs of $4,600.
FED To Tilt Dovish?
Over the last week, we've had further developments in relation to the FED and what might now become a more dovish tilt. We take this from the nomination of Miran and recent dovish comments from Neel Kashkari.At July's Meeting, there were two dissents (from Waller and Bowman), but it's now likely the FED cuts in September, with all members voting to cut, or at least the strong majority voting to cut. But a September cut is now mostly baked in, what the markets will start looking to now is further out. Do we get cuts at all the remaining Meetings in 2025, and what does the path for rates look like in 2026?
Last week, the Trump administration nominated Stephan Miran to the vacant FED position that Governor Kugler resigned from the week prior, although this is supposed to just be temporary until the Kugler term was set to end in January 2026. The expectation is that Miran will provide a dovish lean that could support more cuts in 2025 and early 2026.
Secondly, Minneapolis FED President Neel Kashkari did an interview last week where he suggested that he could see 2 interest rate cuts happening this year. Kashkari also emphasised that it may take many more months and even quarters for the inflationary effects of tariffs to show up in the data. And therefore, he suggested that it would be more appropriate to respond to the data he's seeing now (weakness in the labour market) and to prioritise that rather than remaining on hold (and for an unknown period), for tariff pass-through effects that aren't guaranteed to be all that bad. Again, this suggests a lean towards cutting interest rates and responding to the data now, rather than continuing to wait for an inflation scare that might not come.
Summarising the Macro:
Over the last 10 days, we've seen the market move towards fully pricing the September FED Meeting for an interest rate cut following a weaker-than-expected labour market report, with substantial revisions to the downside. Alongside this, we've seen several FED members suggest that they should increasingly prioritise the data of today (the weakening data) rather than the data that may come down the line. This likely sets up at least 2, but possibly 3 interest rate cuts in 2025, which is why risk assets are breaking out to the upside.From a macro viewpoint, we expect to have a constructive backdrop for risk assets looking out over the next few months, and likely longer as we enter a new rate cutting cycle.
Crypto Indexes:
We'll now investigate the Crypto Indexes for signs as to whether this rally is sustainable and how much more it might have left in it.Firstly, looking at Bitcoin Dominance on the 3D timeframe, we can see that it has substantially broken down, smashing through the 60% level and now looking like it's heading to 57% imminently. An invalidation of this would be a reclaim above 62%.
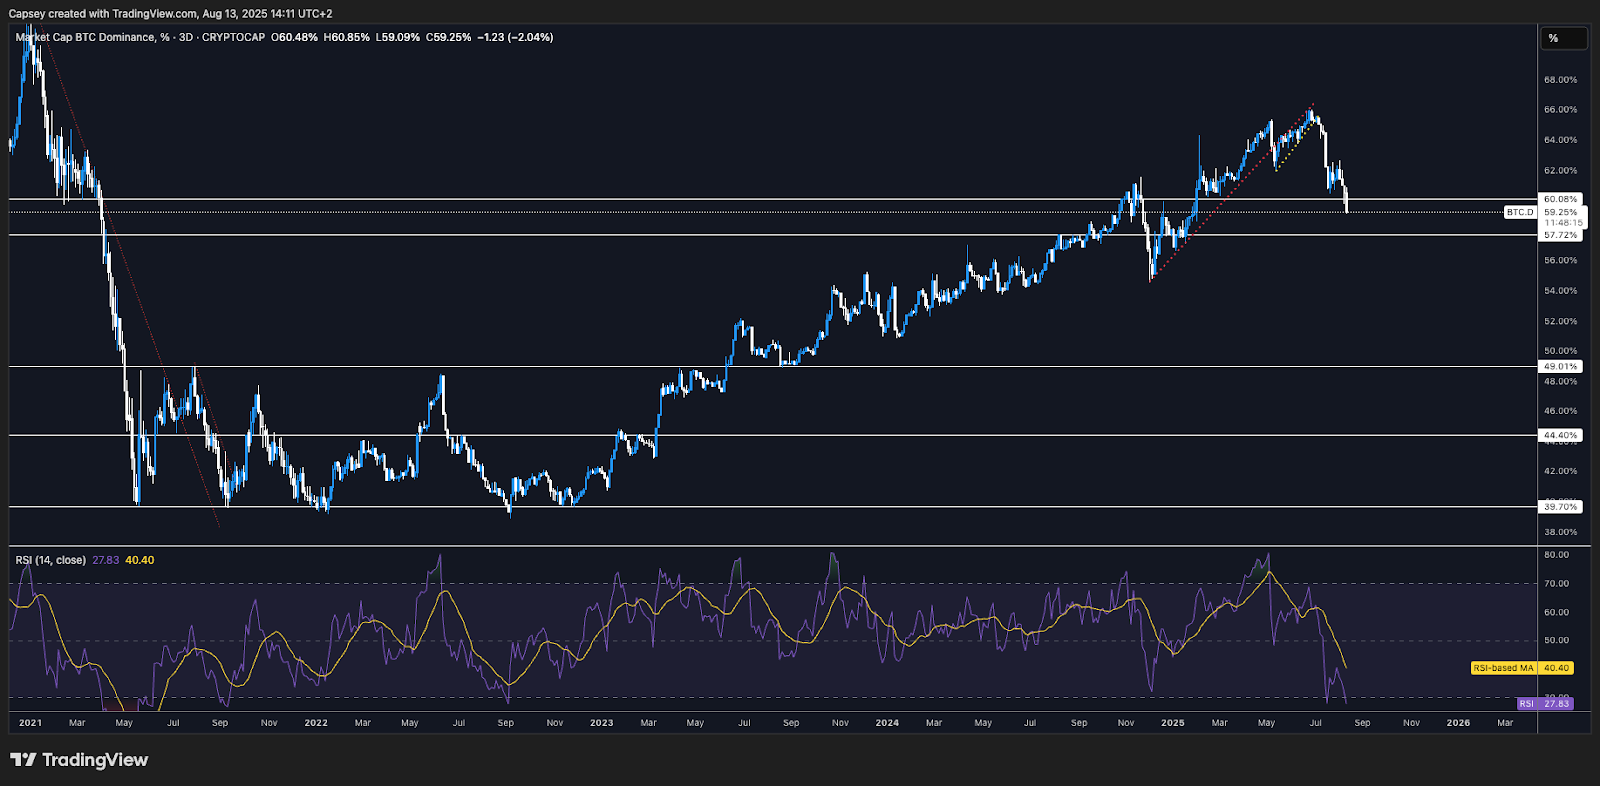
Chart Title: BTC.D 3D Timeframe
Alongside this, ETH/BTC has broken out on the 3D timeframe, although it may now potentially be running into a local resistance at 0.04.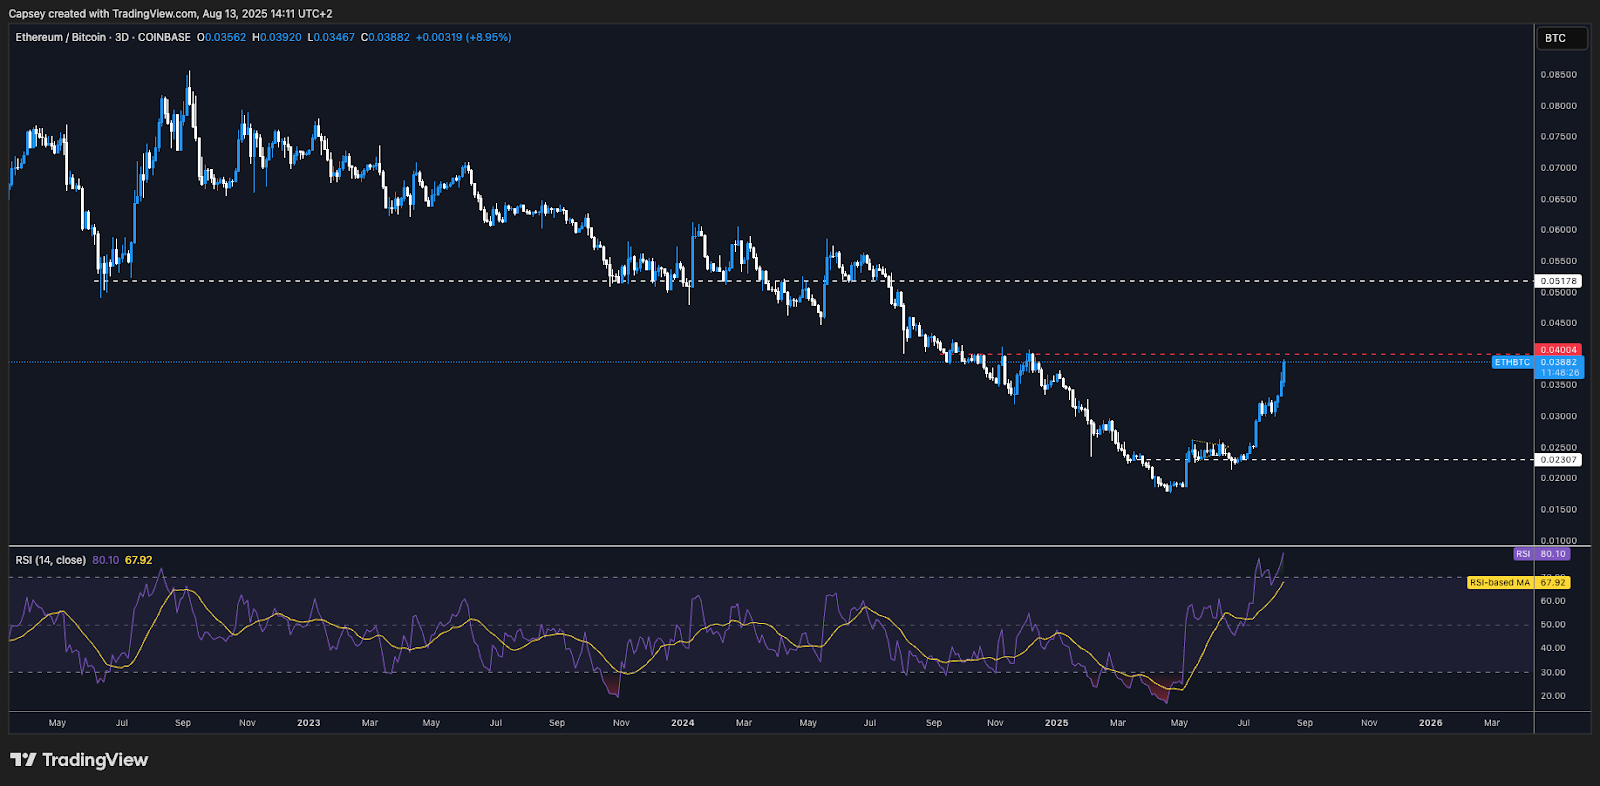
Chart Title: ETH/BTC 3D Timeframe
But despite ETH/BTC moving close towards a key horizontal resistance at 0.04 (granted this does follow a phenomenal move higher), TOTAL3 (total Crypto market cap excluding BTC and ETH) has been range-bound between $930b and $1.13t since its breakout in mid-July. Perhaps this is where we now see ETH continue to perform, but possibly slow down, and TOTAL3 (the rest of the space) see a more substantial leg to the upside.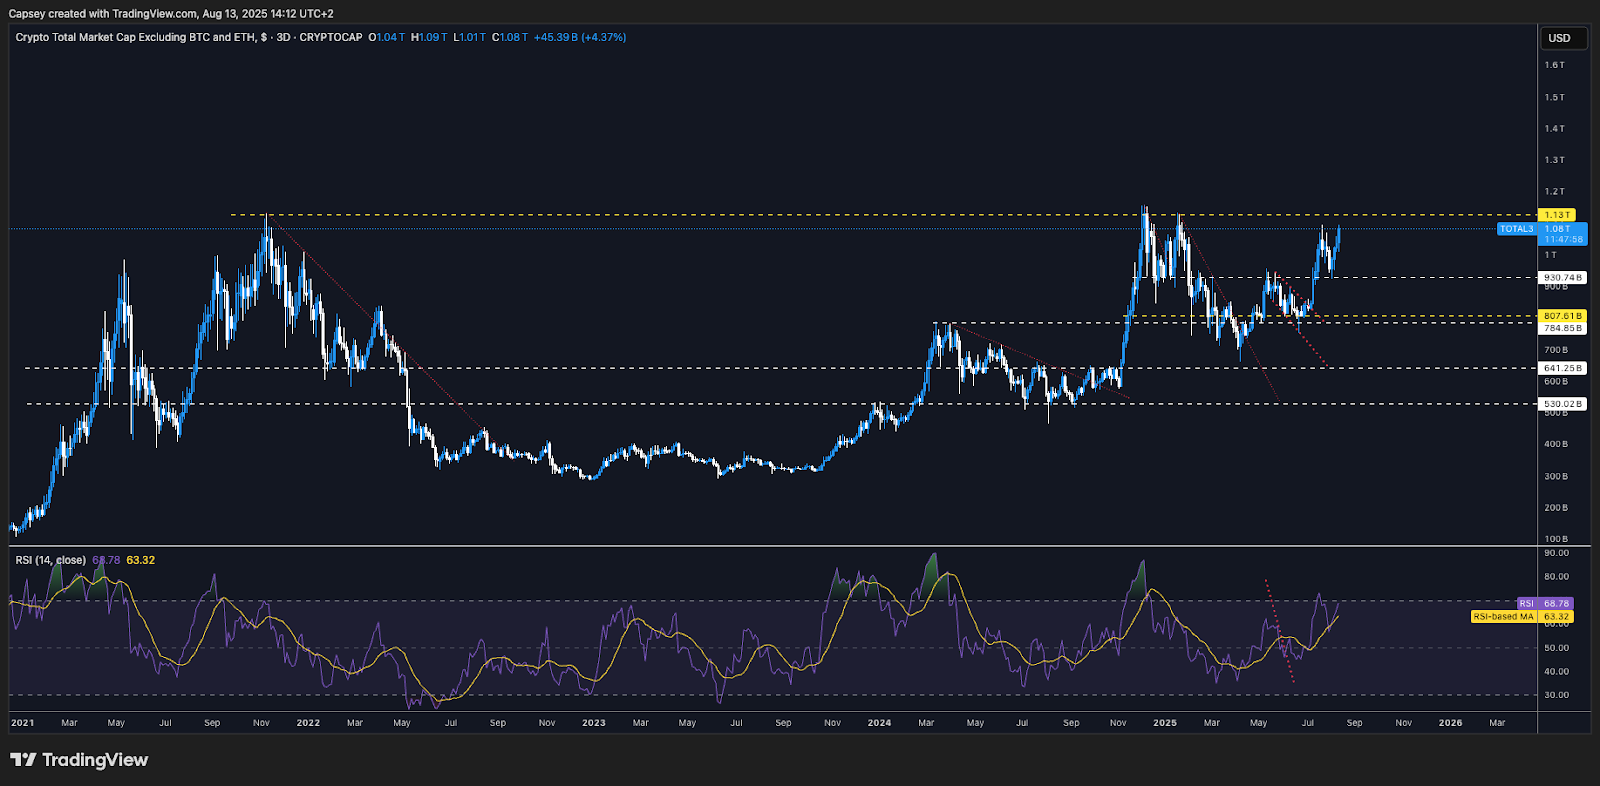
Chart Title: TOTAL3 3D Timeframe
A breakout of $1.13t on TOTAL3 would be the bullish signal that would likely mean we see a more widespread rally - "alt season".Whilst it's also possible that we see ETH slowdown in the short-term (against the BTC pair, so ETH/BTC), we do expect ETH to continue outperforming over the coming months as the ETH Treasury company narrative remains in full swing. Yesterday, Tom Lee's BitMine filed to expand its at-the-market equity program by $20b, which would be used to buy more ETH. This is a 5x increase in their prior raise.
To put this in perspective, ETH's Market Cap is at $565b (which is up 30% over the last 7 days), and $20b can very likely result in more than a 4-5% increase in ETH's market cap from here. This is absolutely an institutional drive higher for ETH, so that's worth noting in that ETH betas are likely to perform well, but we're not sure that a new "alt season" means that everything outperforms, as there are just simply too many coins now.
But we do expect that Majors, ETH and SOL betas, and core and major memes are the select sectors that perform going forward.
Cryptonary's Take:
As we assess the different components of the market, we can whittle it down to a few key parts:- The macro remains constructive as the FED is likely to deliver a series of interest rate cuts at least into Q1 2026.
- BTC broke out of its all-time highs, and price has consolidated mostly between $115k-$123k.
- ETH has now broken out of a significant horizontal resistance at $4,000, and this likely opens the floodgates for confidence to flow back into other coins and for some to outperform.
We remain convinced that the coming months will be a phenomenal environment for Crypto, and we expect to see substantial returns during this period.
Recommended from Cryptonary


