Save 23% ($351) & Get a Free 1-1 Call with our Team ⏰ : 0d 2h 59m 44s
Market Update: Macro Risks Signal Further Downside
Earlier in the week, we had a lot of questions about whether we still see the $50k-$60k level being reached for Bitcoin. So, in this report, we're going to dive into the on-chain picture and assess Bitcoin from that lens before finishing with our macro analysis, and where that potentially leaves Bitcoin in the coming months.

Disclaimer: This is not financial or investment advice. You are responsible for any capital-related decisions you make, and only you are accountable for the results.
Bitcoin's On-Chain Data
One of the first metrics we looked at for today's report was the 'Bitcoin Market Drawdown %'. This clearly shows that Bitcoin is in a bear market considering the large percentage drawdown for price since the all-time high set back in early-October 2025.Bitcoin Market Drawdown (%)
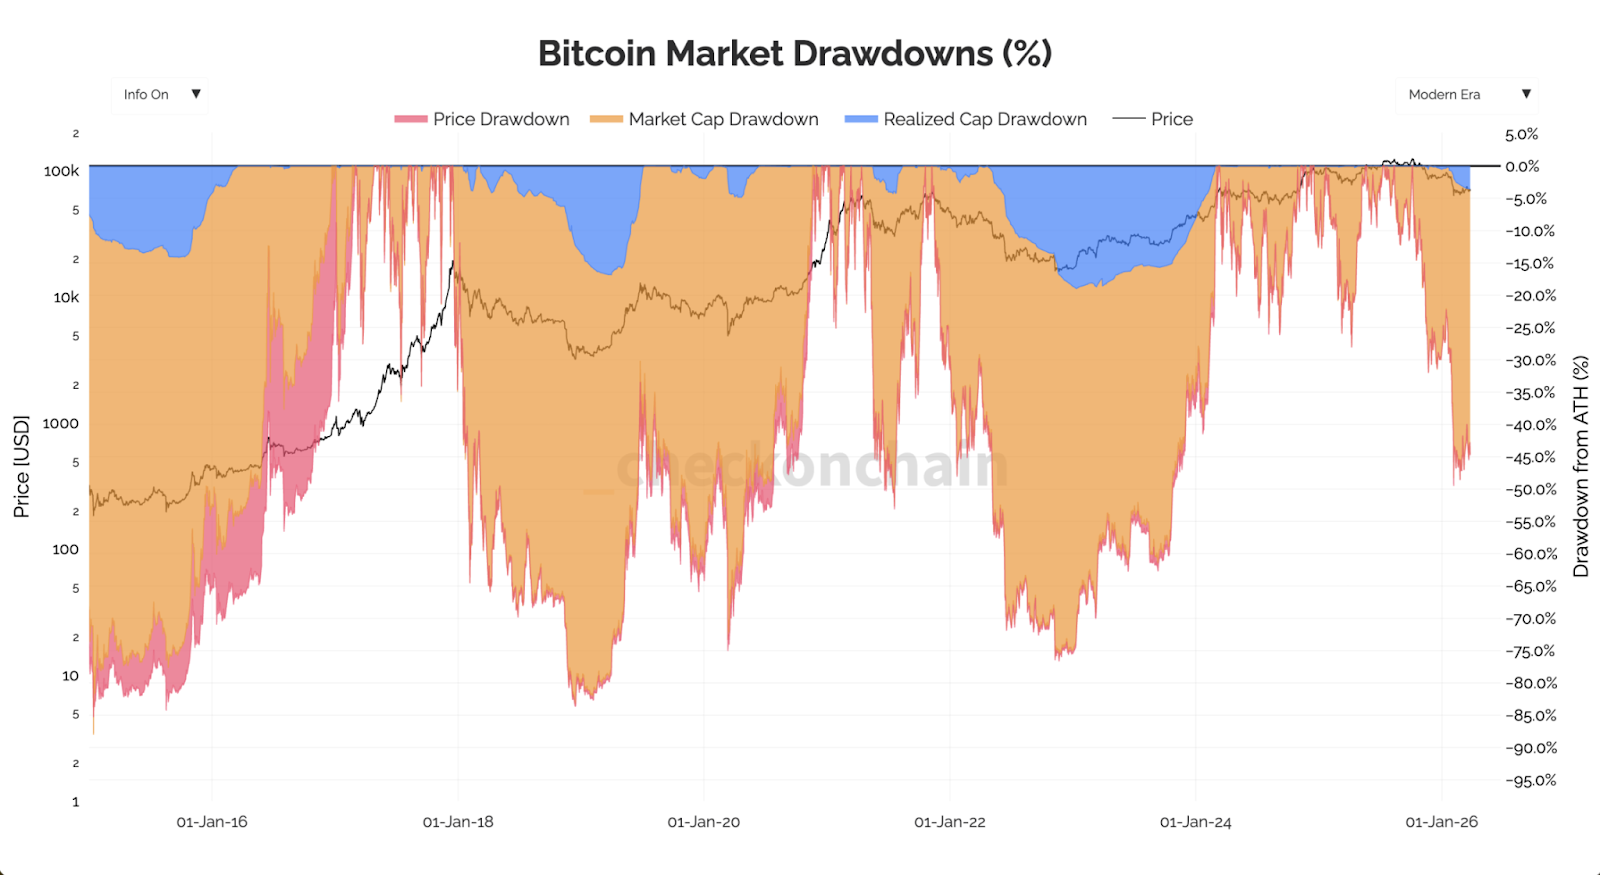
However, the price drawdown isn't as extreme as prior bear markets, but of course there is the argument that the market is more mature now and therefore we should expect diminished returns to the upside, and also to the downside. We saw this in the 2024/2025 bull market, with Bitcoin underwhelming expectations to the upside.
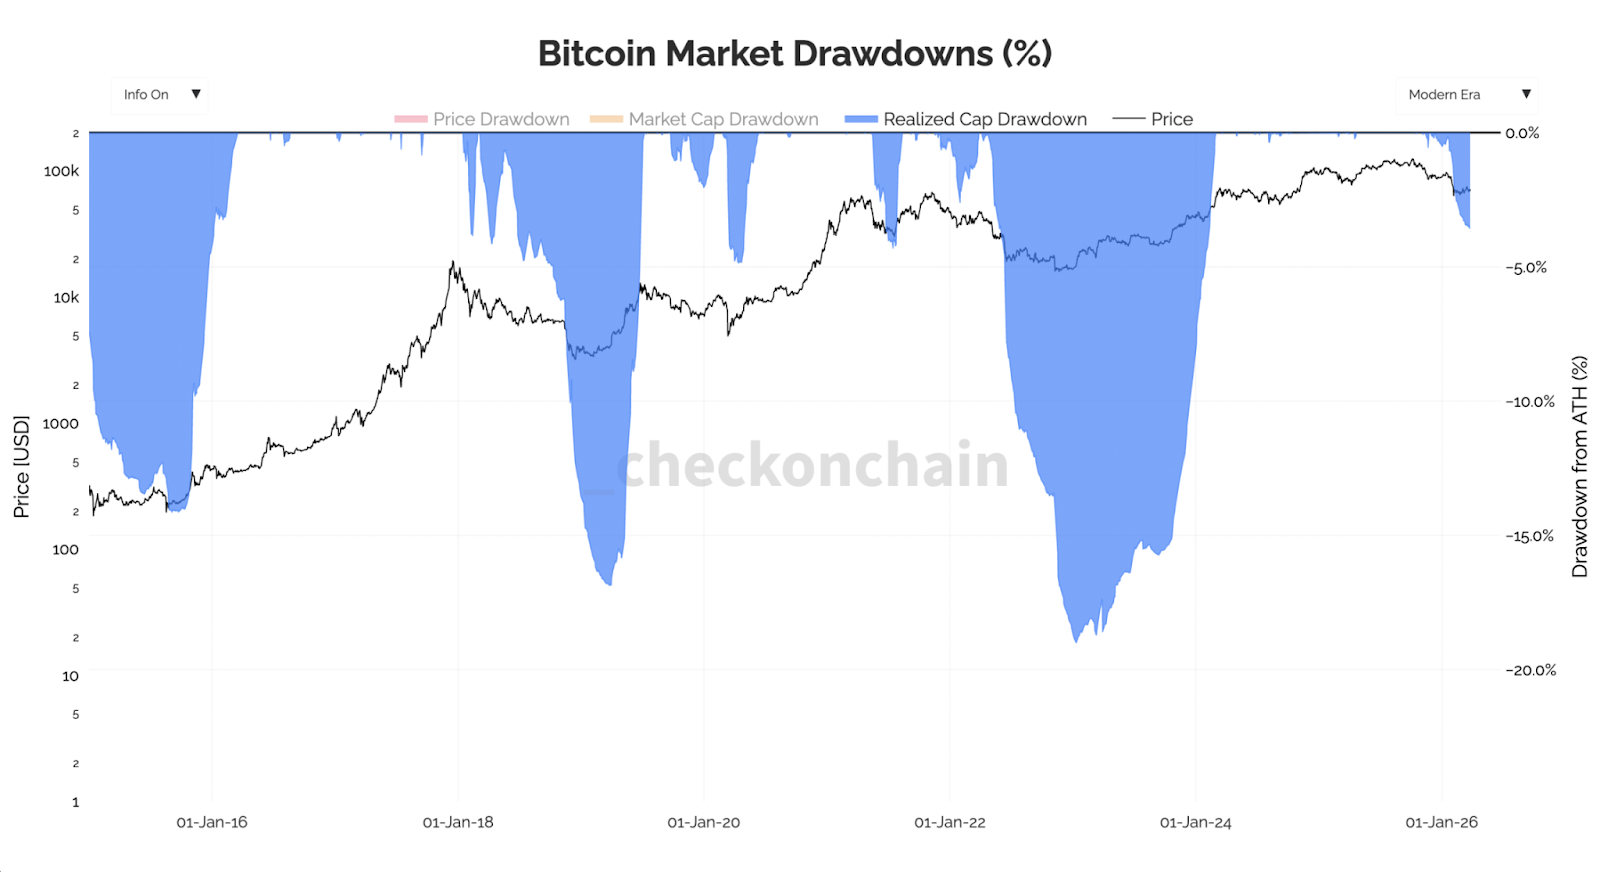
But when we look at the 'Bitcoin Market Drawdown (%)' again, and we just highlight the Realised Cap drawdown, that's only at 3.6%. If we put this into prior bear market perspectives, the drawdown is relatively shallow, and it suggests that not enough UTXOs are in a loss and that potentially not enough 'price pain' has been felt yet.
Bitcoin Market Drawdown (%) - Realised Cap
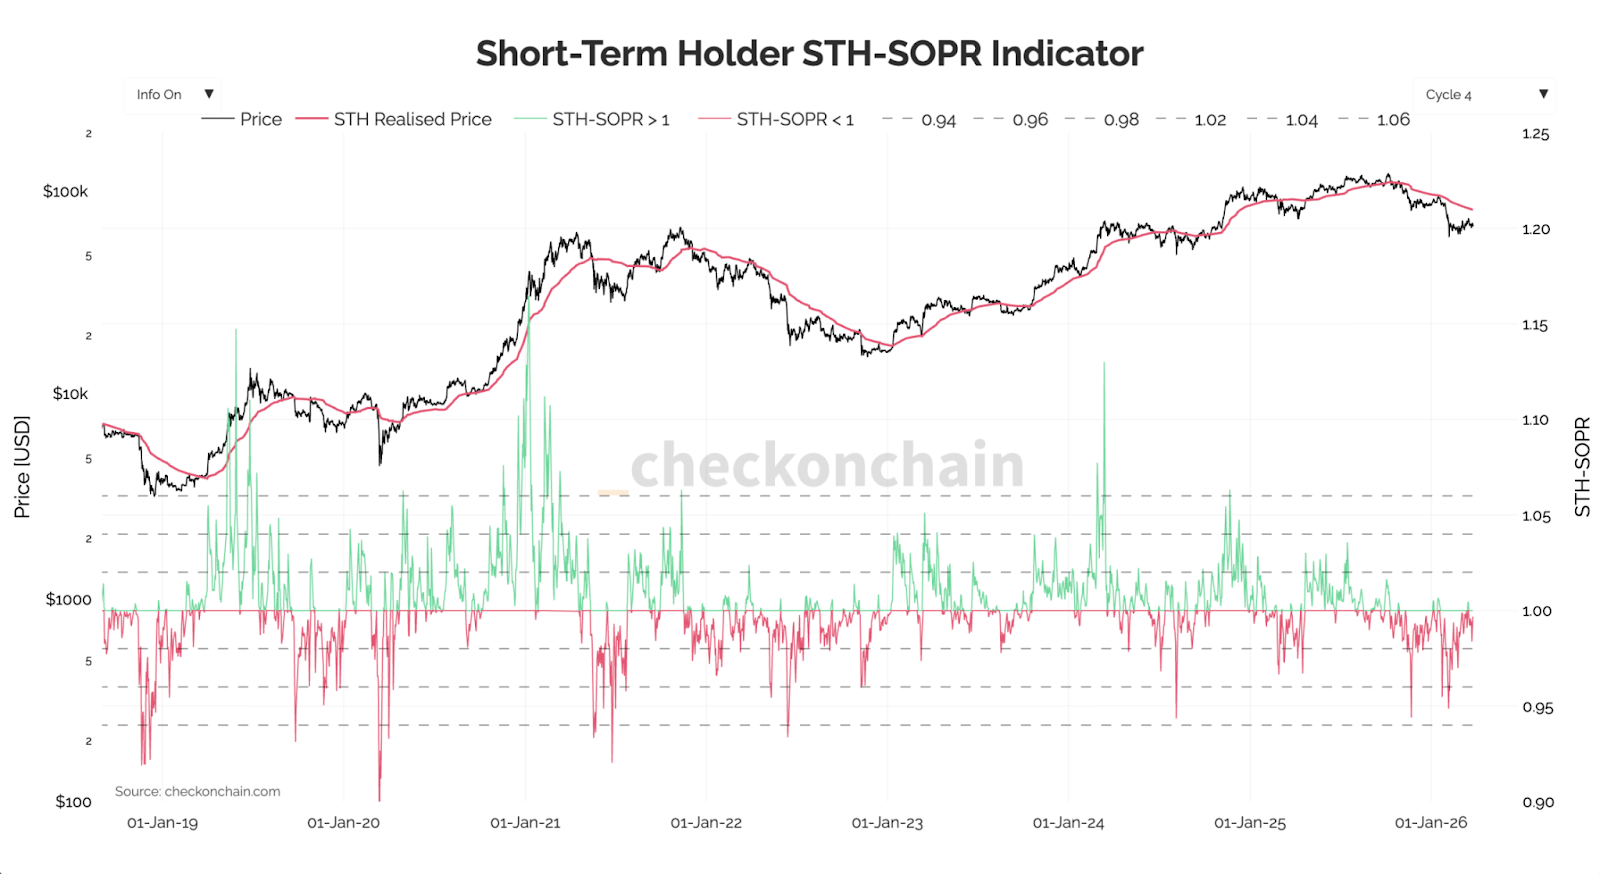
The above metrics suggest that more downside is possible, and when we look at metrics like Short-Term Holder SOPR (Spent Output Profit Ratio), this shows typical investor behaviour during bear markets - mostly coins are held at a loss, and then they're sold into rebounds into the STH cost basis. This is why we see the metric below remain in the red, and as the red line spikes into the horizontal 0 level, it rejects there (see the far right-hand side of the chart).
This is typical bear market behaviour.
Short-Term Holder SOPR
So, we've firmly established that we're in a bear market (obviously), and we can see that investor behaviour is typical of bear markets. If we refer back to the first metric we covered (Bitcoin Market Drawdown), we said that this current bear market hasn't been as extreme and perhaps not as much 'pain' has been felt.
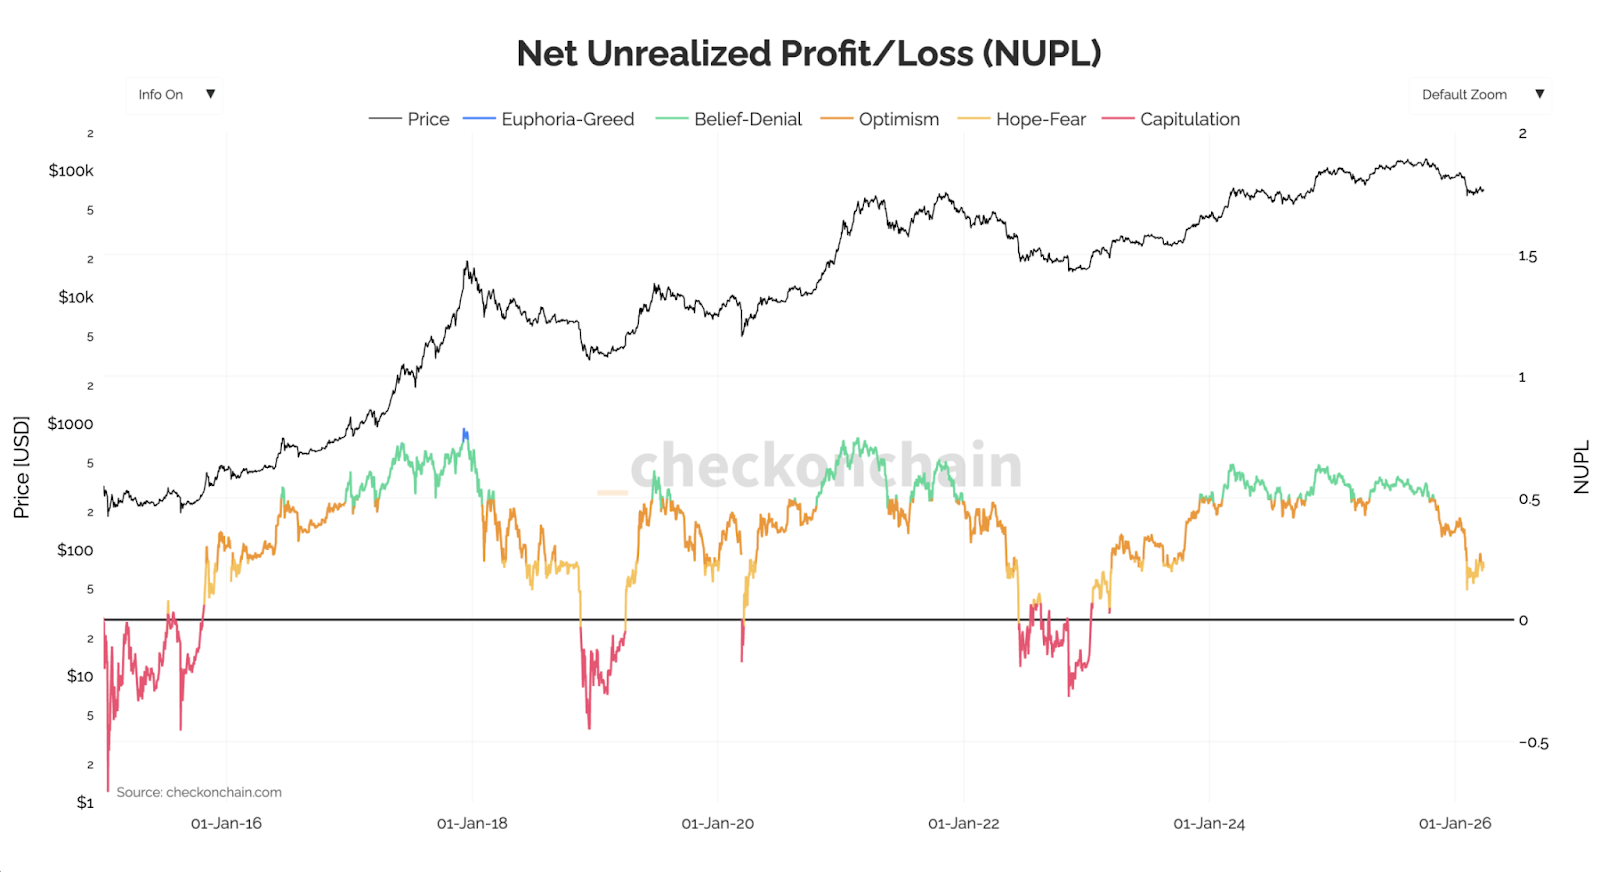
Looking at the Net Unrealised Profit/Loss, we can see that the unrealised losses are significant, but they're nowhere near prior bear market lows that we've seen historically. In fact, when the price was recently at $74k, the Net Unrealised Profit/Loss was in the 'Optimism' zone (orange). Should this metric fall into the lower bound of the yellow area ('Fear'), we'd be more convinced that that would be a deep value area for price. North of $70k doesn't look to be 'deep value' to us. That 'deep value' is likely closer to the low $60ks, this would be confirmed to us should we see this metric dip into the red zone ('Capitulation') - we still haven't seen that area so far in this current bear market.
Net Unrealised Profit/Loss
Let's now turn to pricing models.
The first is 'Bear Market Floor Price Models'. This is a fantastic chart that shows a compilation of indicators and cost basis models. Historically in bear markets, Bitcoin has fallen into and even below the bottom band which is the -1.0 AVIV, and -1.0 MVRV (both currently $61k) as the top border of the zone, and then the -1.5 AVIV and the -1.5 MVRV (both currently between $51k and $52k).
Bitcoin has also historically bottomed when the red band (STH-MVRV) crosses below the blue and purple bands (AVIV and MVRV) - which hasn't happened yet.
Bitcoin's price, as of today, has just fallen back into the red band (STH-MVRV), which sits well above the blue (AVIV) and the purple (MVRV) bands. This suggests that there's further downside to go from the late $60ks, with the low-$60ks likely being the bare minimum target.
Bear Market Floor Price Models
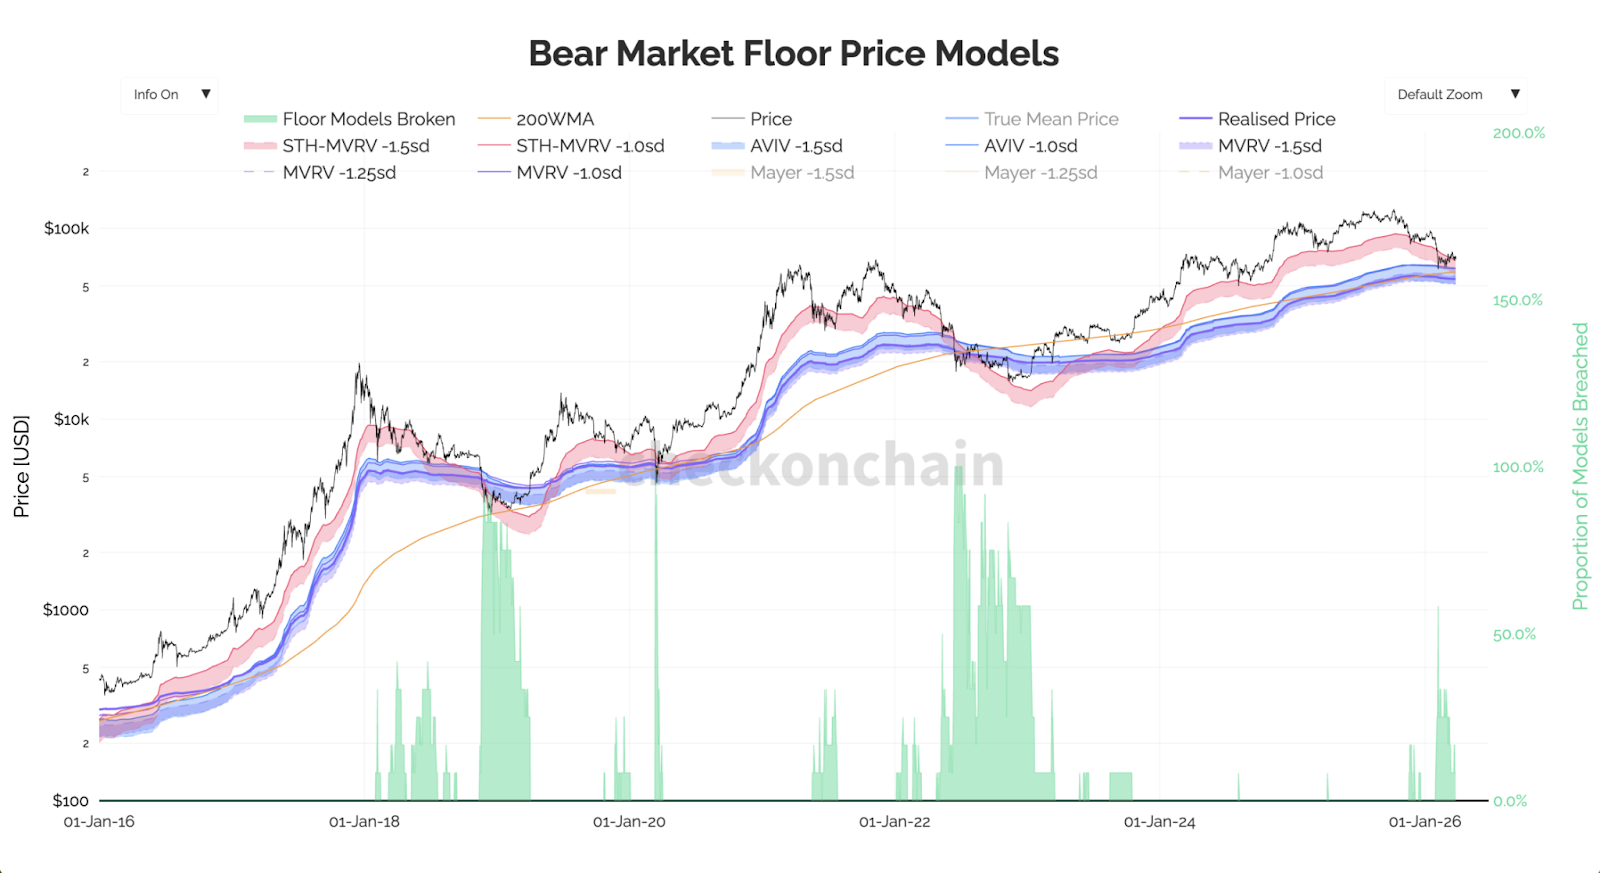
In short, this metric tells us the following:
- Bitcoin north of $70k isn't close to 'deep value' territory.
- 'Deep value' territory is far closer to the low-$60k, with it becoming more substantial in the mid-to-high $50ks.
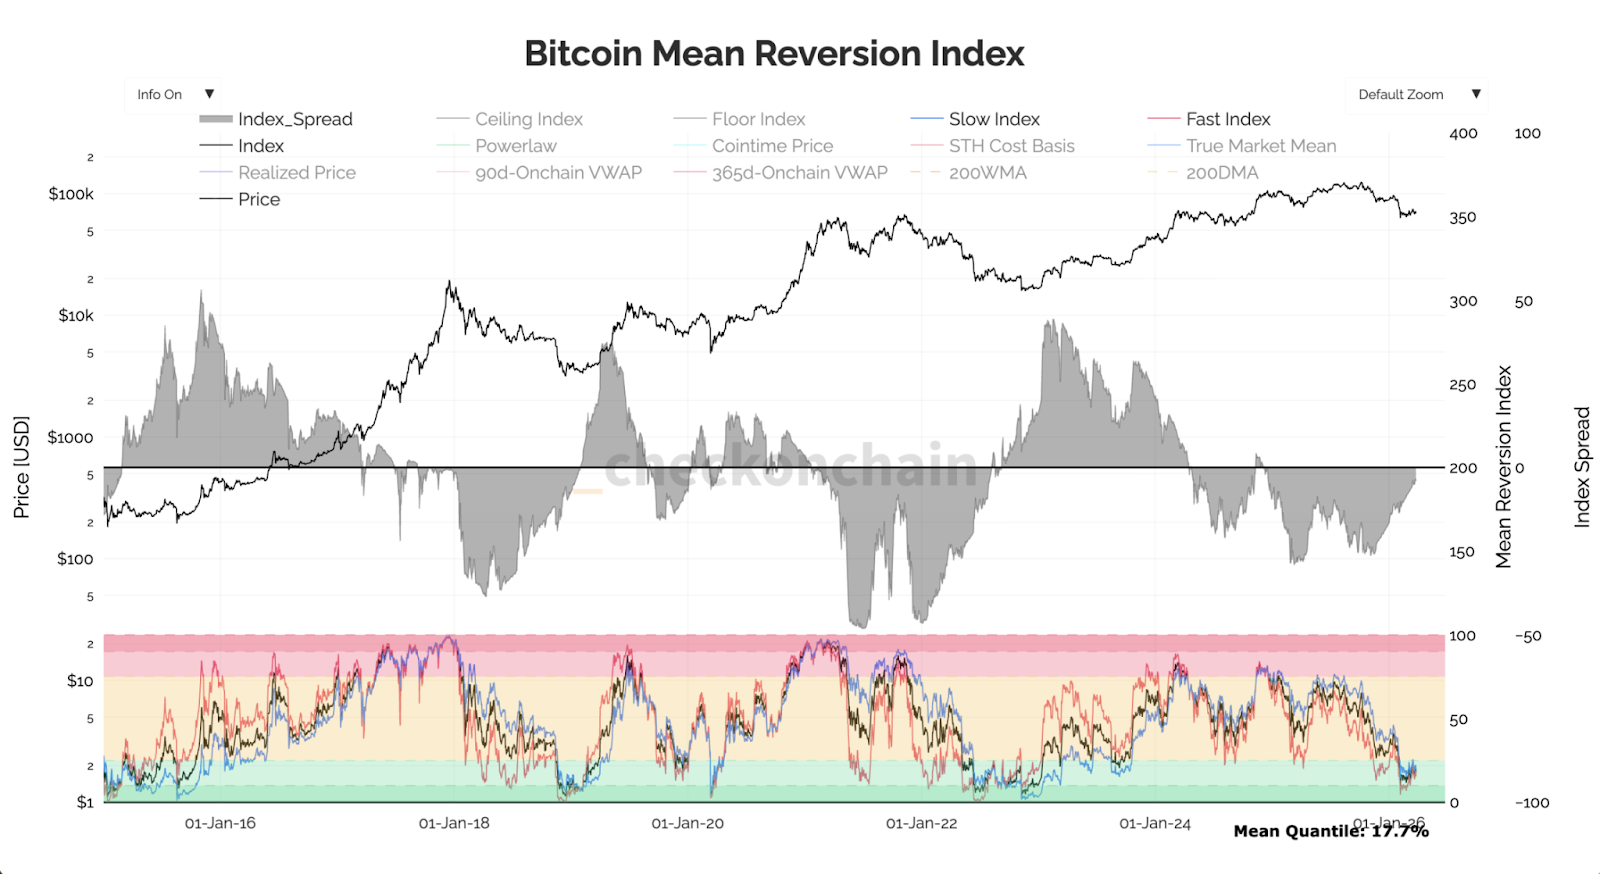
In prior bear markets, the Bitcoin Mean Reversion Index, and more importantly, the 'Index_Spread' (the grey zone) has gone from deeply negative, and moved up towards the 0 line, before sweeping upwards into positive territory. Currently, this indicator is sweeping up from a deeply negative level, but it hasn't crossed the 0 line yet. This suggests that there's further downside for price, whilst price hammers out that bottoming process over the coming months - something we've covered extensively over recent weeks.
Bitcoin Mean Reversion Index
Ultimately, and in summarising this section, market participants have felt pain in this bear market, but it's at levels that are nowhere near prior bear markets. From assessing the above on-chain metrics and indicators, a reasonable assumption would be that a lot of 'price pain' has already been had, but that there's likely more still to come. Bitcoin remains well above 'deep value' zones, with those areas more likely between the $50k and the $60k price levels, as shown in the key cost basis metrics above. Bitcoin doesn't represent 'deep value' above $70k, with 'deep value' represented far closer to $60k and below.
So the outlook for Bitcoin is that from an on-chain perspective, we're expecting lower prices, and for Bitcoin to fall below $60k in the coming months. $60k and below is where we'd look to get more aggressive with buys with a long-term view.
If we now pivot from on-chain to macro, and we'll keep this relatively light as we've covered it substantially over the last fortnight, we can see that the picture is even less constructive for risk assets.
Is Trump All Out of TACOs?
In the last 24 hours, President Trump has said that he has "agreed" to extend the pause on strikes on energy infrastructure (which was his own self-imposed deadline) by 10 days to April 6th. Although mediators have said that the Iranians didn't ask for this.Alongside this, the Israelis have continued strikes on Iran, whilst the US is deliberating to send another 10,000 troops to the Middle East whilst there have been significant military additions to the region in recent days. If we then pair this with an Iranian regime that seemingly isn't interested in a ceasefire, and rather a full end to the war but with significant concessions in their favour, which the US are likely unwilling to agree to, then it looks as if there isn't a credible off-ramp for President Trump and escalation seems the most likely outcome. And, 'boots on the ground' seems to be the rumoured escalation.
It seems to us that Trump is looking for a credible off-ramp, and there just isn't one there. The natural progression from there is then 'boots on the ground' with a potential US invasion of an island (likely Kharg island) in the Strait, rather than an invasion of Iran. Markets are now more than sniffing this out, and risk assets have traded poorly off the back of this, and they look set for lower.
The Dollar (DXY) is up, squeezing into 100, whilst the equity indexes are breaking below their supports.
S&P500 1D Chart - Breaking below its support.
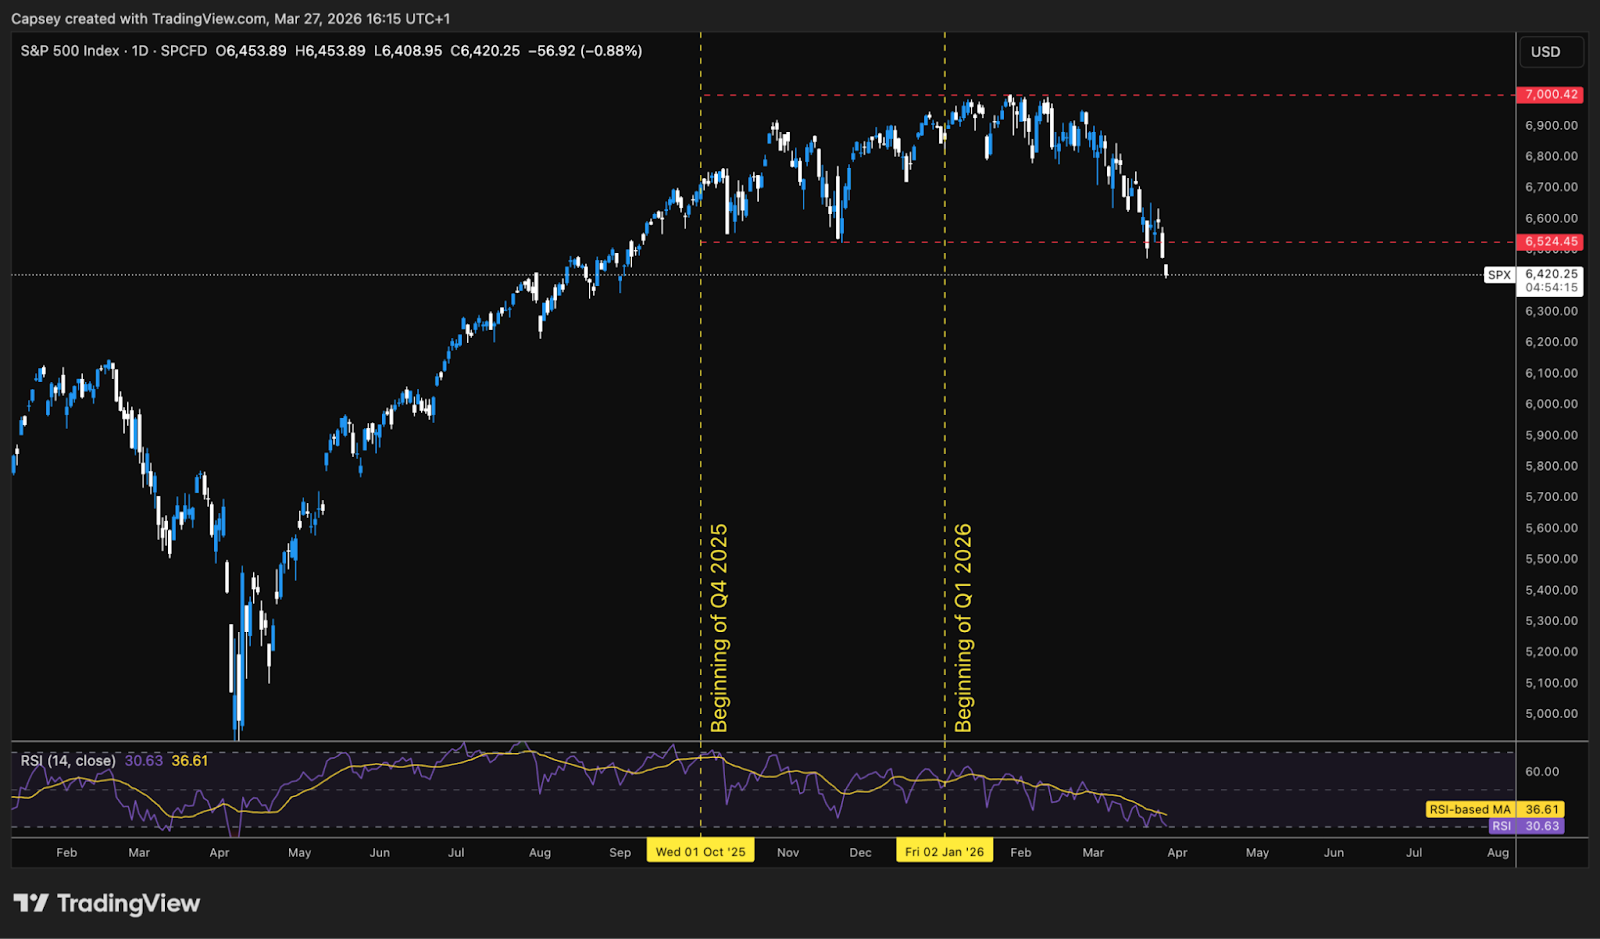
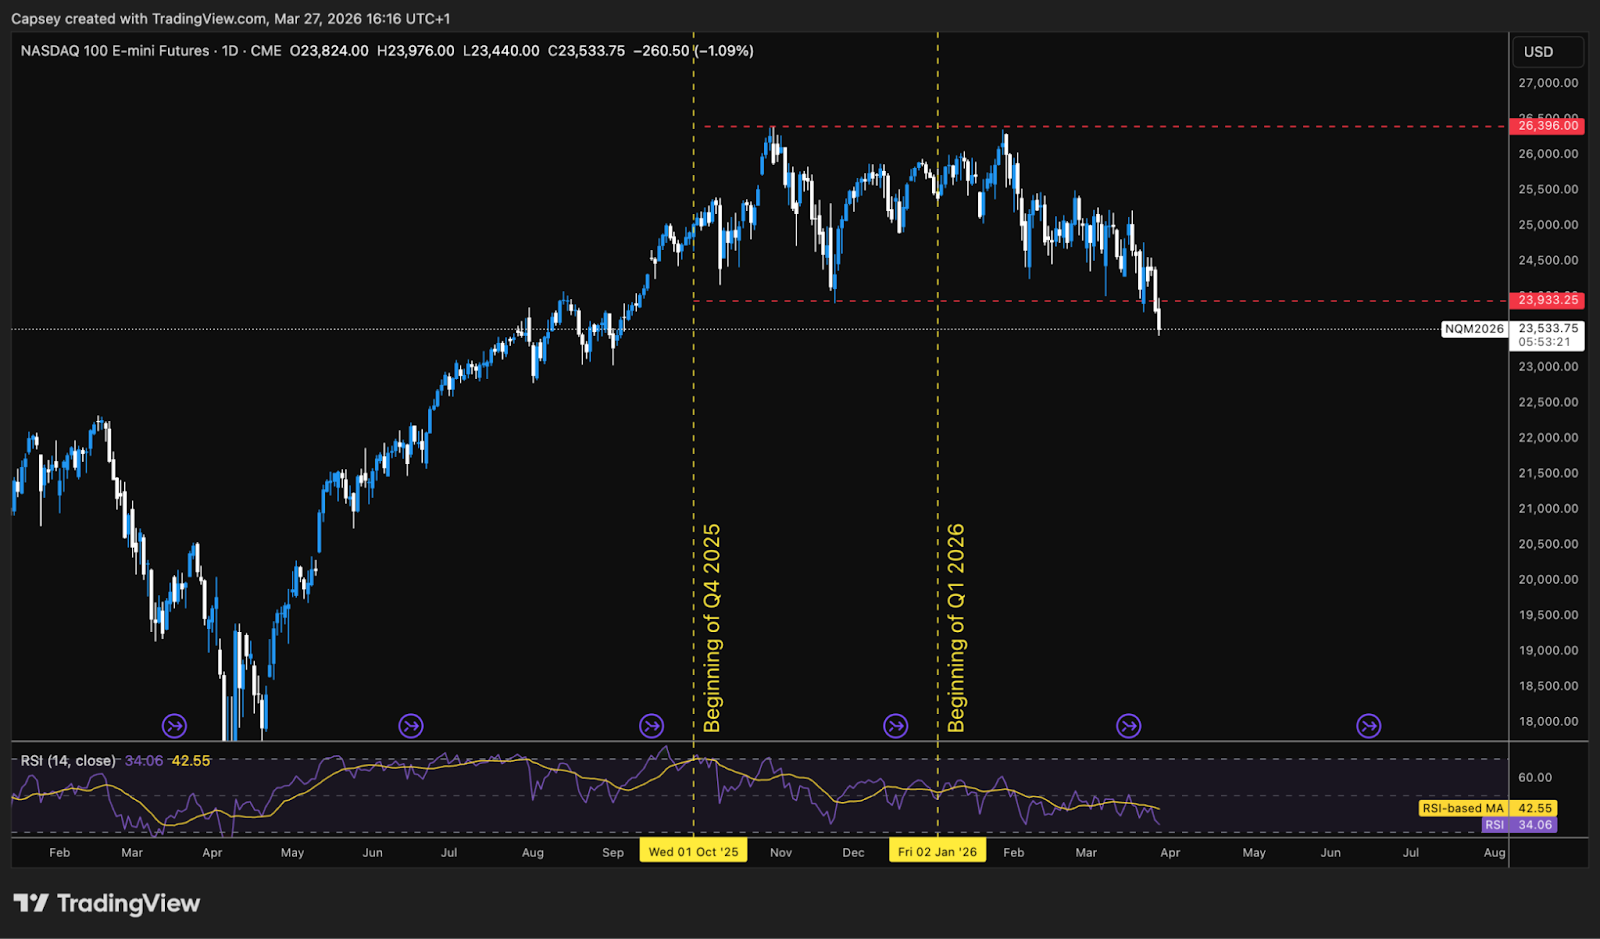
Whilst the Nasdaq is doing the same. Bear in mind both indexes have essentially gone nowhere for the last 6 months.
Nasdaq 100 1D Chart - Breaking below its support.
But to us, it feels that the equity indexes have got the message (the risk-off trade) quite late. Our reasoning for this is that Bond Yields have been soaring higher. This is likely due to greater inflation and increased Bond issuance due to come in the coming months (because of higher oil prices due to the Iranian closure of the Strait, and increased issuance to raise more debt to fund the war).
To put specific numbers on this: the 30-year Treasury yield hit 4.97% intraday today before settling at 4.95% - just 5bps from the 5.00% level that saw the Fed intervene following Liberation Day in April 2025. The 10–year Yield reached 4.45%, its highest since the war started (+49bps since February 28th).
These soaring Bond Yields have been a signal (to us at least) that the risk-off trade is alive and well. However today, we think this is emphasised further. We see that tell in Bond Yields now coming back down - and not due to de-escalation in the Middle East, but rather the growing risk of recession due to higher oil prices, due to a more prolonged conflict.
US2Y Bond Yield
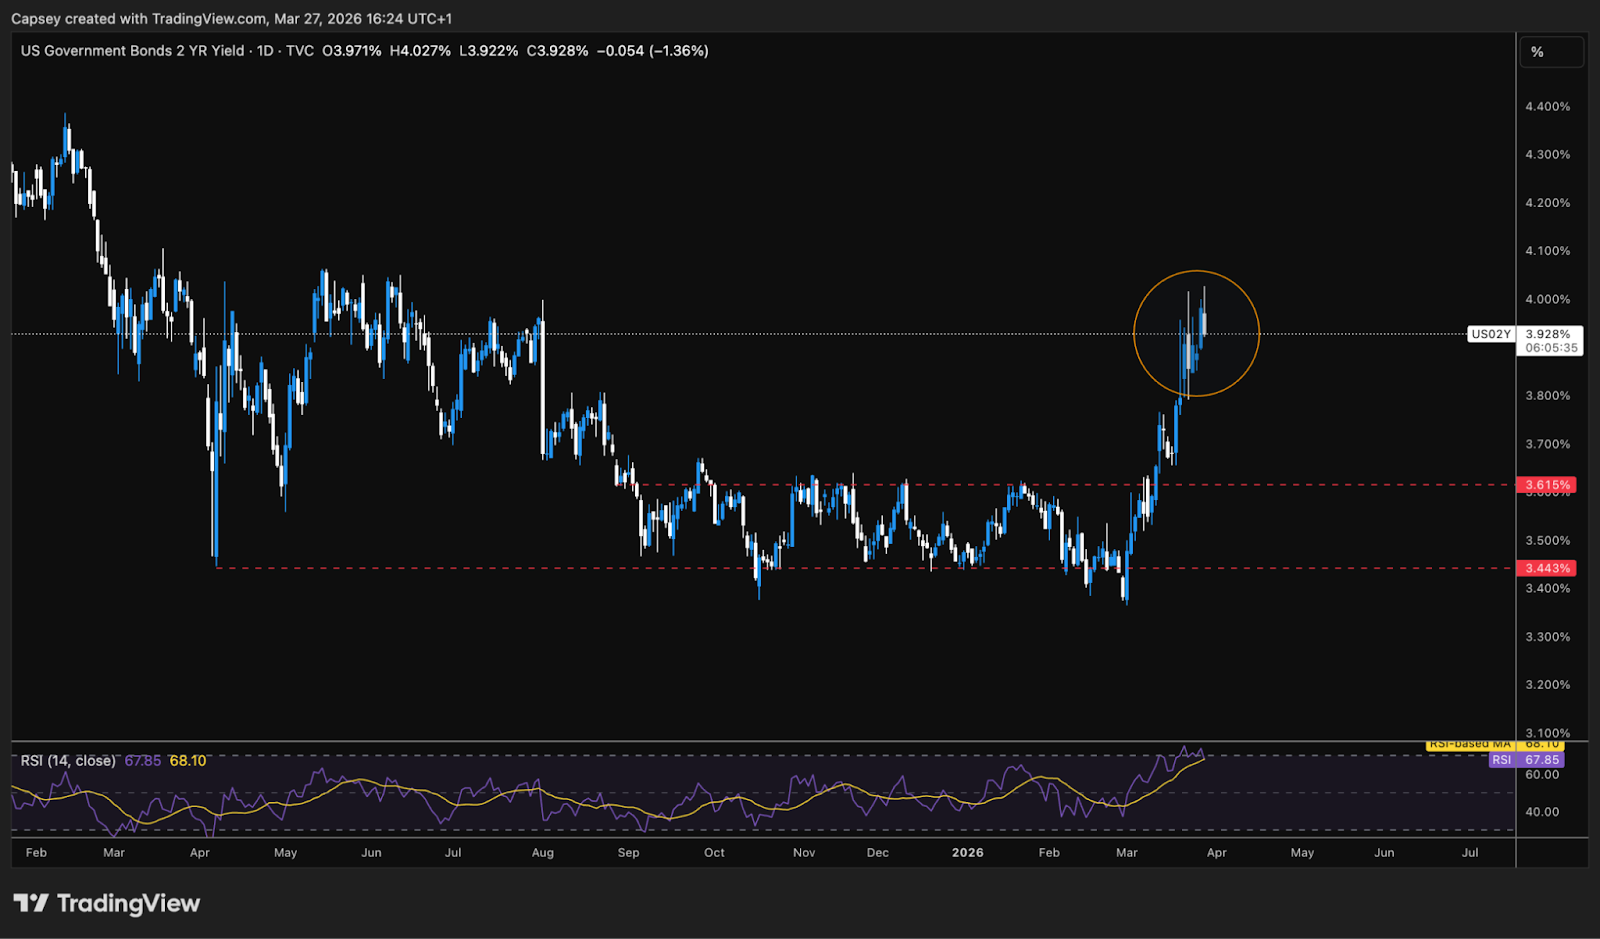
We believe this is reflected in the Dollar strength that we've seen over the last few days (as Bond Yields have soared higher), before Bond Yields have then come down today - a flight from dollar assets into US Treasuries, a flight to safety trade.
Dollar Index (DXY) 1D Chart
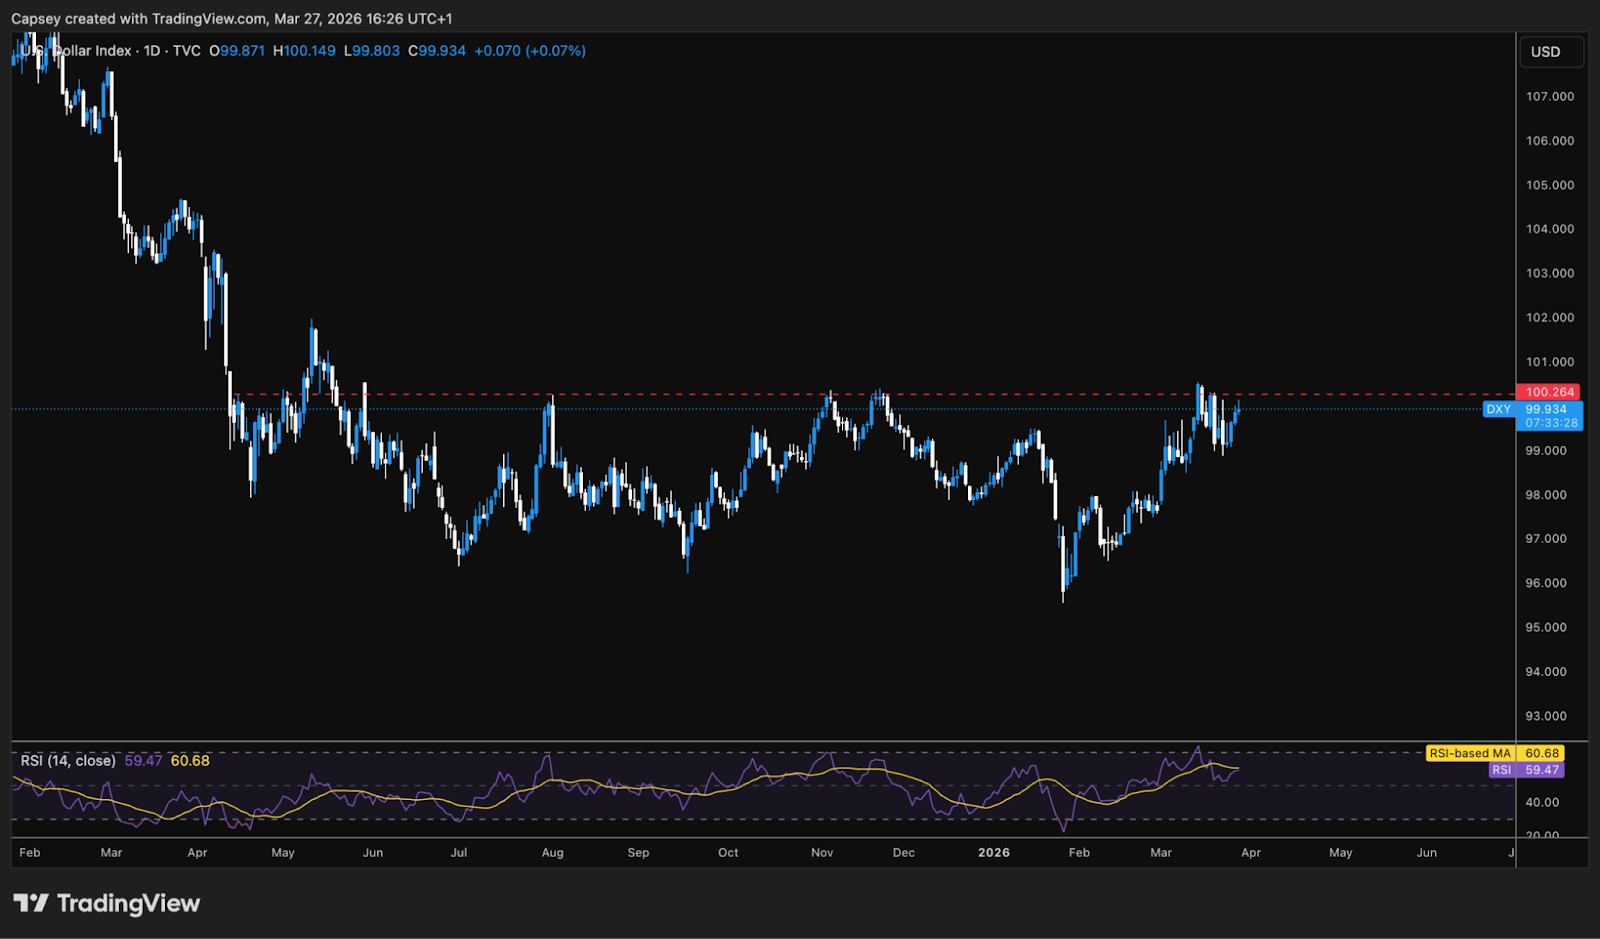
Ultimately, markets are no longer reacting well to Trump's TACO's (Trump Always Chickens Out) as the realisation sets in that it's not solely up to President Trump to "undo" this. The Iranians have to be willing to end the conflict as well, and at the moment, it seems they're not as they have the upper hand in keeping the Strait of Hormuz closed and putting maximum pressure on President Trump with higher oil prices.
It's possible that the next move from President Trump is 'boots on the ground' and some form of land invasion, likely an island in the Strait that gives the US more control in the Strait and therefore the flow of ships and oil. Risk assets are unlikely to take this kind of escalation well and therefore we maintain the view that risk assets have more downside. If we then pair this with the on-chain picture for Bitcoin, the value zones are at lower prices, closer to $60k and below, not at the current price of $67k.
Cryptonary's Take
From both the Bitcoin on-chain lens, and the macro lens, we're currently in an unsupportive environment for risk assets, including Bitcoin. And in the trends we've analysed above, we only expect to be exacerbated further i.e., a continued tightening in macro conditions from higher oil prices due to the conflict in the Middle East, which we expect to escalate further, and likely this weekend.To answer the question that we put at the top of this report: do we still see the $50k-$60k level being reached for Bitcoin? From assessing the data, be it on-chain data and/or macro data, our answer to this question would be 'yes'. We'd put 'yes' at a far higher probability than we would the 'no' answer.
So, our strategy remains the same: overweight cash (the same since we de-risked when BTC was at $111k) with the view to putting our capital back to work in the following way:
- BTC between $60k-$63k: Light Buys.
- BTC between $55k-$60k: Heavier Buys.
- BTC between $50k-$55k: Full Allocation.
Key Dates Ahead
- April 3: Labour market report.
This content is for informational and educational purposes only. Cryptonary is not authorised or regulated by the Financial Conduct Authority (FCA) or any other financial regulatory body. Nothing in this publication constitutes a personal recommendation or advice to buy, sell, or hold any virtual asset. Virtual assets may lose their value in full or in part and are subject to extreme volatility. You can lose all invested amounts and do not benefit from any form of financial protection. Past performance does not indicate future results.
Continue reading by joining Cryptonary Pro
$1,548 $1,197/year
Get everything you need to actively manage your portfolio and stay ahead. Ideal for investors seeking regular guidance and access to tools that help make informed decisions.
For your security, all orders are processed on a secured server.
As a Cryptonary Pro subscriber, you also get:
3X Value Guarantee - If cumulative documented upside does not reach 300% during your 12-month membership, you can request a full refund. Terms
24/7 access to experts with 50+ years’ experience
All of our top token picks for 2025
On hand technical analysis on any token of your choice
Weekly livestreams & ask us anything with the team
Daily insights on Macro, Mechanics, and On-chain
Curated list of top upcoming airdrops (free money)
3X Value Guarantee
If cumulative documented upside does not reach 300% during your 12-month membership, you can request a full refund.
Our track record speaks for itself
With over 2.4M tokens and widespread misinformation in crypto, we cut through the noise and consistently find winning assets.
Our track record speaks for itself
With over 2.4M tokens and widespread misinformation in crypto, we cut
through the noise and consistently find winning assets.


Frequently Asked Questions
Can I trust Cryptonary's calls?
Yes. We've consistently identified winners across multiple cycles. Bitcoin under $1,000, Ethereum under $70, Solana under $10, WIF from $0.003 to $5, PopCat from $0.004 to $2, SPX blasting past $1.70, and our latest pick has already 200X'd since June 2025. Everything is timestamped and public record.
Do I need to be an experienced trader or investor to benefit?
No. When we founded Cryptonary in 2017 the market was new to everyone. We intentionally created content that was easy to understand and actionable. That foundational principle is the crux of Cryptonary. Taking complex ideas and opportunities and presenting them in a way a 10 year old could understand.
What makes Cryptonary different from free crypto content on YouTube or Twitter?
Signal vs noise. We filter out 99.9% of garbage projects, provide data backed analysis, and have a proven track record of finding winners. Not to mention since Cryptonary's inception in 2017 we have never taken investment, sponsorship or partnership. Compare this to pretty much everyone else, no track record, and a long list of partnerships that cloud judgements.
Why is there no trial or refund policy?
We share highly sensitive, time-critical research. Once it's out, it can't be "returned." That's why membership is annual only. Crypto success takes time and commitment. If someone is not willing to invest 12 months into their future, there is no place for them at Cryptonary.
Do I get direct access to the Cryptonary team?
Yes. You will have 24/7 to the team that bought you BTC at $1,000, ETH at $70, and SOL at $10. Through our community chats, live Q&As, and member only channels, you can ask questions and interact directly with the team. Our team has over 50 years of combined experience which you can tap into every single day.
How often is content updated?
Daily. We provide real-time updates, weekly reports, emergency alerts, and live Q&As when the markets move fast. In crypto, the market moves fast, in Cryptonary, we move faster.
How does the 3X Value Guarantee work?
We stand behind the value of our research. If the documented upside from our published research during your 12-month membership does not exceed three times (3X) the annual subscription cost, you can request a full refund. Historical context: In every completed market cycle since 2017, cumulative documented upside has exceeded 10X this threshold.
TermsRecommended from Cryptonary


