Save 23% ($351) & Get a Free 1-1 Call with our Team ⏰ : 0d 2h 59m 44s
Market Update: Rate Cuts Anticipated, Risk Assets Stay Supported
Markets are moving fast this week with key inflation data, shifting interest rate expectations, and sharp price action across the board. With the Fed expected to cut rates soon, all eyes are on whether these moves will fuel the rally or signal deeper concerns. Here’s what we’re watching and how we’re positioning.

Disclaimer: This is not financial or investment advice. You are responsible for any capital-related decisions you make, and only you are accountable for the results.
TLDR:
- Key focus: PPI & CPI data this week; FED cuts likely if forecasts hold.
- Markets pricing Sept, Oct, Dec cuts — seen as bullish, not recessionary.
- Gold rally stalling BTC; next leg up possible if BTC reclaims $117k.
- BTC dominance down, TOTAL3 near breakout; HYPE & SOL may lead over ETH.
- Still risk-on and buying dips, but weaker jobs data could flip the outlook.
Topics covered:
- Data This Week.
- The Type of Rate Cuts and Potential Market Reactions.
- BTC's Gold Correlation.
- Indexes.
- Cryptonary's Take.
Data This Week:
The key data this week is the inflation data. We have PPI tomorrow (Wednesday), followed by CPI on Thursday.The forecasts for PPI are for it to come in at 0.6%, which is hot, but not as hot as the prior months' 0.9%. For CPI, the forecast is for a slight uptick, with headline Inflation increasing to 2.8% YoY (2.7% last month), with the MoM figure also coming in slightly higher at 0.3%, compared to last month's 0.2%. The Core Inflation Rate however, is expected to be unchanged from last month's print.
Markets will be looking for the inflation data to come in below or at or around the forecasted figures, as this'll allow the FED to go ahead with Interest Rate cuts to aid a weakening labour market. Should the inflation data come in far hotter than expected, this would potentially worry markets as it would mean that the FED are losing both sides of their mandate - a weakening job market, with inflation going higher.
Our base case is for numbers to come in as forecasted, or slightly higher. However, we do expect the market to shake that off (should the print come in slightly higher) and continue on higher as we have seen the FED, and even Powell himself, suggest that they're going to look through higher inflation and label it as 'transitory' (due to the tariffs).
We'll cover the above data releases in greater detail tomorrow in a Market Pulse.
The Type of Rate Cuts and Potential Market Reactions:
Last week, we saw another weaker labour market print with prior months being revised lower to negative numbers (June's numbers). The result of this is the market is now pricing in a cut at every Meeting this year (Sept, Oct and Dec). Historically, lower Interest Rates has been bullish for risk assets for a plethora of reasons; cheaper money meaning a weaker denominator (the Dollar) and more stimulus to name a few. Therefore, rate cuts have been good for risk assets, assuming they're for the right reason. In 2024, the rate cuts were good rate cuts. That is, the Interest Rate is being brought down because the FED had made substantial progress tackling inflation, and therefore, the rate didn't need to be as restrictive. With inflation at 3.0%, and the Interest Rate at 5.50%, that would mean the FED is at least 250bps restrictive. Therefore, markets liked those rate cuts and hence we saw risk-on in late Q3 and in Q4 2024.But today, the Interest Rate is 100bps lower at 4.50%, and the FED aren't looking to cut Interest Rates because they've made substantial progress on inflation, but rather they're looking to cut rates because the labour market is showing substantial signs of weakening.
Last week, the price action following the weaker jobs data was peculiar. We had risk assets initially move higher, which is suggestive that the market took it as the jobs market is weak, so more cuts, but not weak enough that it's recessionary. However, towards the end of the trading session, we saw the long-end Bond Yield come down (buyers of the long-end Bond), which is suggestive of increased odds of recession, whilst risk assets were also suggestive of that as they came down in tandem.
But over the weekend, and coming into this week, risk assets have moved back up quite nicely. This is perhaps the market being comfortable that the labour market isn't weak enough that it signals that the US is falling into a recessio,n and therefor,e for now, the rate cuts are bullish cuts i.e., a lowering in the rate to reduce the restrictiveness of the rate (FED Funds Rate minus the Inflation Rate - 4.50%-3.00%, 150bps restrictive).
We're watching how the above develops very closely. Markets are looking for 'Goldilocks' - the labour market weakening that the FED have to reduce the Interest Rate and the restrictiveness of the rate, but a labour market that isn't falling off a cliff, it signals recession.
Macro Summary:
For now, we remain risk-on. However, there are undercurrents that we're closely watching as they may develop in a way that signals us to risk-off. Currently, we expect risk-on to continue as we see a big component of the labour market weakness being due to the new administrations immigration policies (far less illegal immigrants, which were artificially increasing the labour supply).We expect Interest Rate cuts at the September, October and December FED Meetings, with these being bullish cuts. But we're watching the situation closely as to whether this changes.
BTC's Gold Correlation:
From the Bitcoin/Crypto perspective, Gold's breakout gives us further confidence for Crypto in the coming months - assuming some of the macro worries don't materialise.In the chart below, we have overlaid the BTC (blue and white candles) and Gold (pink line) charts. In periods where Gold breaks out to the upside, BTC tends to slow down, either just chopping, or price pulls back. Once Gold has had its breakout and then it either consolidates or pulls back, that's when BTC tends to have its next leg higher. In the chart below, we've highlighted this with the yellow channels - Gold (pink) consolidates or pulls back, whilst BTC runs higher.
BTC and Gold Chart:
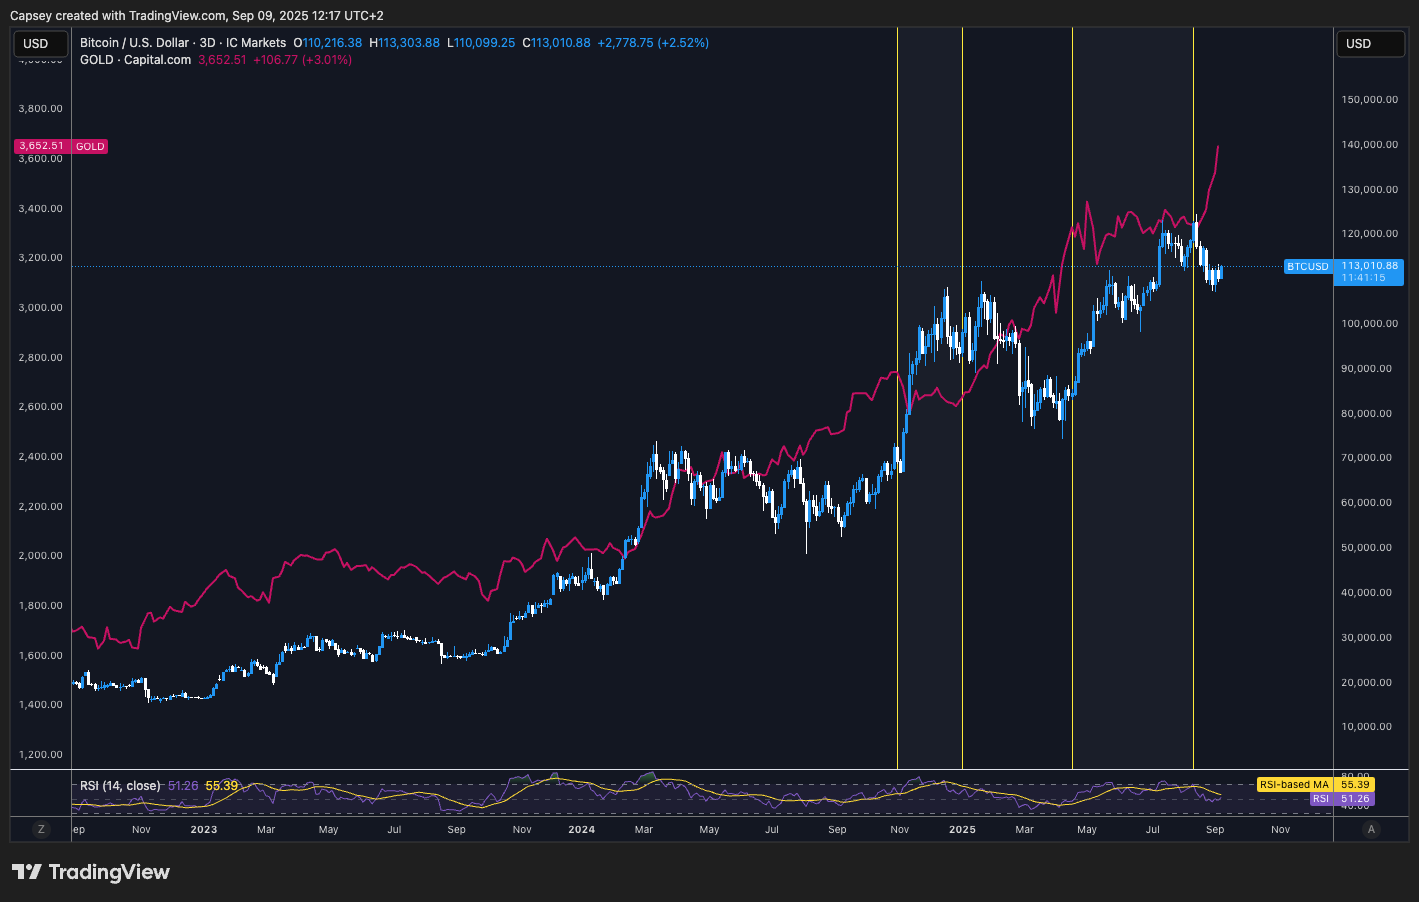
In the chart above, we can see that Gold is now breaking out (pink line moving sharply higher), with Bitcoin having pulled back, whilst Gold has broken out. The signal for us is to watch for when this Gold breakout begins to stall or slow, and that's potentially when BTC can have its next leg higher.
Should we see Gold slow down, and BTC break upwards and convincingly reclaim $117k, we would expect that to ignite an "alt season".
Let's now dive into the Indexes to see how they're setting up and what that might be telling us.
Indexes:
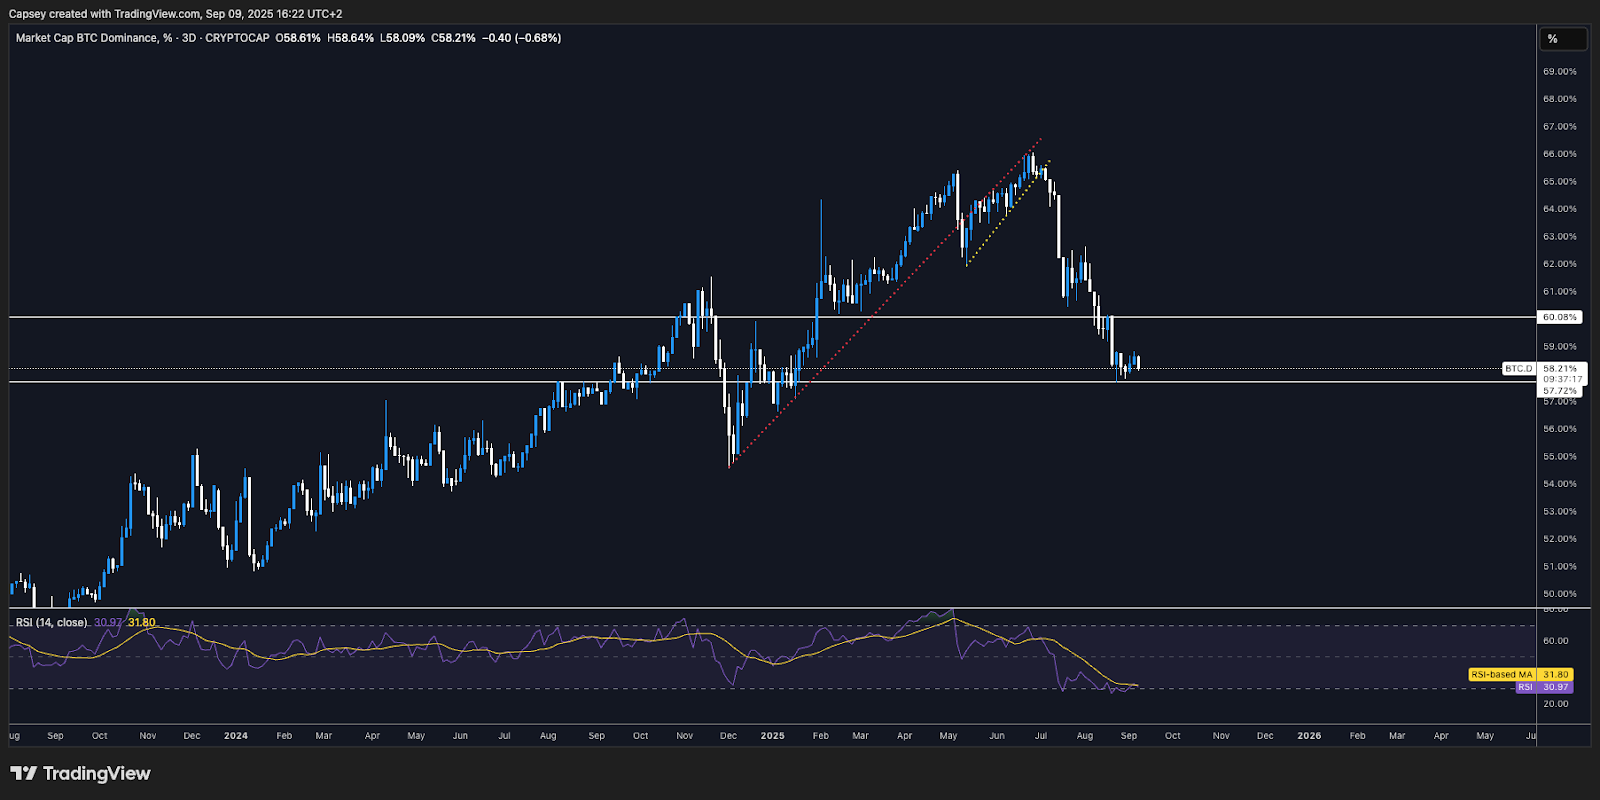
We'll start with BTC.D (Bitcoin Dominance), which is in a clean downtrend, although it has found support at the 58% mark despite forming a bear flag there, which would suggest a further breakdown in this metric. Should BTC.D bounce to 60%, that would probably be the point to bid on Alts/Memes.BTC.D 3D Chart:
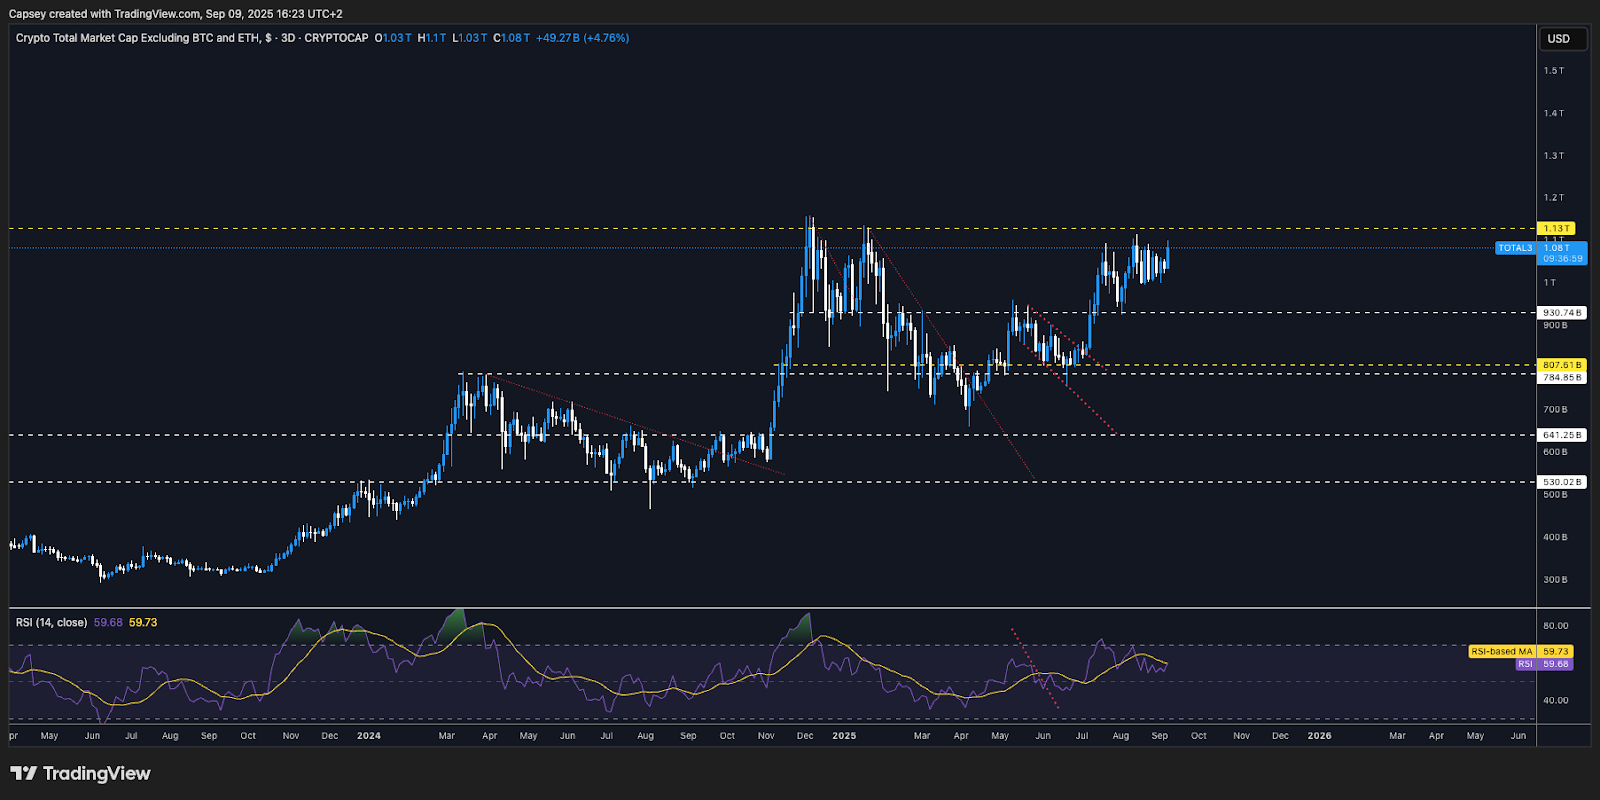
The TOTAL3 (total Crypto market cap excluding BTC and ETH) chart has consolidated at the highs and just shy of a major horizontal resistance at $1.13tn. We would now expect a move up into this resistance, where we'll be watching price action for confirmation of a potential breakout to the upside.
TOTAL3 3D Chart:
If we look at ETH/BTC, however, it is showing signs of stalling, having moved into the horizontal resistance of 0.04 and the RSI having spent 6 weeks in overbought territory.
ETH/BTC 3D Chart:
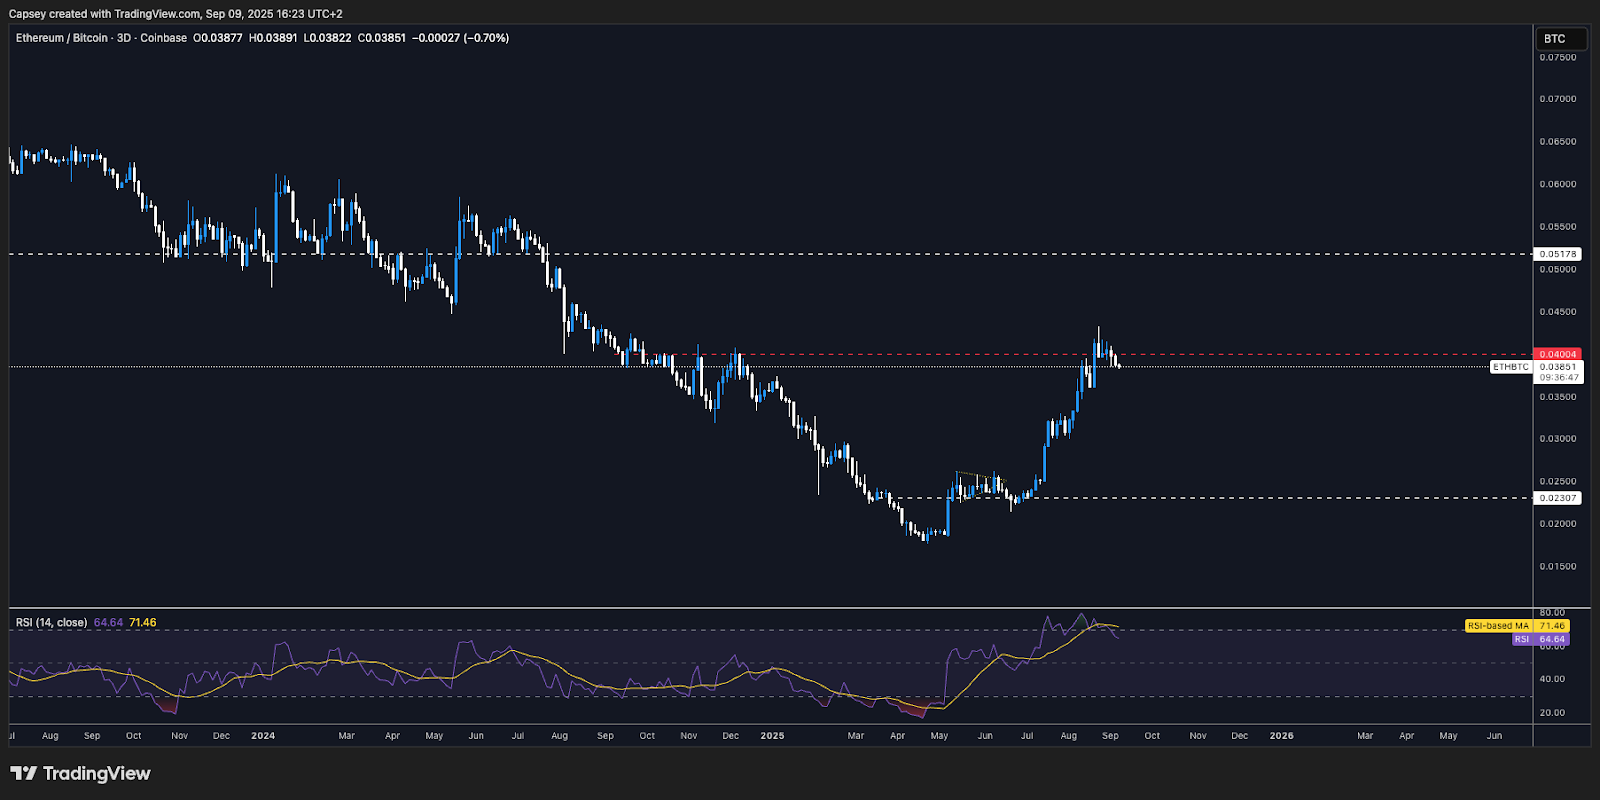
It's therefore possible that if we do see a leg higher, it's not ETH-led and rather led by other Majors such as HYPE and SOL.
Cryptonary's Take:
The market feels jittery ahead of each data print as it seems that the market is fine to continue on higher should the 'Goldilocks' environment remain, but with each data print showing labour market weakness, the market is potentially beginning to question whether the Interest Rate cuts that are coming are good cuts, or bad cuts for risk assets.Scenario 1: Should the data and the FED thread the needle, then we'd expect risk assets to continue moving higher in the short-term.
Scenario 2: Should the data more materially worsen, that's when we'll likely see the market take the upcoming Interest Rate cuts as negative cuts (cuts to stimulate the economy), and that's when risk assets would sell off. However, that would be a buying opportunity as it would reset valuations, and it would precede more FED rate cuts.
For now, we remain risk-on and dip buyers of pullbacks. But we're closely monitoring the macro data as it has the potential to change the short and medium-term outlooks.
Summary and What’s Next:
BTC remains range-bound between $108k-$116k, with $117k as the breakout trigger. ETH is consolidating but losing momentum, while SOL and HYPE show relative strength and may lead the next move. AURA remains in a holding pattern until it reclaims key levels.With the FED now expected to deliver cuts in September, October and December, risk assets stay supported for now, but the setup is fragile if data worsens. Our base case is risk-on with dips being bought, though selectivity matters.
What’s Next:
PPI on Wednesday and CPI on Thursday will be critical. We’ll cover both pre and post, so members stay positioned for the next catalyst.Recommended from Cryptonary


