Save 23% ($351) & Get a Free 1-1 Call with our Team ⏰ : 0d 2h 59m 44s
Market Update: Spotlight Shifts to Fed Cuts and Trade Tensions
Volatility is back with force. A historic $19.5B in liquidations, renewed trade tensions, and shifting Fed expectations all collided to create one of crypto’s most dramatic weeks. This report unpacks the mechanics behind the flush, the macro setup ahead, and how we’re positioning into the next phase.

Disclaimer: This is not financial or investment advice. You are responsible for any capital-related decisions you make, and only you are accountable for the results.
TLDR:
- Record Leverage Flush-Out: $19.5B in liquidations, the biggest in crypto history, wiping 36% of open interest. Damage mostly confined to leveraged traders; BTC spot holders largely intact.
- Technical Sell-Off: Triggered by a Trump tweet escalating US-China tensions during after-hours trading, causing a leverage cascade. Majors dropped ~8–12%, smaller alts 20–30%+.
- Constructive Macro: Fed likely to cut rates in Oct and Dec; lower yields and solid earnings could lift risk assets into year-end.
- Key Watchpoints: Fed guidance, US-China talks, BTC ETF inflows, and Gold’s pace, a slowdown may cue BTC’s next rally.
- Cryptonary’s Take: Stick to quality assets (BTC, ETH, SOL, HYPE, AURA). Keep dip-buying sub-$110k BTC; near-term volatility, but overall bullish into year-end.
Topics covered:
- Breakdown From an On-Chain and Market Mechanics Perspective.
- Technical Sell-Off?
- Is The Macro Still Constructive?
- What We're Now Paying Attention To.
- Cryptonary's Take.
Breakdown From an On-Chain and Market Mechanics Perspective
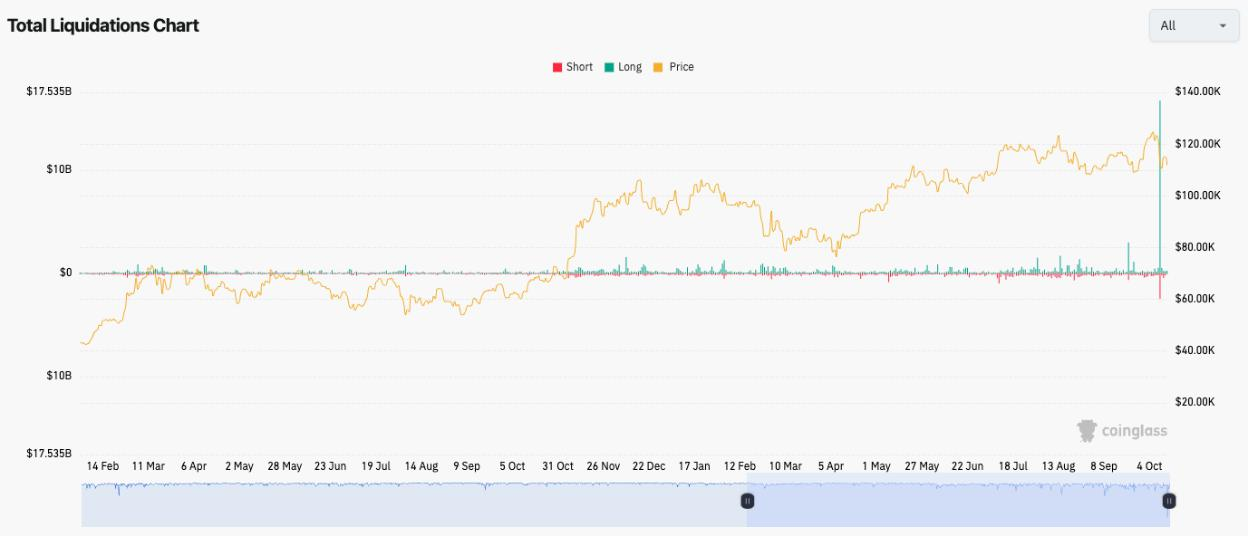
Friday's market-wide wipeout, particularly in the altcoin sector, was the biggest flushout in the history of Crypto. Far bigger than the FTX crash ($1.6b), the Luna crash (3.0b), and the Covid crash ($1.2b), with last Friday seeing $19.5b in liquidations and total losses being estimated as much higher.Total Liquidations
The chart below shows total liquidations as substantially higher than any other prior event going back to the beginning of 2024, with only the mid-2021 liquidation event as a close example.
Chart: Total Liquidations in Crypto
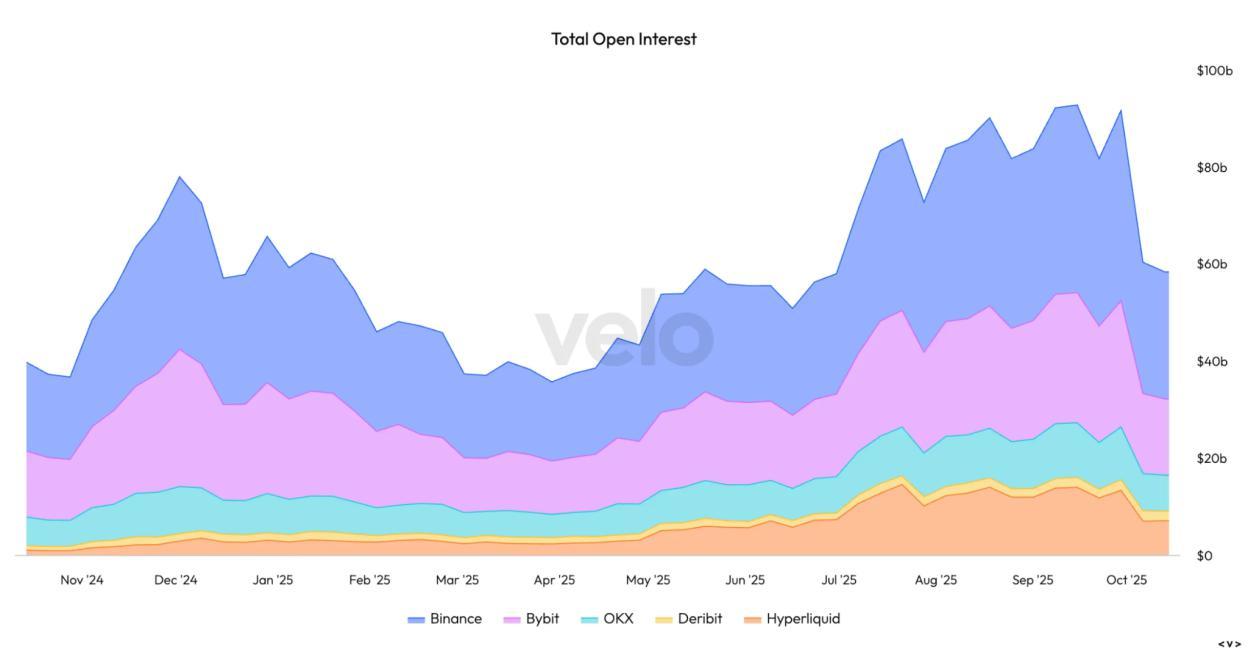
This was reflected in the amount of Open Interest that was wiped out. This is the epitome of a full leverage flush out that fully resets positioning.
Total Open Interest for All Coins
From the end of September to October 14th, Total Open Interest (the amount of leverage in $ terms) decreased from $91.60b, down to $58.34b. This is a 36.31% decrease in Total Open Interest.
Chart: Total Open Interest Decrease
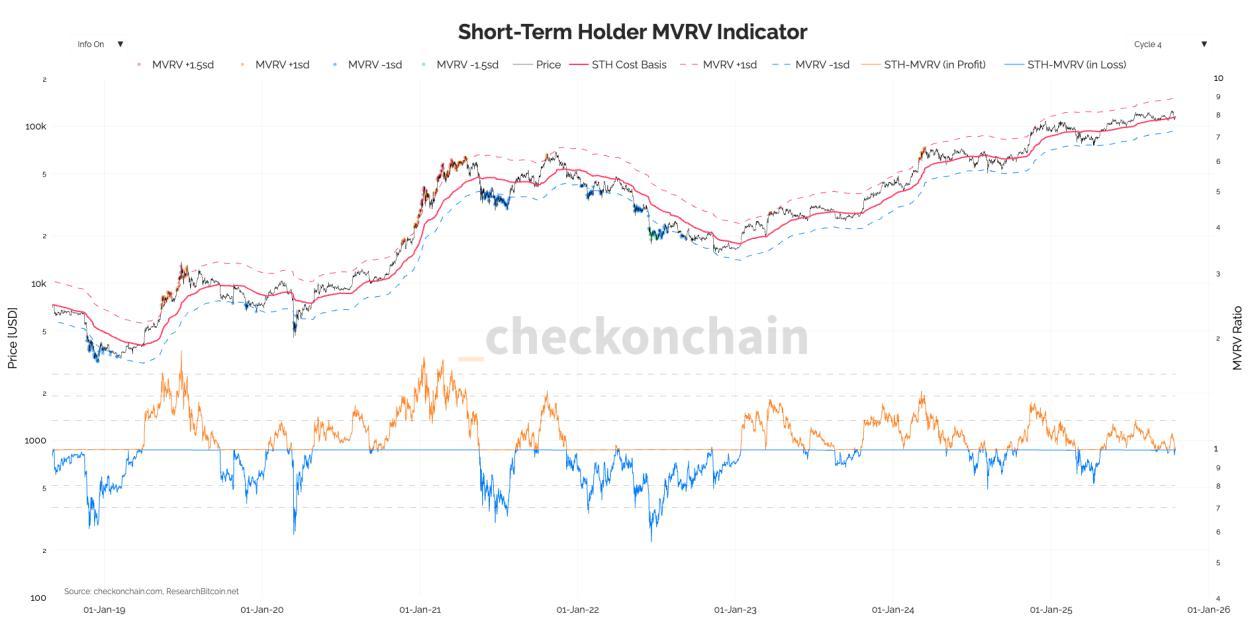
We can see in the above that there was a lot of damage done in the leverage market, but if we look at the damage done from the Spot perspective (excluding altcoins), we can see that the BTC price has returned close to the Short-Term Holder's Cost Basis at $113,800. With price now hovering at $112,000, this puts Short-Term Holders at a small unrealised loss, as we can see on
the chart below. The Short-Term Holder Cost basis has previously been a support level for price, so a retest of that level is fine, but we wouldn’t want to see price sustain below it; otherwise, this might result in future sell pressure should price retest it (the $113,800 level).
Short-Term Holder MVRV Indicator
This metric tracks when Short-Term Holders are in an unrealised profit or loss, with a momentum indicator overlaid.
Chart: Short-Term Holder MVRV Indicator
Technical Sell-Off? A technical sell-off is when prices sell down due to over-extended positioning (in this case, it was too much leverage and too many Longs), and it can be triggered just with a small catalyst. In this case, it was Trump's social post putting further tariffs on China.
When looking at the charts, many of the Majors are just single-digit percentages down from last
Friday's open:
- BTC is down 8.38% from Friday's open.
- ETH is down 8.65% from Friday's open.
- SOL is down 11.70% from Friday's open.
- HYPE is down 11.66% from Friday's open.
- PUMP is down 31.51% from Friday's open.
- XRP is down 13.39% from Friday's open.
- SPX is down 19.67% from Friday's open.
- FARTCOIN is down 37.87% from Friday's open.
Friday's sell-off, you could argue, was much more of a 'technicals' sell-off, meaning the dip-buying opportunity should have been taken (and even arguably now on the retest lower following the mean reversion move higher post price drop).
It remains our view that the dip-buying opportunities should stay in the quality names; the Majors (BTC, ETH, SOL, HYPE) and quality memes (AURA).
Is The Macro Still Constructive?
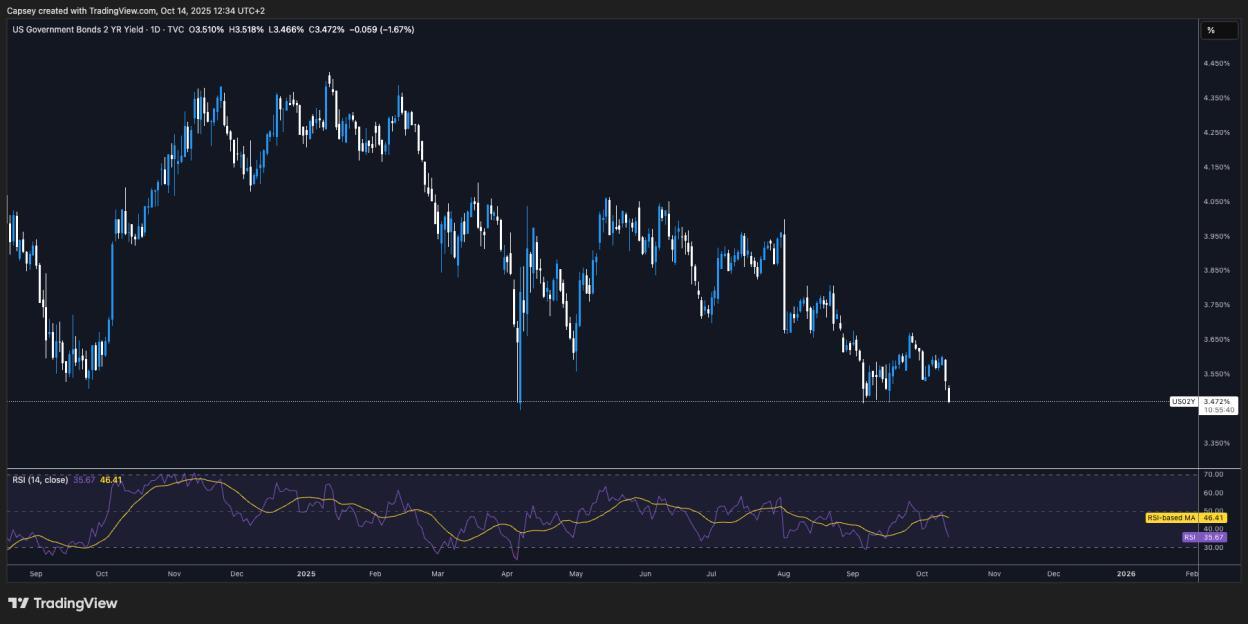
In September, the Fed began cutting interest rates again, and the markets are pricing for more cuts at October's (97.8% likelihood) and December's (94.7% likelihood) Fed Meetings. This has been echoed in the recent Fed speak, with members identifying increasing risks in the labour market and therefore the need to lower rates. Historically, rate cuts have been supportive for risk assets to move higher. This has been reflected in lower Yields with the US2Y Yield now breaking down to range lows.US2Y Yield 1D Chart:
Front-end Yields dropping is the market pricing in for lower rates i.e, Fed cuts.
Chart: US2Y Yield 1D Chart
Another key component of the macro setup is the renewed trade war tensions. However, markets will look at this in the expectation that a deal will be reached, as high tariffs do not favour either side (the US or China). It's expected a deal will be reached before the November 1st deadline, but we might be in for a choppy next 1-2 weeks as both sides "flex their muscles" before negotiation. We’ve seen this today, with China raising fees on US vessels. As a result, Equity markets have pulled back slightly, although we do expect this to be shaken off over the coming days, and for markets to recover.
The Nasdaq and S&P are down on the day. However, the Russell 2000 is up. That tells us that the trade war tensions are now impacting Mag7 stocks more in comparison to the wider market. The Russell 2000 being up on the day suggests to us that the trade war tensions should be looked through.
In the coming weeks, we also have a Corporate Earnings season (companies releasing their Earnings). They'll likely be positive, and this can help TradFi markets to continue to move higher off the back of it as corporate stock buybacks kick in again.
Should we see a new trade deal reached (we expect one to be reached) between the US and China, and we see a positive corporate earnings season over the coming weeks, this would likely provide the right environment for risk assets to move higher from late October going into year-end.
If we don’t get a trade deal agreement between the US and China, that would result in a more drastic sell-off, and we would go into risk-off mode. However, we see this as very unlikely, and hence we’re not positioning for it.
What We're Now Paying Attention To
Going forward, we're continuing to pay attention to the above: Fed speak (for further views on the rate cutting path), corporate earnings and trade war negotiations.Alongside the above, we'll be closely watching BTC ETF flows and Gold.
ETF Flows:
In the first two weeks of October, BTC bounced from $109k to $126k, which was supported by large ETF inflows. Following last Friday's leverage flush-out, we'd hope to see TradFi participants become more confident that the leverage flush-out event has now happened, and that this might entice more inflows into the BTC ETF. Should we see this, this would be a risk-on signal for us, as it would show a constructive TradFi bid post an event which saw more retail Crypto natives be flushed-out.
BTC ETF Flows:
Chart: BTC ETF Flows

Gold and BTC
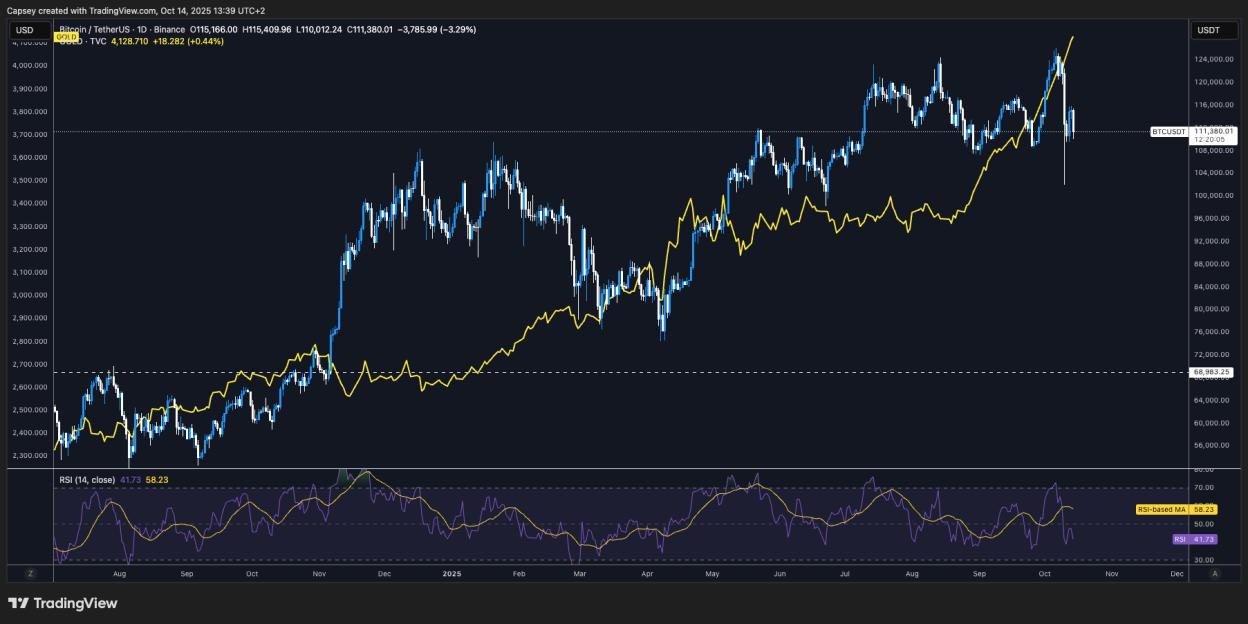
If we then also turn to Gold, we can see that it briefly consolidated in early to mid-September, before breaking out to new highs again. Note that in early-to-mid September, when Gold consolidated, BTC broke out from $108k to $117k. Should Gold slow down and consolidate, this would be a signal to us that the baton might be passed from Gold to BTC, and that's when BTC might have a more sustained breakout of all-time highs. But for now, whilst Gold is running, BTC is likely to just remain range-bound, meaning the strategy continues to be a 'dip-buying' one at range lows. For us, that's anything sub $110k.
In the chart below, we can see that Gold (yellow line) increased from the summer of 2024 until the end of October 2024, whilst BTC chopped between $54k and $69k. Gold then peaked on October 30th 2024, and remained range-bound until January 27th 2025. In this chop period for Gold, BTC ran $69k to $109k.
Gold has been on a grind higher from January 27th until today, with the last 2 months being the most notable rally, with Gold going from $3,300 to $4,100. But notice, between late-April 2025 and late-August 2025, Gold consolidated between $3,200 and $3,400. In this period, BTC moved off its local bottom of $76k and moved up to a local high of $123k.
As stated above, Gold has been on a 2-month tear upwards from $3,400 up to now $4,100. We expect that when Gold slows down and consolidates for a period, that's when we'd expect BTC to start its next leg higher and outperform.
BTC Overlapped with Gold 1D Chart:
Cryptonary's Take
From looking at Friday's sell-off from a deeper perspective, we can determine that it was 'technicals' driven, i.e., too much leverage that cascaded into thinner order books in after-hours trading. As a result, we've seen the Majors bounce back, but remain below Friday's open, with the altcoin market being hit the hardest.Market participants will now closely watch the developing tensions between the Trump and President Xi Administrations, so we'd expect volatility, but for a deal to eventually be reached between now and the November 1st deadline. We expect markets to shake off today’s negative price action as the Chinese raise docking fees on US vessels - a tit-for-tat escalation that is typical pre-negotiation.
Last week was a lesson to use little to no leverage and to just hold/trade quality assets.
It's our view that the macro backdrop remains constructive as we're in the early innings of a small interest rate-cutting cycle that should last for a few more quarters. This is constructive for BTC, particularly when you pair this with the breakout we're seeing in Gold, which BTC usually lags. We expect BTC to have its upside breakout when Gold slows down and consolidates.
For the reasons above, we remain positioned but in quality assets, and we're maintaining the dip-buying approach to this market, but again, just for quality assets. In the immediate and short-term, we expect further volatility as trade tensions play out, but for the market to continue moving higher once it's on the other side of the trade tensions and the upcoming corporate earnings season.
We remain confident that the BTC high for the year isn't yet in. Should we be right on this, we'd expect quality alts/memes to follow, hence we remain in ‘dip-buying’ mode to our high conviction assets.
Peace!
Recommended from Cryptonary


