Save 23% ($351) & Get a Free 1-1 Call with our Team ⏰ : 0d 2h 59m 44s

Disclaimer: This is not financial or investment advice. You are responsible for any capital-related decisions you make, and only you are accountable for the results.
TLDR:
- US–China trade; talks improving; easing tensions support market upside.
- Repo markets; show tighter liquidity but signs of stabilisation.
- Fed; expected to cut rates at both October and December meetings.
- Bitcoin; testing key resistance around $111K; pullbacks near $105K seen as buy zones.
- Outlook: Macro backdrop remains constructive; Cryptonary expects new BTC highs in Q4 2025.
Topics covered:
- Key Macro Topics We're Paying Attention to This Week.
- Friday's Macro Data and What It Means for Fed Cuts.
- Crypto Moving into Technical Resistances.
- Cryptonary's Take.
Key Macro Topics We're Paying Attention to This Week
Two key topics we're paying attention to this week are the trade tensions between the US and China, and if there are any further stresses in repo markets - this would be seen in increased repo rates.US-China Trade Tensions
Trade tensions have cooled over the last week with more constructive comments coming out of both administrations as negotiations continue this week in Malaysia between Vice Premier, He Lifeng and Treasury Secretary Scott Bessent. We’ve seen Trump say “I think we will be fine with China, the US wants to help China, not hurt it”. Alongside this, we’ve seen Chinese officials urge the US to “demonstrate sincerity in trade discussions”. This is a call from the Chinese for both parties to meet each other half way.The market expectation is for a deal to be reached that ultimately ends up in lower tariff rates, and we continue to believe that any escalatory talk out of either administration that sends the market lower, should be seen as a buying opportunity.
In short:
- Higher tariffs = market potentially sells off.
- Lower tariff = market likely moves higher.
Increased Funding Rates in Repo Markets
In the last few weeks, we've seen big increases in the rates in repo markets, which suggests that the overall level of liquidity in these markets is less ample than initially thought. However, following positive earnings out of regional lenders towards the back end of last week, credit fears in the market have eased.The market will continue to monitor substantial increases in repo rates, and should we see it, then expect further selloffs in risk assets. Should we see rates stabilise this week, that would give us more confidence that this isn't a wider issue that would result in us leading to more risk-off in our positioning.
Friday's Macro Data and What It Means for Fed Cuts
With the US government still shut down, we're still trading blind from a macro data perspective, particularly as we still haven't received labour market data, and we don't expect to receive it before the next Fed Meeting on October 29th.However, this Friday, we will get inflation data.
Expectations are for the Core measures to come in slightly softer than last month, and for the Headline numbers to come in slightly higher than last month's numbers. Ultimately, we don't expect that these numbers change much for the Fed, unless the numbers come in substantially to the upside, which we're not expecting.
The current focus for the Fed and therefore markets, is the labour market data, as that has been materially weakening over recent months, and therefore it's our view that the Fed continue to cut rates at both the October 29th Fed Meeting, and at the December Meeting.
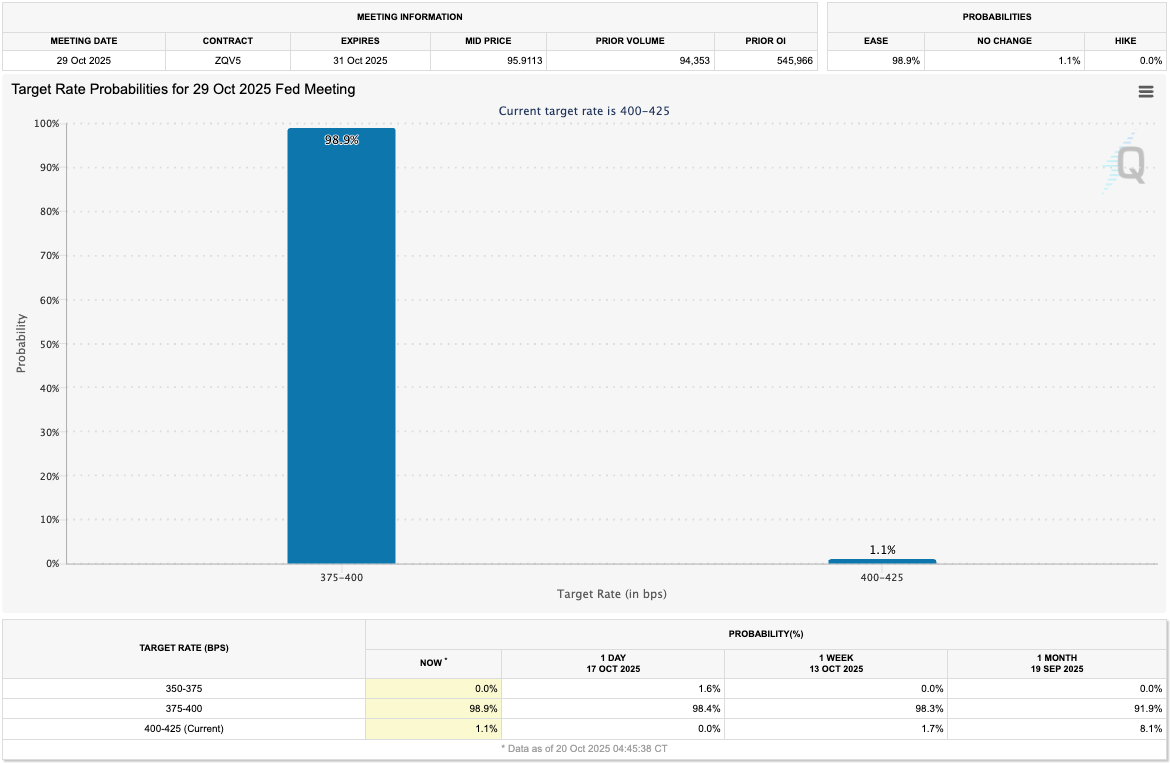
The market is currently pricing a 98.9% chance that the Fed cuts on October 29th, and a 96.1% chance that they cut again in December. Note: for December's Meeting, there is a 2.8% chance that the Fed cuts by 50bps, and only a 1.1% chance that the Fed doesn't cut at all in December.
It's overwhelmingly likely that the Fed cut at both remaining Meetings in 2025. Should these cuts begin to be priced out by the market, that would result in a market pull back. But to be clear, we’re not expecting this.
We will cover the inflation data in greater detail with two Market Pulse's on Thursday (pre-data) and Friday (post-data).
Target Rate Probabilities for 29th October Fed Meeting:
Crypto Moving into Technical Resistances
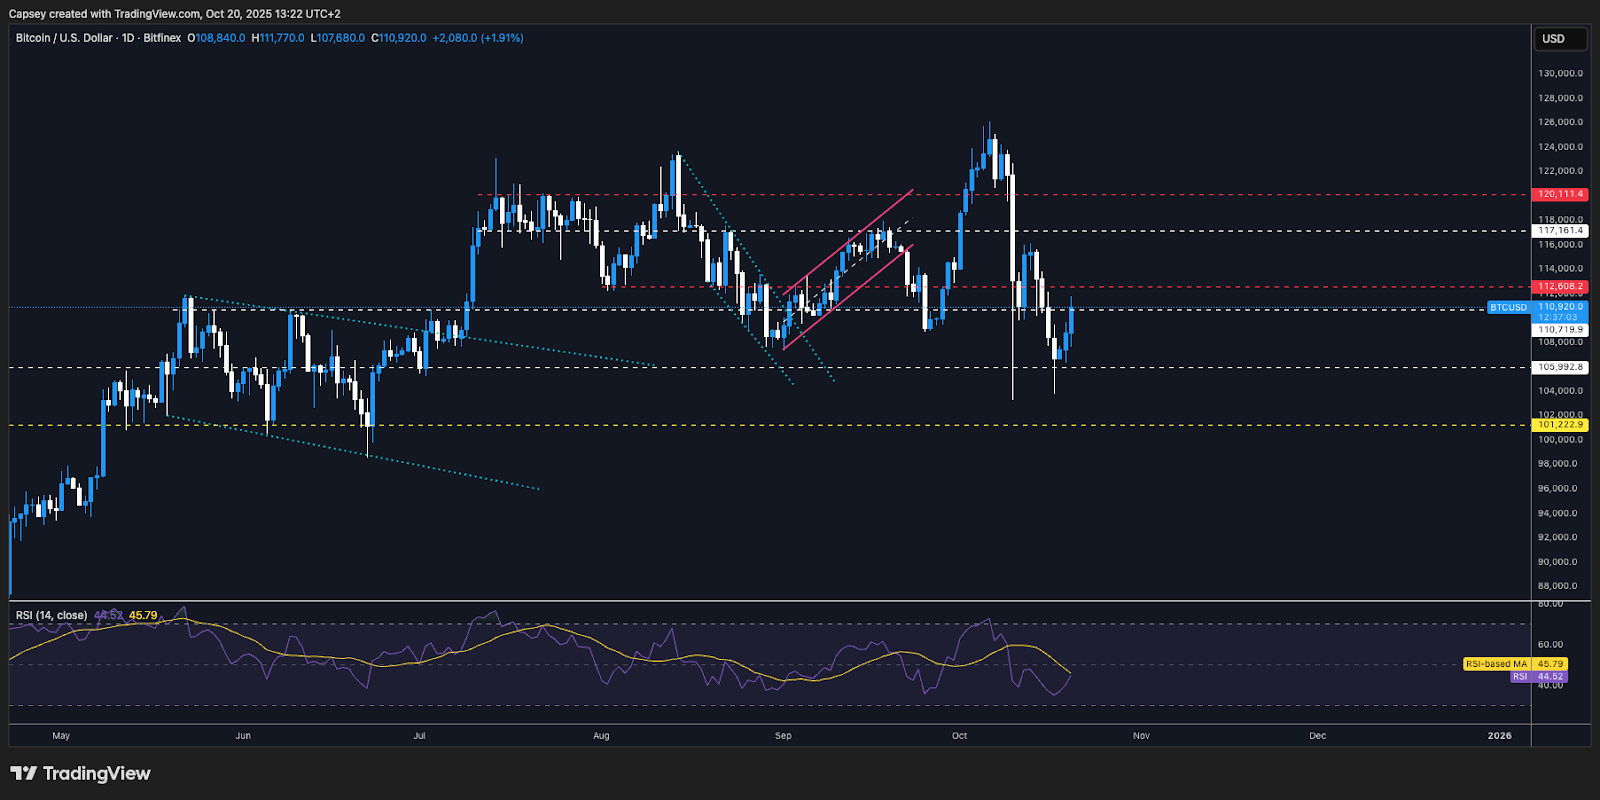
Bitcoin has bounced off the $106k horizontal support having retested the 10/10/2025 wick that went into $103,300. Price has since pushed higher into the key resistance area between $110,600 - $112,600. This area will be key for price to overcome, with a convincing close above $112,600 potentially being the bullish signal for the rest of the market that a BTC low is in. The reason we saw 'potentially' is that the Short-Term Holder Cost Basis lies at $113,800. This is a key on-chain level that would need to be flipped.However, should BTC reject into this resistance zone ($110,600-$112,600), then we'd expect a move back into the $107k level, which would be an area we'd bid considering the $106k level has held so far (a key technical level on the chart). Should we see a breakdown below $107k, we'd now look to more aggressively bid $101k into $107k. The reason we've upped our buy zones from the $90k's into the $100k's is because we've seen the low $100k's hold so far, even though sentiment has been in the gutter, plus we've also seen a substantial leverage flush-out just 10 days ago that has significantly reset positioning. These are more bullish developments.
BTC 1D Timeframe: BTC entering the resistance zone between $110,600 and $112,600.
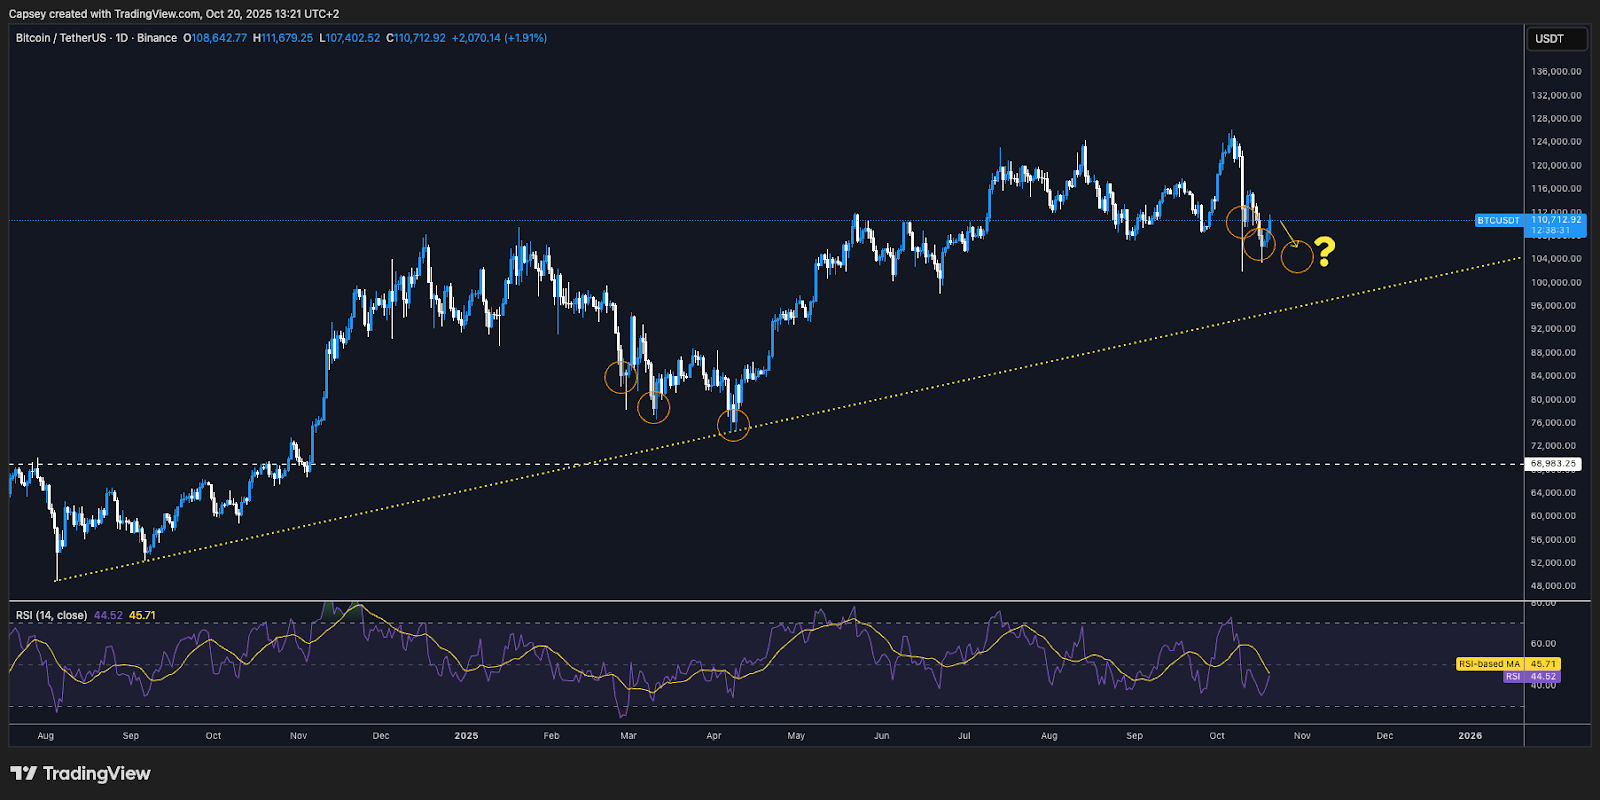
One idea we're considering for BTC is a small pullback here into the $105k-$108k region that fills the third orange circle. This bottoming formation would be eerily like the "tariff tantrum bottom" that we saw form in March of this year. It would see BTC put in lower lows whilst forming a bullish divergence that could then be the catalyst that gives BTC its next leg higher.
BTC Possible Bottoming Formation?
Fear & Greed Index: This shows that sentiment has been poor in the last week. In bull markets, low sentiment readings have historically been good buying opportunities.

Cryptonary's Take
The macro backdrop is constructive for Crypto to move higher in the coming months, with further rate cuts on the horizon. However, we will need to see Big Tech earnings continue to come in positively (most Big Tech reports Earnings next week), trade war tensions to progressive positively, and for the Fed to continue cutting rates. Alongside this, we have an eye on the credit market which has recently seen some stresses as seen in spiking repo rates, but these concerns can be abated should we see repo rates come back down.BTC has impressively defended the low $100k's following a violent leverage flush-out just 10 days ago and a strong bearish sentiment that has followed. If you then pair this with the "4-year cyclers" calling "it's over" because BTC was down 17% from its highs, you have a real positioning resetting. This can pave the way for the next move up, but a more sustainable and healthier move higher.
Despite the whip-sawing market, we believe that we remain in a bull market going into 2026, and that we see new highs for BTC in Q4 2025.
Peace!
Recommended from Cryptonary


