Save 23% ($351) & Get a Free 1-1 Call with our Team ⏰ : 0d 2h 59m 43s

Disclaimer: This is not financial or investment advice. You are responsible for any capital-related decisions you make, and only you are accountable for the results.
Topics covered:
- Data This Week.
- Re-Pricing of Rate Cuts due to Soft Labour Data.
- End of the BTC Bull Trend?
- Cryptonary's Take.
TLDR
- Rate cuts repriced: Markets now see a 79.5% chance of a September cut after weak jobs data.
- Labour weakness: Major downward revisions signal deeper job market issues.
- FED concerns: Trump’s actions raise doubts about central bank independence.
- BTC dip healthy: Pullback to $114k seen as a buying opportunity, not a trend break.
- Still bullish: Cryptonary expects more cuts ahead, supporting risk assets.
Data This Week:
This week, there isn't much significant economic data that comes out, with the only stand out being ISM Services on Tuesday.However, we do get a plethora of FED speak this week, which the markets will pay closer attention to following the much weaker jobs report we got last Friday, which resulted in a drastic re-pricing of rates. We'll be watching FED speakers closely for any comments that suggests that more FED members are more onboard for a September rate cut now that the labour market data suggests a greater weakening than previously thought.
Re-Pricing of Rate Cuts:
Markets were whip-sawed last week off the back of a more hawkish Powell (than markets expected), for the market to then whip back the other way following a weak jobs report on the Friday.
On Wednesday, we saw a more hawkish Powell indicate that a September Interest Rate cut wasn't too likely due to 'elevated inflation' and no real signs of weakness in the labour market. This resulted in the market pricing a September cut at 45%, down from 59%. Markets sold off slightly on this, but they recovered the sell-off in the same session.
However, then Friday's jobs data came out. The Unemployment Rate remained unchanged at 4.2%, although it was very close to rounding up to 4.3%, whilst the number of jobs added was weak at 73k. But the real weakness was in the revisions. Junes' payrolls were revised down to 14k (having printed at 147k), and Julys' payrolls were revised down to 19k (having printed at 144k). These are wild revisions. These are forecasts for -258k jobs less than what was initially reported, and it indicates that the labour market is much weaker than previously anticipated. The reason the Unemployment Rate hasn't substantially risen yet is because the supply of labour is shrinking (likely due to immigration policies). Again, this would emphasise that a tightening of the labour market is perhaps worse than initially thought.
This jobs report really changed the outlook on the labour market, and therefore the path for rates. On a side note, President Trump was so angry with this level of revisions that he sacked the Head of the Bureau of Labour Statistics, which just shook markets further as it throws FED independence into more doubt.
Before the labour market data release, the market was pricing for a 45% chance of an Interest Rate cut in September, following the data, the market is now pricing a 79.5% chance of a cut. This is a huge swing, and it was reflected in markets.
Target Rate Probabilities for September FED Meeting:
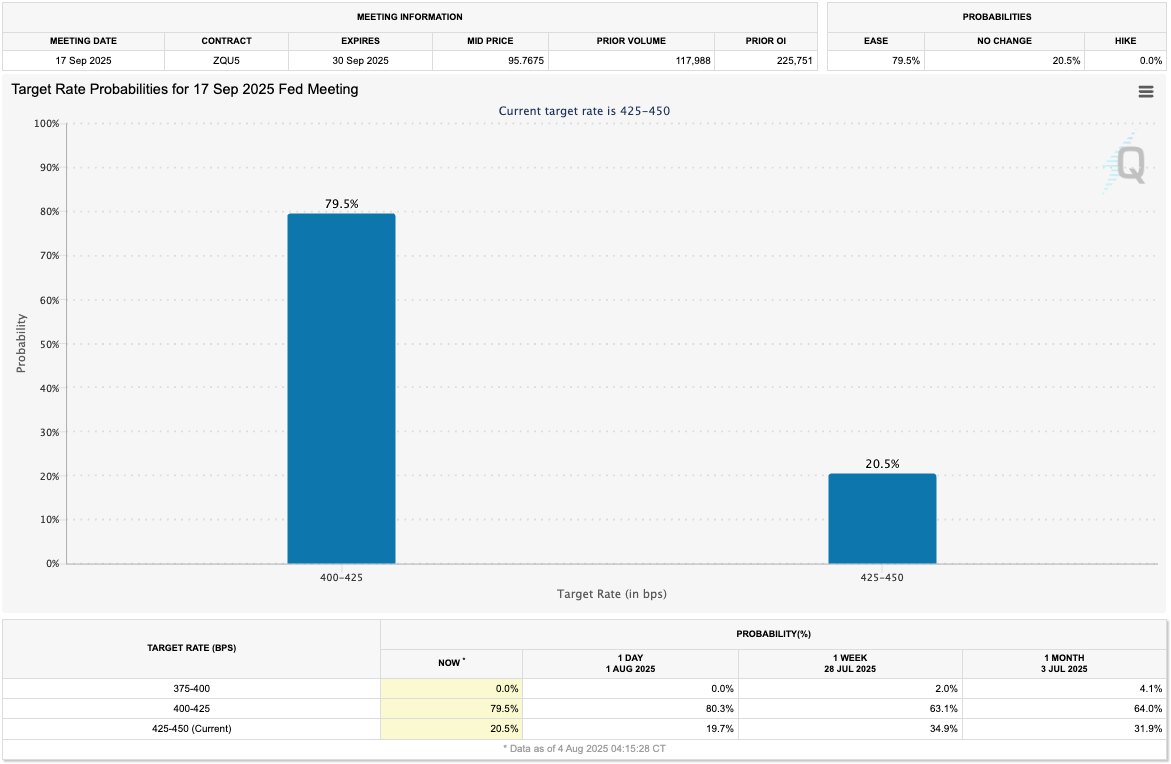
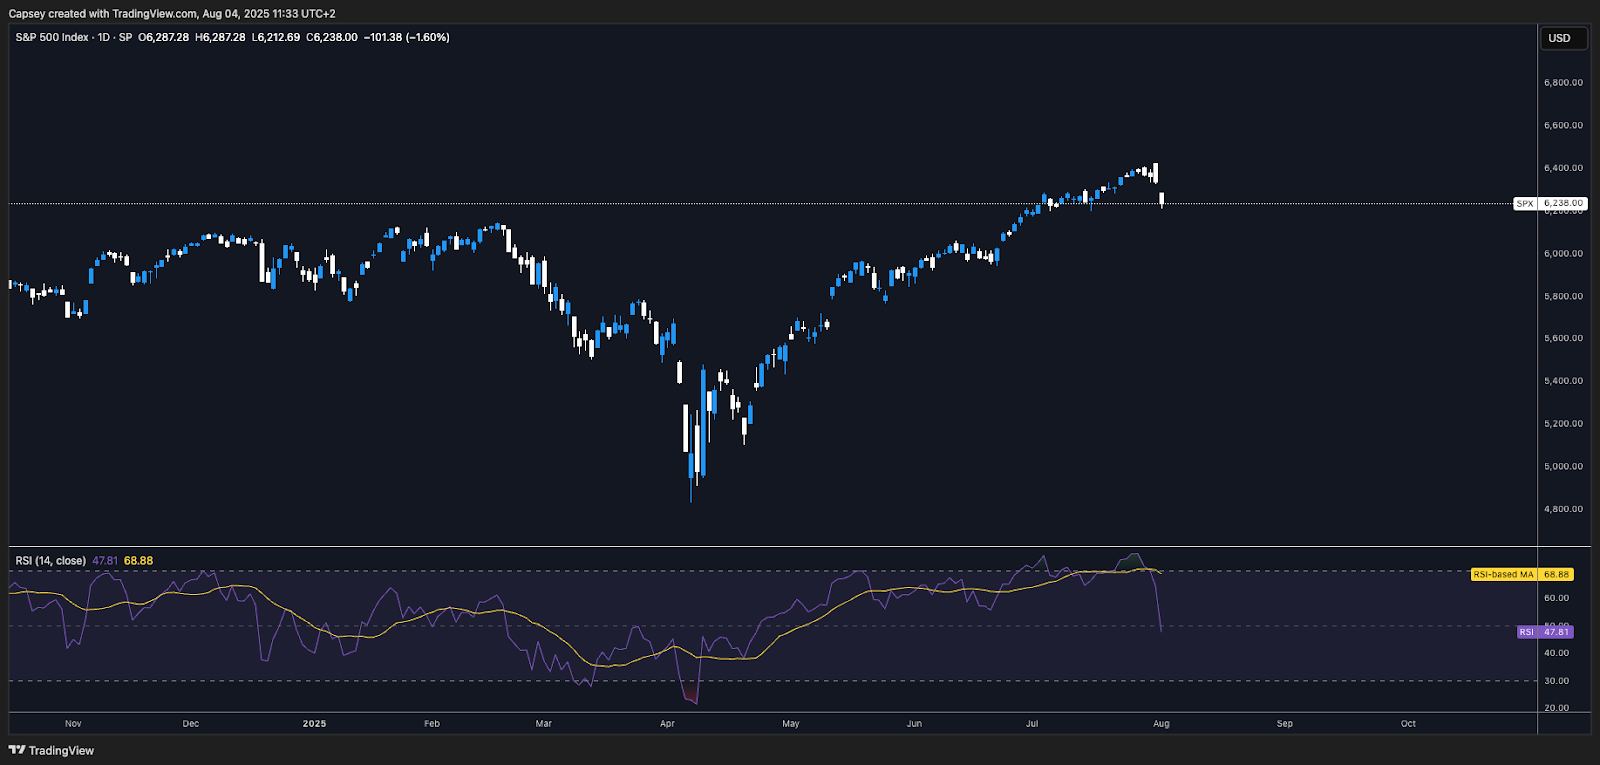
Risk assets (the S&P, Nasdaq, and Crypto) all sold off on the prospect of a much weaker labour market, despite a cut for September now being more priced in. But the sell-off in risk likely came because it increases the potential that the FED might now be behind the curve.
However, this sell-off in risk assets also wasn't helped by the resignation of FED Governor Kugler. This resignation essentially means that President Trump can assign someone new to the FED, and potentially just place in this seat, his next FED Chair. This again raises concerns around FED independence, aiding the sell-off in risk assets further.
S&P 1D Chart:
The US2Y Yield was very telling in that we saw a strong reaction with the Yield falling 33bps. This is a huge move for a single session, with this single day’s trading session undoing all of July's gains. This move is a clear signal to the FED that the market is now expecting an Interest Rate cut in September, and likely another 2 more cuts in 2025 (at the October and December Meetings) due to a labour market that is much weaker than expected.
US2Y Bond Yield 1D Chart:
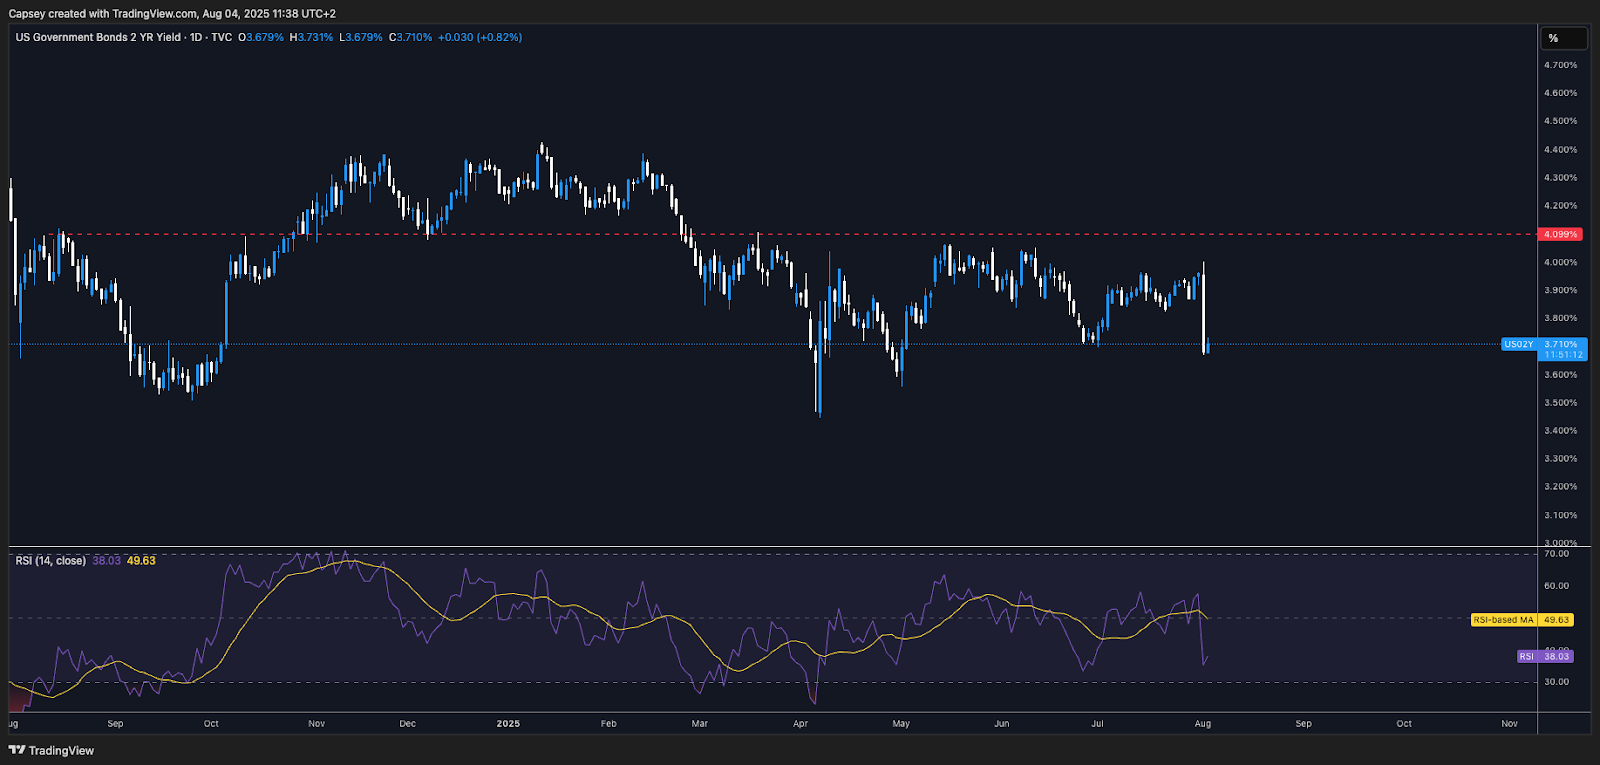
The market is now also looking at the fact that there is another labour market print in early September, before the next FED Meeting in mid-September. Should that also be "bad" (weaker numbers), then the market will lock in multiple cuts for 2025.
This now also makes Jackson Hole (August 21-23rd) interesting, as it's possible Powell addresses these revisions in the labour market, and he might be more dovish in his tone in signalling that a September cut is now likely.
We'll now move onto the BTC price pull back and what the on-chain data is telling us.
End of the BTC Bull Trend?
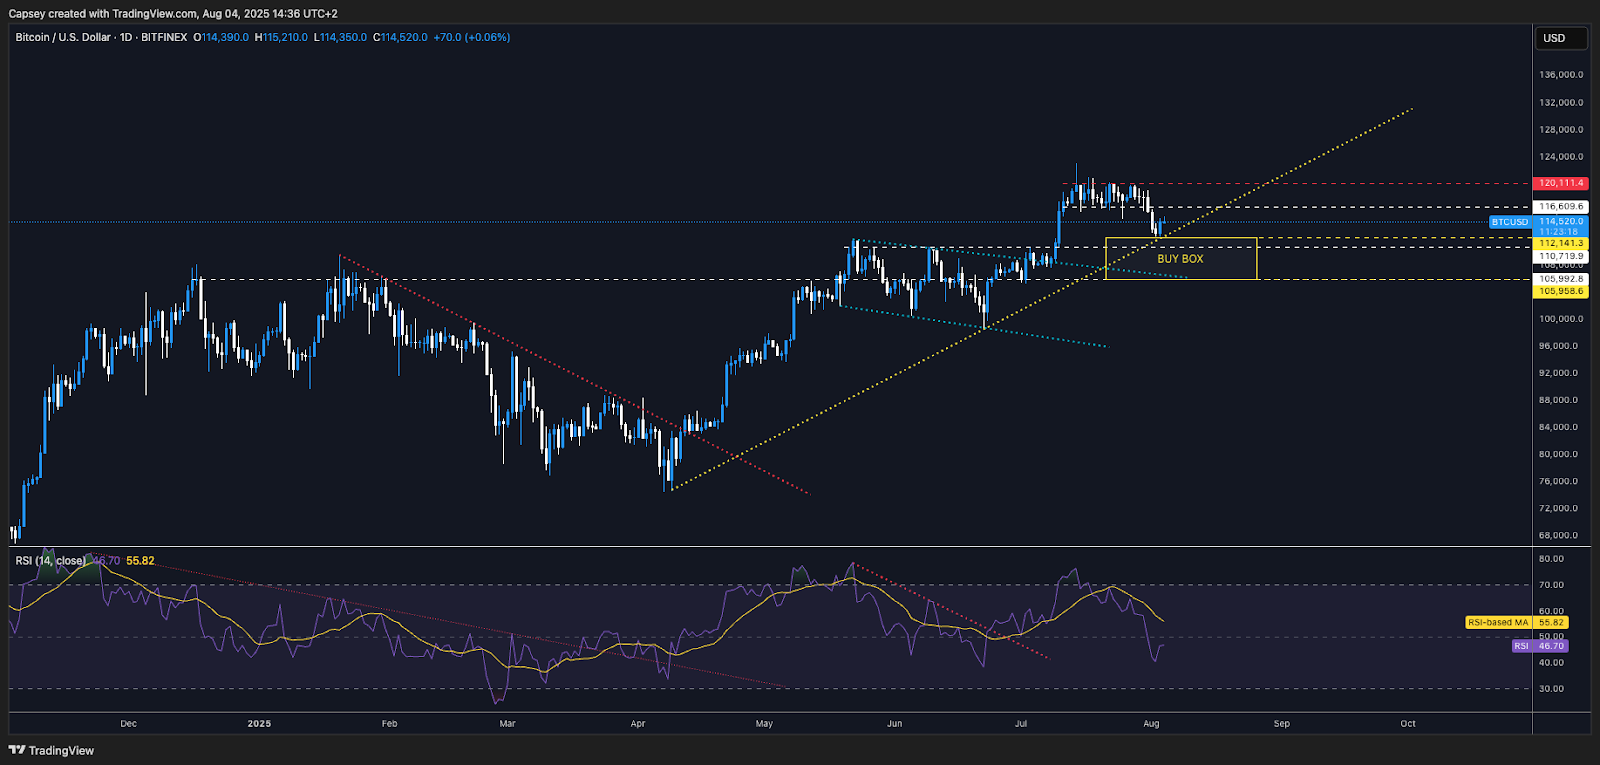
BTC broke up to new all-time highs into the mid-$120k's and price has since pulled back to retest the breakout level, $112k. When assessing these moves just simply from an on-chain perspective, we look at whether this is a breakdown of the bull trend or if it's just a retest of the breakout level. To assess this, there are a few metrics we can look at.
Firstly, we can look to see if the market (and specifically the short-term holders) is in a large unrealised loss, which might indicate that these losses will be realised and create further sell pressure. The chart below shows that Short-Term Holder Unrealised Profit/Loss is still positive, although it’s approaching the 0 line, which typically acts as support. This doesn't suggest that the market is at any real risk of seller capitulation, which could then drive price meaningfully lower.
Short-Term Holder Unrealised Profit/Loss:
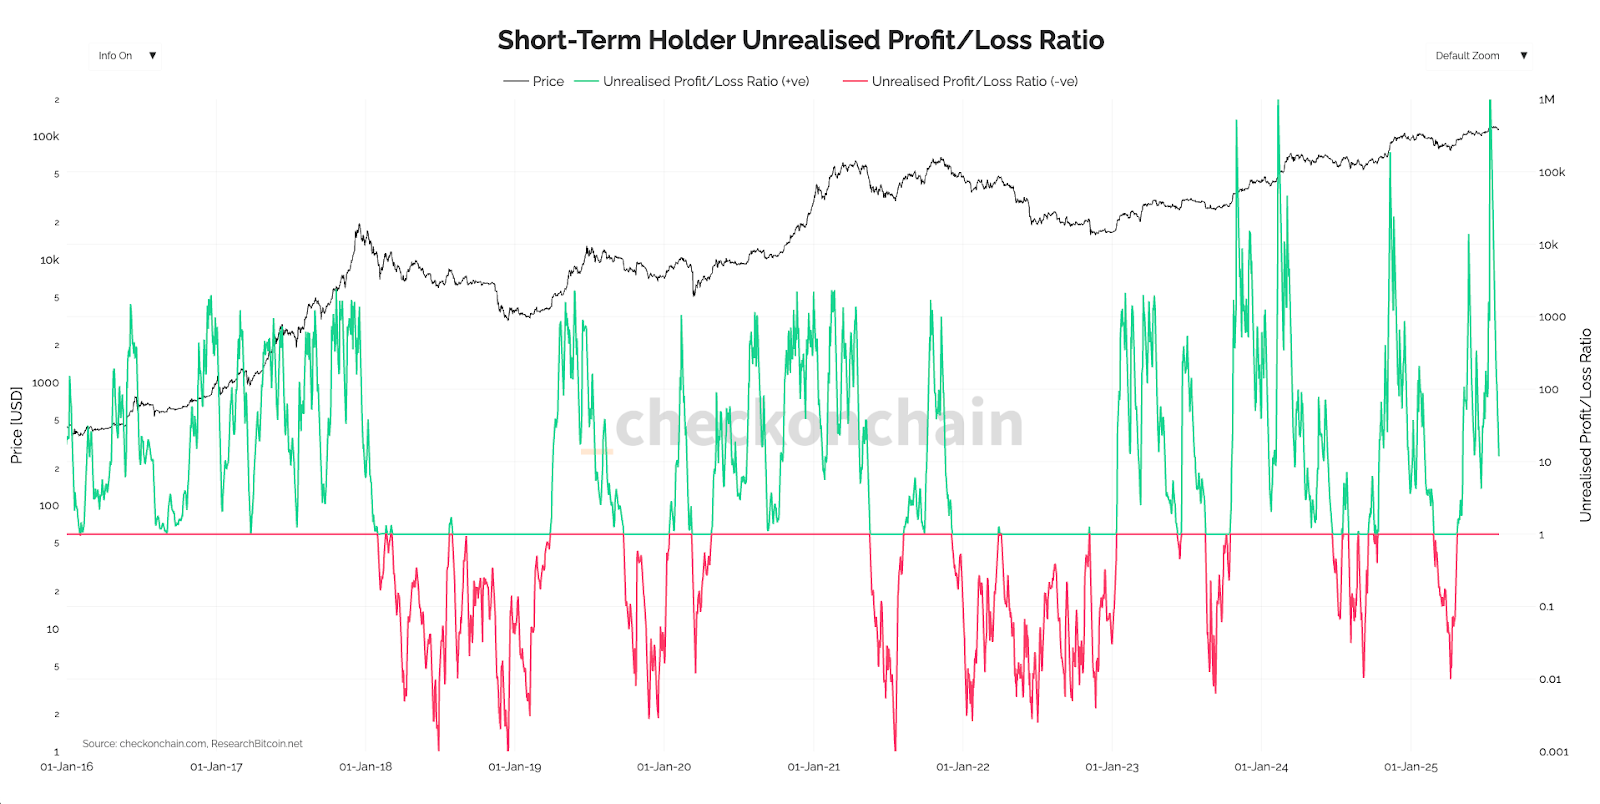
However, it is possible that price can pull back more from the current $114k level and remain bullish. We have technical levels between $110k-$112k, whilst the Short-Term Holder Cost Basis sits at $106,000, so we'd expect $106k-$112k to be a strong zone of support. We don't expect $106k to be tested but should price dip into the $106k-$112k zone, then we'd be aggressive buyers of BTC in that zone.
Short-Term Holder MVRV Z-Score:
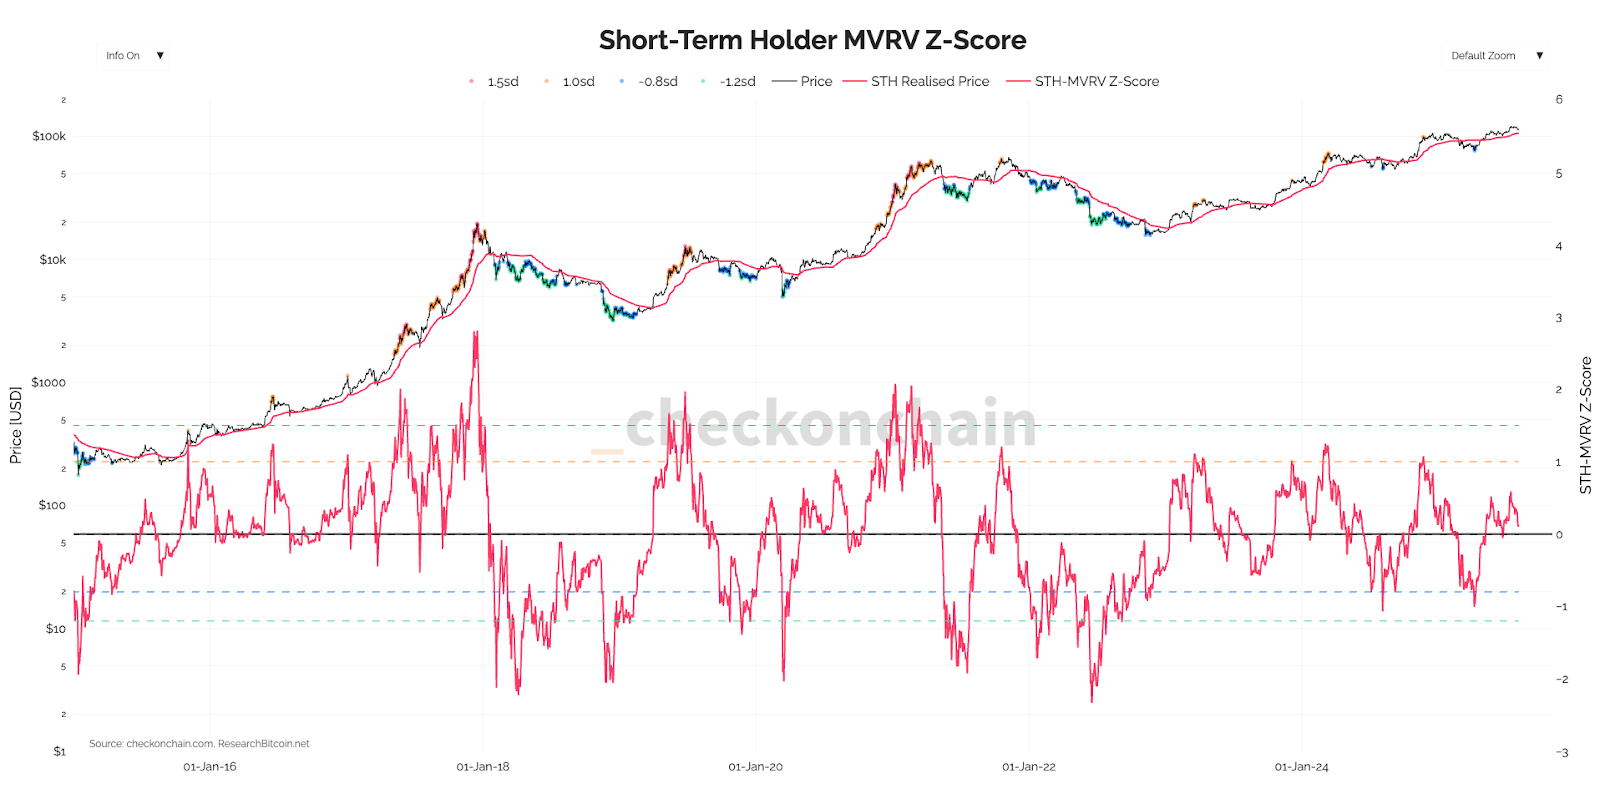
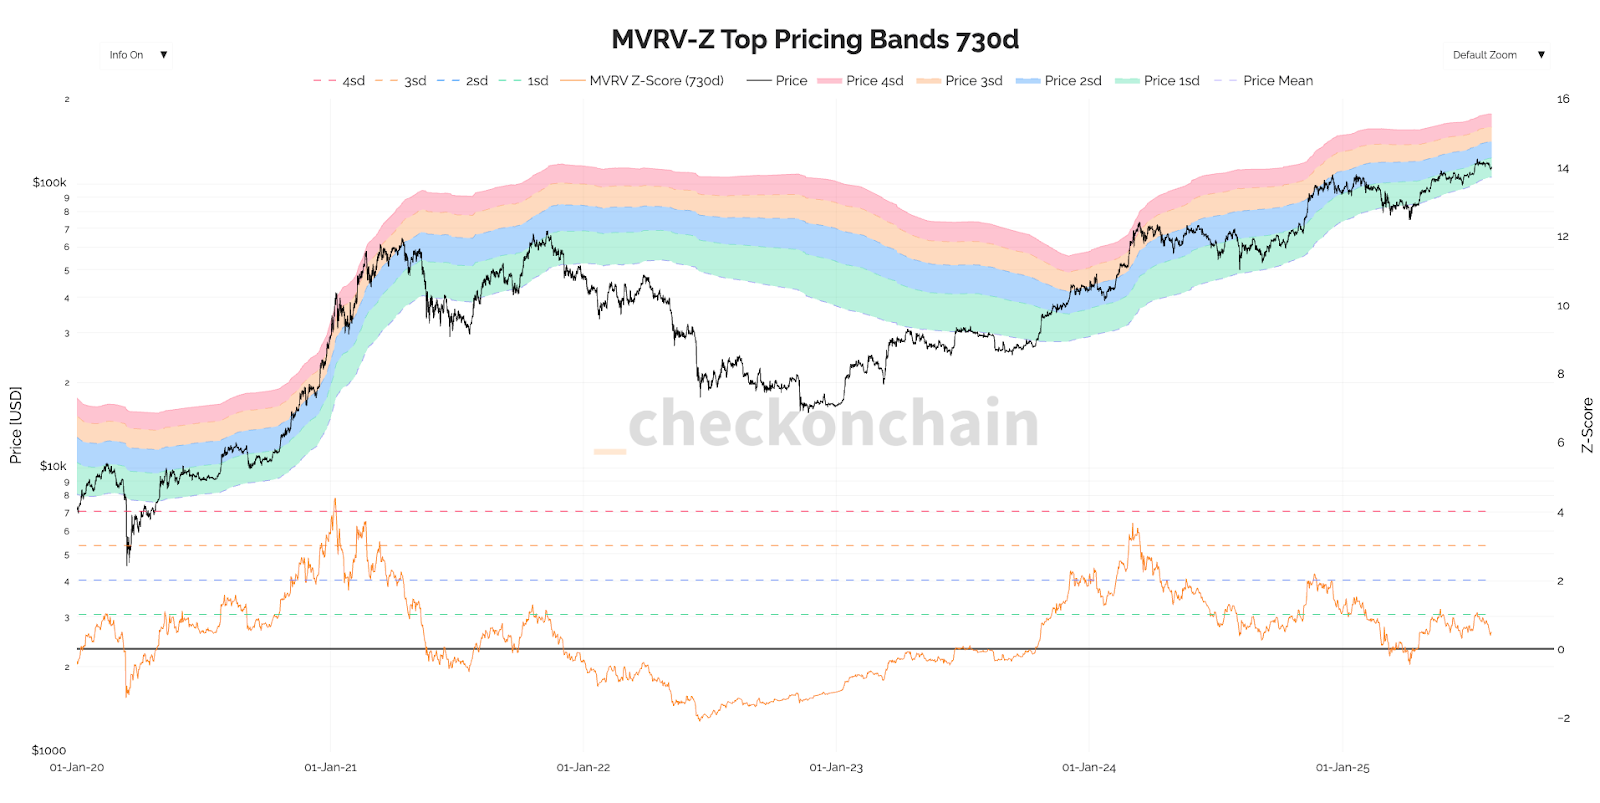
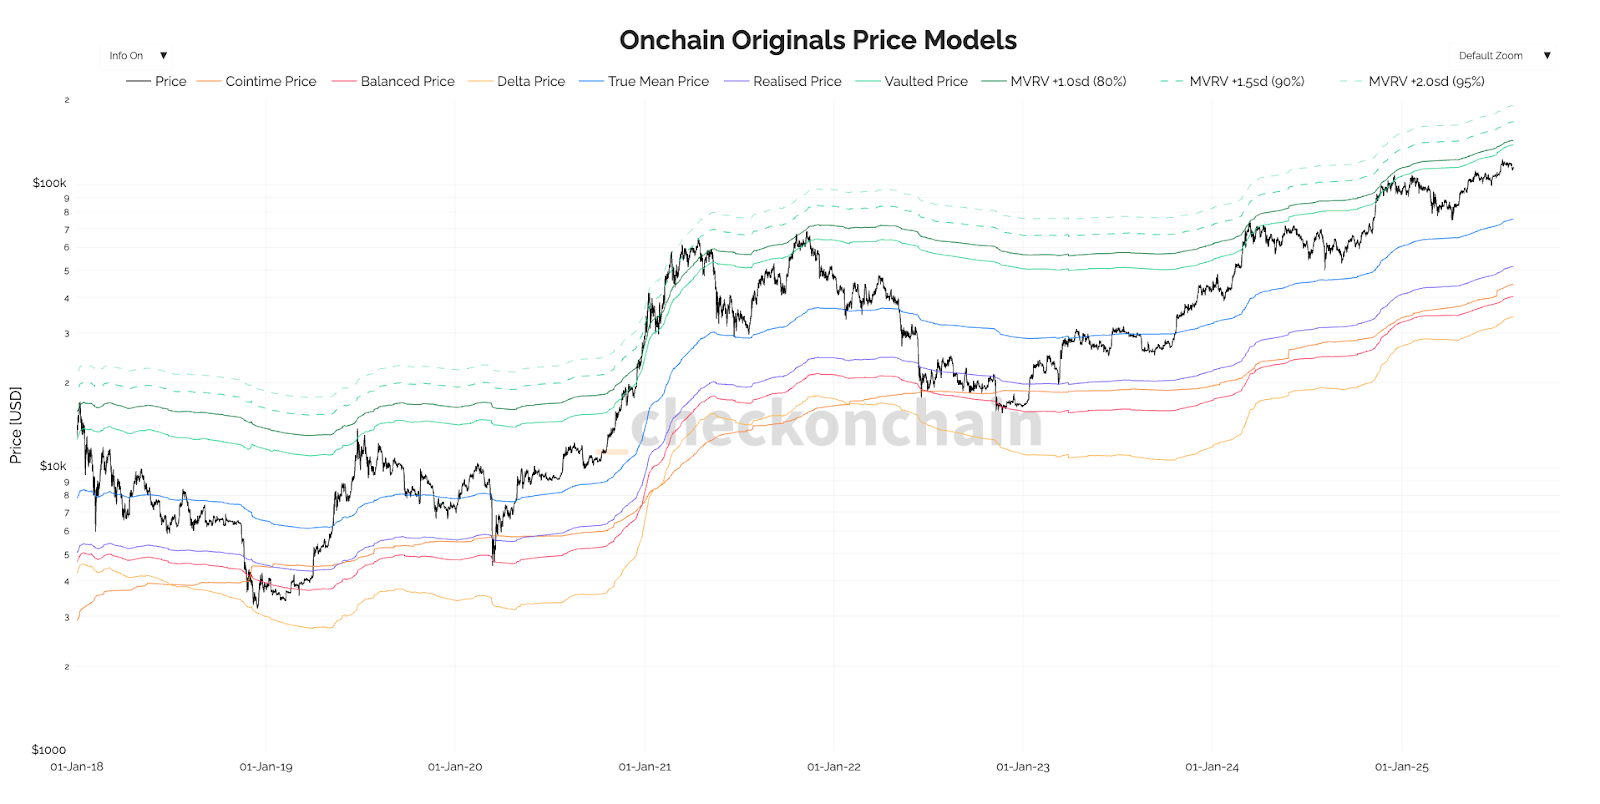
It is also the case that when BTC was in the $120k's that it wasn't overheated. Just because BTC runs into new all-time highs, doesn't mean that it prints into overheated territory on the pricing and valuation models. For instance, the MVRV Z-Score Top Pricing Bands remain in the +1 standard deviation territory. Another model is the Onchain Originals which shows the Vaulted Price up at $138k.
If the Bitcoin price is between $110k-$120k, it isn't close to overheated levels on the onchain and valuation models that we look at. This is healthy and from an on-chain perspective, it suggests that the current price dip is just that, a dip, a pullback in a larger bull market.
Should price get into overheated levels ($120k-$135k isn't that), and the macro begins to change (say away from rate cuts and into a new tightening cycle) then that's when we'd be more inclined to be of the view that we'll see a larger pull back/next bear market. But the current setup isn't that, it's a pullback in a larger bull market and therefore dips should be bought.
MVRV Z-Score Top Pricing Bands:
Onchain Originals Price Models:
Cryptonary's Take:
Despite macro noise, we see this pullback as healthy and we believe August offers strong accumulation opportunites. Last week was chaotic for markets having to digest a lot of data and whip-sawing price action as a September rate cut was priced for less than 50%, to then being priced back to an 80% likelihood.The market is now likely to be more cautious going into mid-September (the next FED Meeting), particularly as seasonality throughout August and September isn't great for risk assets. This might mean that risk assets chop around for the next 3-4 weeks (August), but that also potentially provides a great dip buying opportunity.
It's our base case that we remain in a bull market as it's likely that we see another 75-150bps of Interest Rate cuts over the next 12 months, which will fuel risk assets (Crypto) to new highs. The risk to this is that we see inflation meaningfully move higher (maybe due to tariffs) and that prevents the FED from cutting rates. But again, that isn't our base case, nor do we see it as likely.
Should BTC revisit $110k-$112k, we'd be buyers. Should it revisit $106k-$110k, we'd be aggressive buyers, with a view to holding the positions for the next 12 months.
BTC:
Recommended from Cryptonary


