Save 23% ($351) & Get a Free 1-1 Call with our Team ⏰ : 0d 2h 59m 45s
Market Update: Will Bitcoin Follow Gold and US Equities into Price Discovery?
Gold and equities are already in price discovery, yet Bitcoin lingers just below resistance. The question now is, will BTC follow them higher, or is crypto signalling caution? With a government shutdown looming and the Fed under pressure to cut, this week could decide whether Bitcoin joins the party or tests our patience a little longer.

Topics Covered
- U.S. Government Shutdown
- Fed Cuts
- Gold’s Rally & M2 Growth
- State of the Market (BTC Perspective)
- Cryptonary’s Take
Disclaimer: This is not financial or investment advice. You are responsible for any capital-related decisions you make, and only you are accountable for the results.
U.S. Government Shutdown
As of October 10th, 2025, the U.S. federal government remains shut down after failing to pass a funding bill. The Senate adjourned without breaking the deadlock, pushing the shutdown into its second week.The biggest problem right now? A data blackout. With federal agencies frozen, key releases on employment, inflation, and GDP are delayed, leaving the Fed, markets, and traders flying blind.
Despite that, markets are showing surprising resilience. Since the shutdown began, the S&P 500 is up +0.76% and the Nasdaq +1.80%, suggesting investors are holding their ground rather than panicking.
For context, the last U.S. government shutdown, under President Trump from December 22, 2018, to January 25, 2019 - lasted 35 days, the longest in history.
These events bring plenty of political noise, but historically, markets stay largely flat during the turmoil.
Interestingly, on a 12-month view, shutdowns have actually been bullish, with the S&P 500 up an average of +12.7% roughly 86% of the time after such periods.
Market Impact of U.S. Government Shutdown:

Impact on Fed Rate Cut Odds?
The ongoing U.S. government shutdown raises an important question: could it alter the Federal Reserve’s path of rate cuts?In September 2025, the Fed made its first cut of the cycle, trimming rates by 25 basis points to support slowing growth and ease inflation pressures. But with the shutdown stalling key economic data releases, policymakers are flying with limited visibility. If the impasse continues, the lack of fresh data could force the Fed to pause or move more cautiously on future cuts.
So, what are markets pricing in?
Prediction markets show little change since the shutdown began. For the October meeting, the market agrees on a 25 Bps cut with 91% odds. For the upcoming FOMC meeting on December 10, 2025, Polymarket data shows a 71% chance of a 25 bps cut and a 22% chance of no change.
Fed Rate Cut Odds – Polymarket:
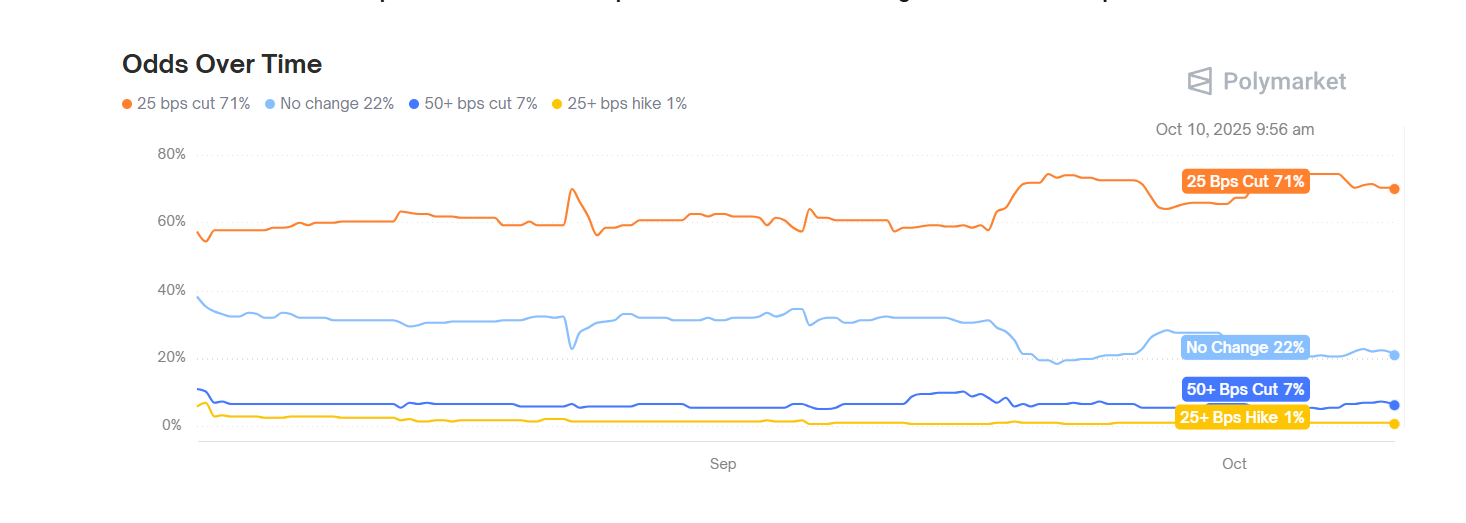
Interestingly, Fed rate-cut odds have stayed mostly unchanged despite the ongoing shutdown, which matters greatly for liquidity conditions. Since monetary policy directly shapes M2 growth and the amount of liquidity in the system, current expectations for future cuts imply that liquidity expansion over the next 6 to 12 months remains on track.
That’s important for risk assets like Bitcoin and crypto, which historically perform well during periods of looser monetary policy and rising liquidity.
In short, while political noise dominates the headlines, the fiscal and monetary backdrop still supports Bitcoin’s medium-term outlook. Overall, for now the market seems to price two more 25Bps Rates Cut by year’s end, one in October and a second in December.
Is Gold’s Historic Run Fueled by Global Liquidity Expansion ?
While Bitcoin stands to gain from easier liquidity conditions, gold remains the first stop for excess capital. It is the market’s primary liquidity sponge, absorbing inflows when real rates decline and money supply accelerates.Historically, when central banks loosen policy and liquidity expands, gold attracts that early flow as investors seek a stable store of value before capital rotates into equities and crypto. Gold often leads liquidity cycles, serving as the early signal of renewed monetary expansion.
For us in crypto, this relationship matters. History gives us a clue: when gold pushes into new highs, Bitcoin often follows within 7–10 weeks. The current gold fractal, with about a 70-day lead, shows a strong correlation that points toward a major Bitcoin breakout by November, driven by growing liquidity and M2 expansion.
Gold and Bitcoin Correlation vs. Liquidity:

And what about M2? Similar to the relation Gold-Bitcoin, we have Bitcoin and M2 delayed by about 10 weeks which have a strong correlation.
Bitcoin vs. M2 Global 10-Week Lag:
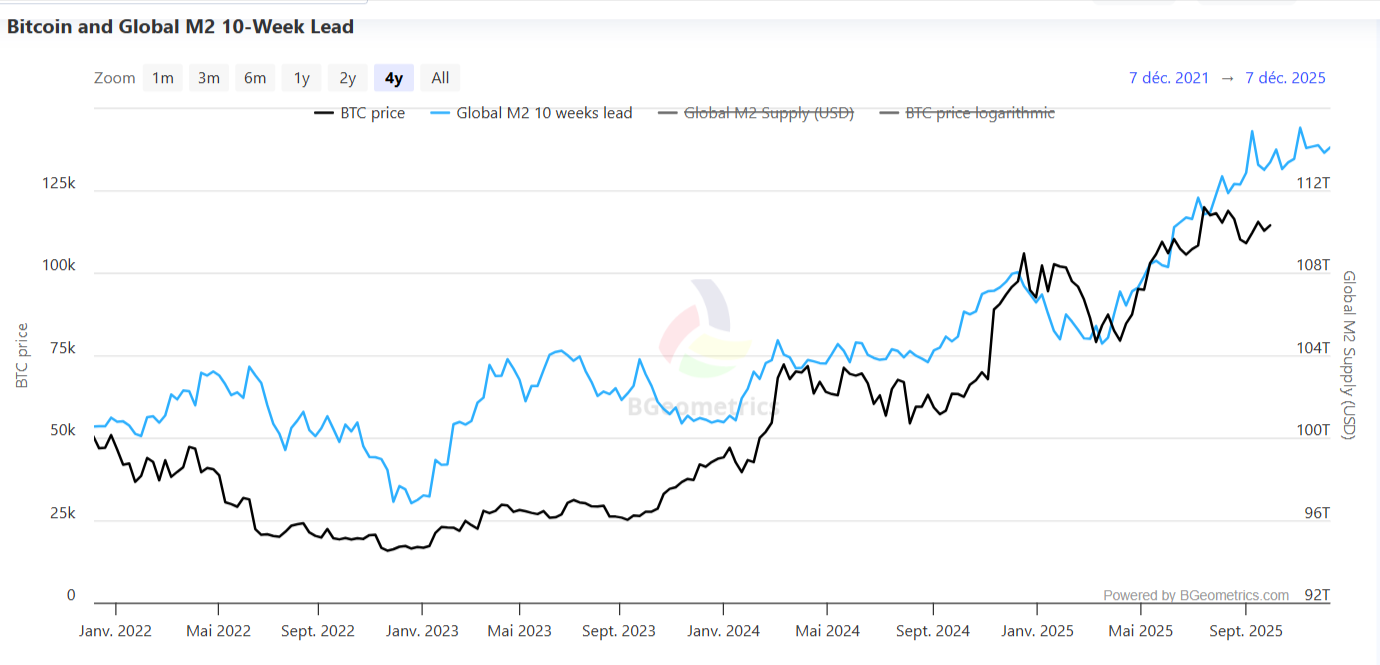
All of this data points to gold as the primary and faster liquidity sponge, with Bitcoin following roughly 7 to 10 weeks later.
Gold broke out with conviction around August 28th, which gives a projected Bitcoin breakout window between October 16th and November 6th if the historical pattern holds.
Current State of the Market: BTC Perspective
After a brief rejection at its all-time high earlier this week, BTC is pressing on $119k support. Hold here, and the door opens for $126k and beyond. Lose it, and we likely revisit $114–115k before the next leg higher. The roadmap is clear, patience is key. Yesterday, price dipped to $119,600, testing the lower range before recovering to around $121,400. The next few days of price action will be crucial in confirming whether this zone can hold as firm support.Market leverage remains healthy and not overheated, with funding rates at 5.23% annualized.
It’s worth noting that BTC is only about 3.5% below its all-time high. A market that isn’t overly leveraged while sitting this close to record levels often sets the stage for a potential breakout, especially if momentum builds and FOMO kicks in.
BTC Price and Funding Rates Overview:

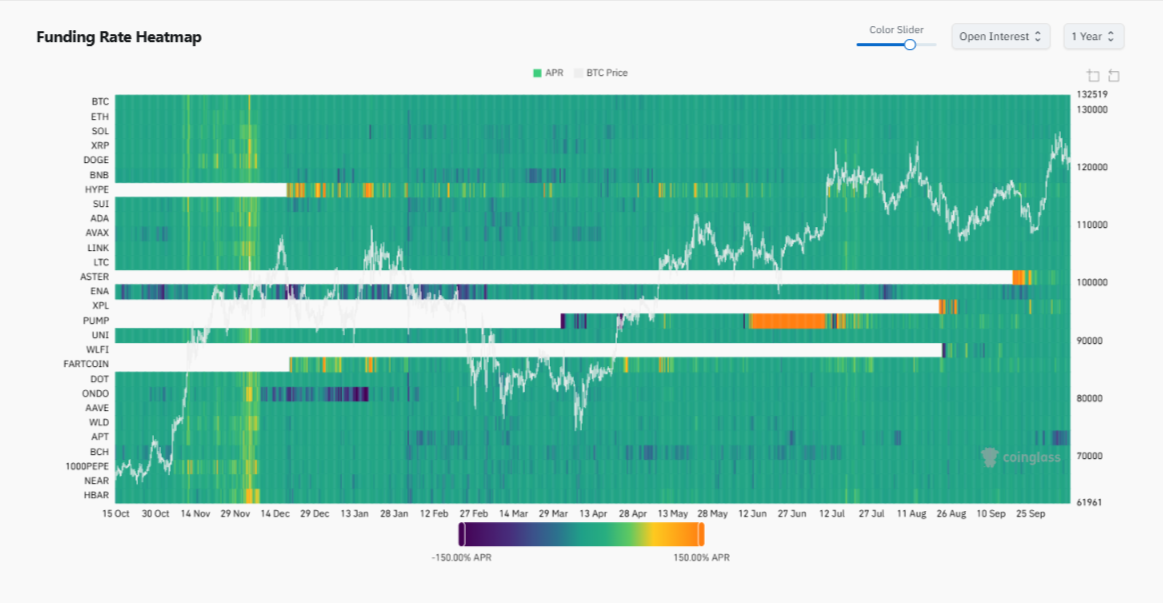
Even on the Altcoins side of the market, there are no signs of froth according to the Funding Rate Heatmap. With Altcoin Funding Rates around the baseline, a breakout would take the entire crypto market by surprise.
This isn’t the kind of signature you usually find at macro tops, you are looking for froth, overleverage, and APR (Annualized Percentage Rates) going above 40% in the yellow zone, as shown for example in December 2024.
Altcoin Funding Rate Heatmap:
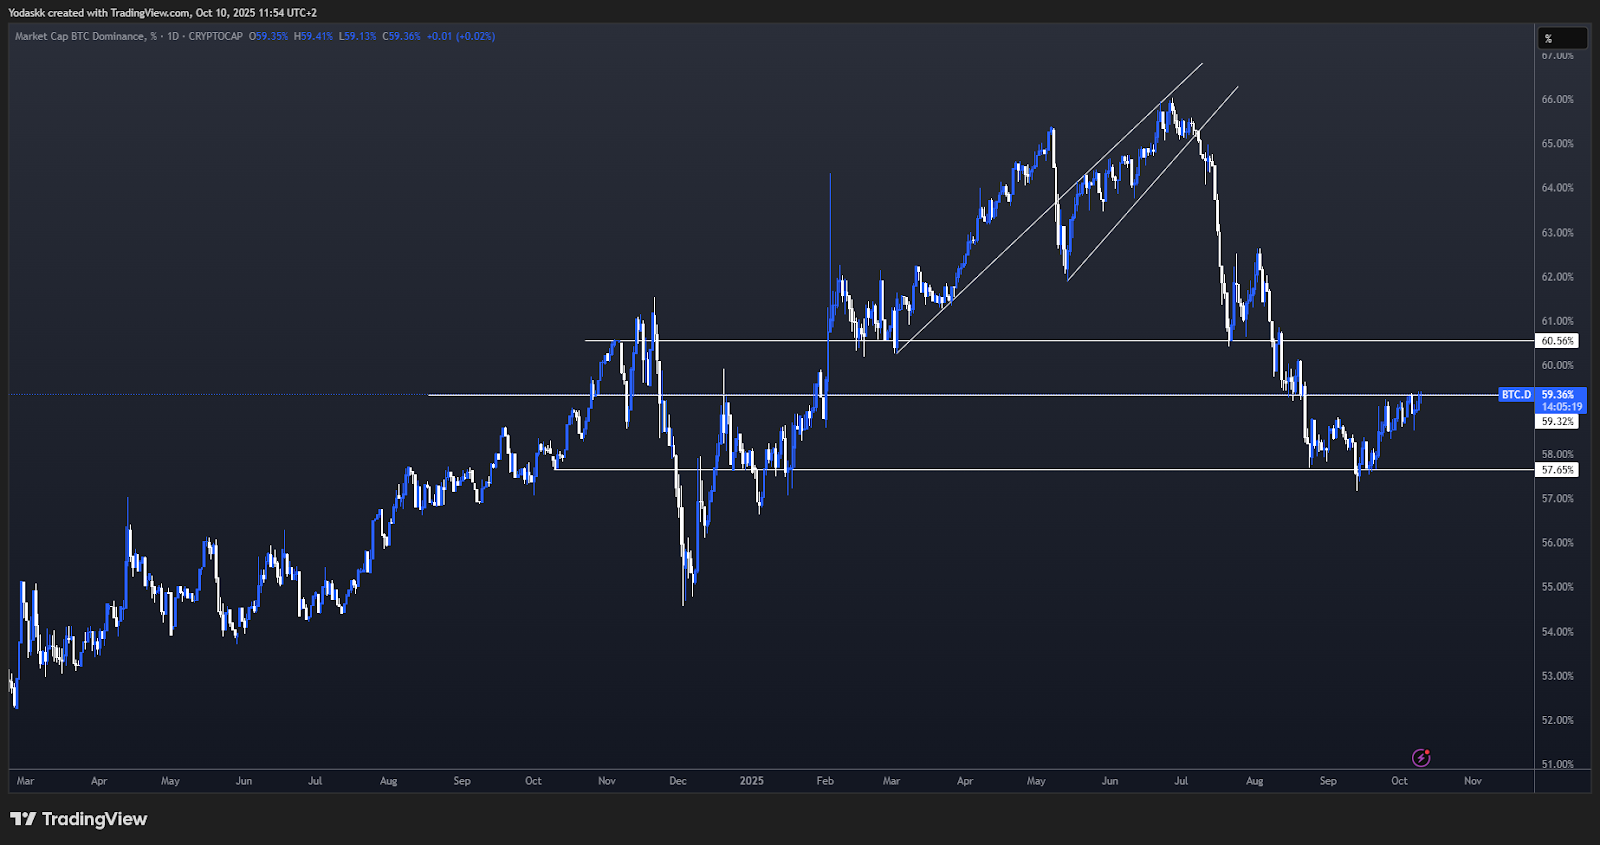
As expected in the previous Market Update, Bitcoin Dominance continued to around the 59.3% line. A rejection in this area would bode well for altcoins.
A break of this resistance could happen on a BTC loss of support or ATH break where it first outperforms the rest of the market before altcoins can play catch up with BTC.
BTC.D 1D Timeframe:
Cryptonary's Take
Even if fiscal policy, M2 growth, liquidity growing and Gold surging are all pointing for a bull market BTC continuation into 2026, BTC locally needs to hold $119k - $119.5k area and re-accumulate for another attempt at ATH break. Any break of this support zone, and next area of support would be around $114k - $115k. BTC below this area, we would begin to review our bullish stance.A reclaim of $4,550 for ETH would target all time high and above, and would bode well for the entire altcoin market. ETH closest support is around $4,200- $4,250 and next support is at $4,060. If BTC holds its $119k support, ETH should hold the $4,200- $4,250 area and form a higher low.
SOL is currently ranging between $209 - $210 as support and $234 - $237 as resistance. A break of resistance would target ATH and above.
We’re not panicking at pullbacks. As long as BTC holds $119k, we stay positioned in majors and conviction memes like AURA. If supports give way, we’ll hedge or reload lower. Either way, this is still a dip-buying environment in a larger bullish cycle, and members should stay calm, not chase shiny new coins.
Next week, CPI data on October 15th would be interesting to gauge if inflation is still under control, but this will be delayed if the US government is still shut down.
Peace!
Recommended from Cryptonary


