Save 23% ($351) & Get a Free 1-1 Call with our Team ⏰ : 0d 2h 59m 44s
Markets react to growth scare and Fed uncertainty
From rate cut expectations to Big Tech turbulence, global markets are on edge. BTC and ETH are holding critical zones, while SOL, WIF, and POPCAT react to macro trends. Here's a deep dive into where the market could be heading.
In this report:
- Last Week's and This Week's Data.
- Growth Scare.
- Crunch Time.
- Action We're Taking.
- Cryptonary's Take.
Disclaimer: This is not financial or investment advice. You are responsible for any capital-related decisions you make, and only you are accountable for the results.
Last week's and this week's data
Towards the end of last week, we saw a number of macro data points come in that spooked markets. Firstly, we had the FED Minutes on Wednesday which suggested that QT could end somewhat abruptly in the near future.This is good, but the potential abrupt ending suggests that FED officials may be seeing something under the surface that they don't like.
Alongside this, we had Michigan Consumer Sentiment come in much lower than expected and their Inflation Expectations came in at the much higher (but expected) print of 4.3% - the prior month was 3.3%, to put that into perspective.
Lastly, on Thursday, Walmart had their Earnings release and it guided towards a slowing in its profit growth for the upcoming year. However, they suggested that this was more down to tariffs than a weakening consumer. Although analysts questioned this.
Looking at this week's data, we have FED speak to watch out for, but the key data points are likely to be Thursday's GDP print - expected to come in at 2.3% (prior was 3.1%), and Friday's Core PCE Price Index and Consumer Spending and Income.
PCE is expected to come in hotter (0.3% - 0.4%, this is relatively hot if so), whilst Personal Income and Spending are expected to downtick. Granted the prior months' prints were high.
But overall, the data is suggesting a weaker economy going forward.
Another important point for next week is Nvidia Earnings on Wednesday. If that comes in negatively - and by negatively, we mean they forward guide a slowing on the horizon - then that may catalyse another leg lower in Big Tech, and therefore likely the Indexes also. Something to keep an eye on this week.
Growth scare:
Over the last few trading days, the growth scare, or the potential of a growth scare has started to become more priced into markets. A lot of this is due to policy uncertainty, and mostly tariffs that are likely to come more significantly into effect on April 1st.As a result, we've seen a move down in GDP from the 2.5% mark (give or take the specific day), now down closer to 1.5% (give or take the specific day). Either way, it's a more material move down in growth across the world.
The model below is from CrossBorder Capital.
Daily AI-based world GDP:

Crunch time
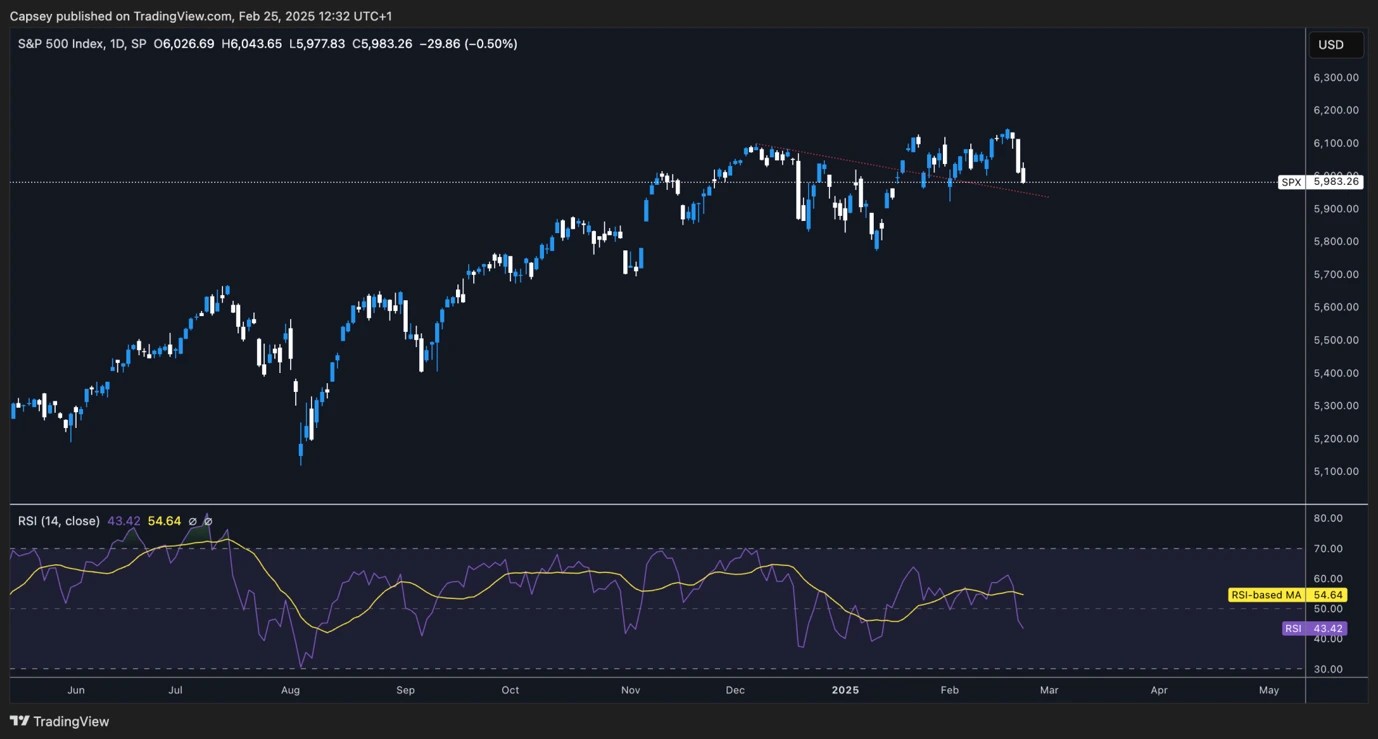
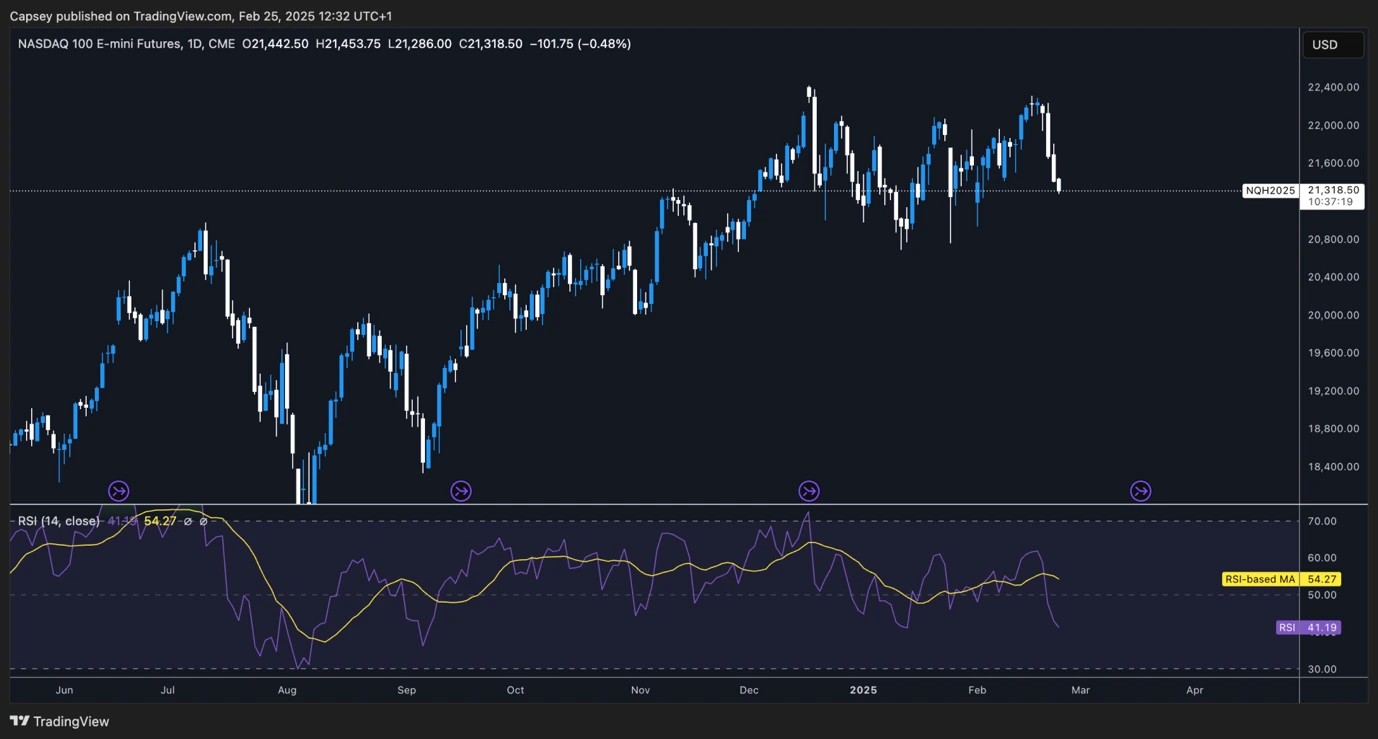
It does very much feel like the market is moving closer to a crunching period now - where asset prices come down due to pricing in the uncertainty, as they're now taking it seriously rather than just brushing it off. This is clear and described mostly as a growth scare and we can see that in the charts.The S&P and the Nasdaq have both come down, but this has been met by Yields also coming lower - somewhat of a flight to safety which has been normal when there are fears over growth. This is the recession playbook - out of risk and into Bonds.
Now, we're not saying we're about to enter a recession, but this move in markets is a clear sign of the market pricing in a growth scare that policy uncertainty, and the implementation of tariffs, would give you.
S&P:
Nasdaq:
US10Y Yield:
We expect the US10Y Yield to end the year between 3.50% and 4.00%.
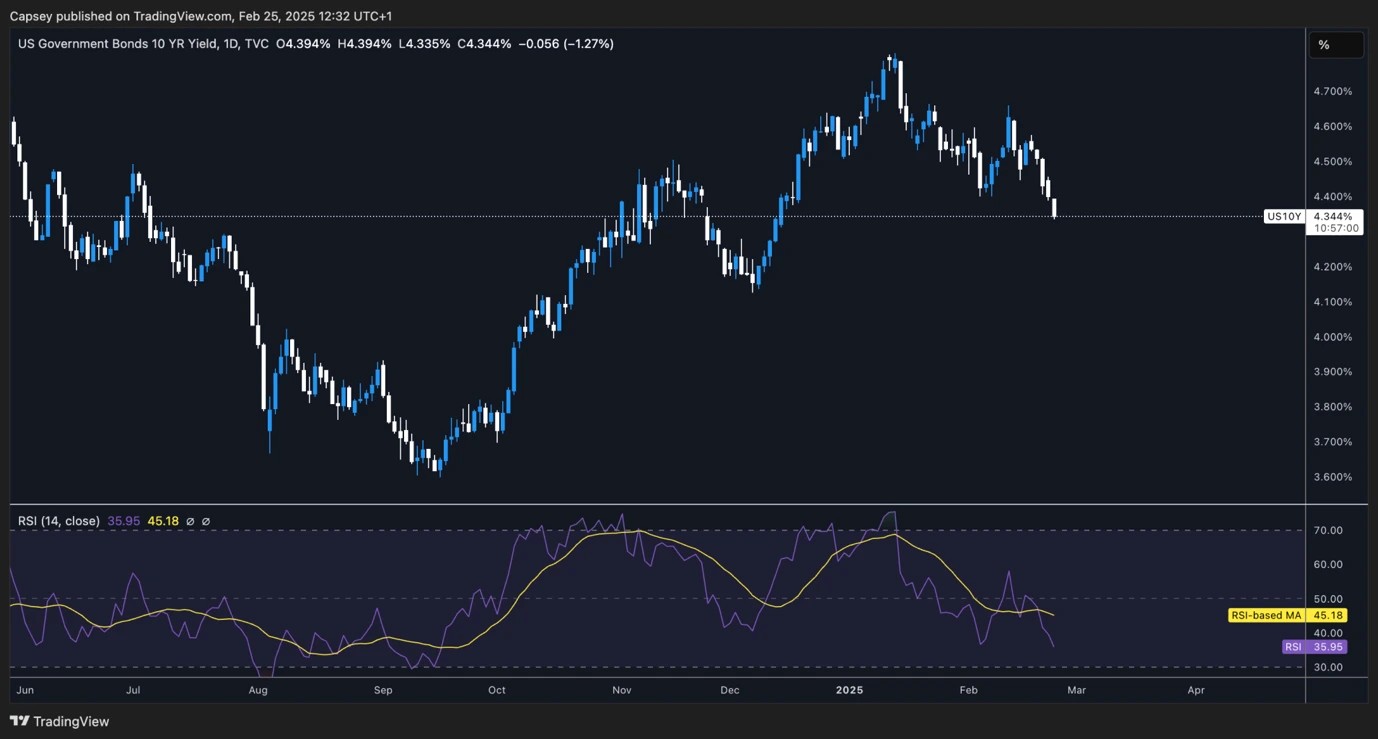
Currently, the market is still priced for just 2 interest rate cuts over the next 15 months. However, if a growth scare is to materialise into more than just a scare, then 2 cuts are way too low.
We expect to get 2, maybe 3 interest rate cuts before the year is done. However, the increase in the number of cuts would be due to a growth scare materialising in the coming months. This might mean more pain first (H1), before pleasure later.
This has been our view for a while now, first half of the year, we see a tricky/painful market, whilst the second half of the year (particularly getting into Q4) could be really positive.
And think of the opportunities that this might bring ie, prices down substantially in the coming months - gives us great entries - to then sell those positions in 2026 for multiples more.
Action we're taking:
Two months ago, we called for BTC, ETH, SOL, WIF and POPCAT to all hit their Yellow Boxes. These were price zones well below the prices given at the time. ETH, WIF and POPCAT all hit their zones within the last few weeks. SOL hit its Yellow Zone overnight.SOL 3D timeframe:

For now, we're not looking to add SOL at this point as we believe the macro has more to play out.
We suggested 6 weeks or so ago, that the far end of the risk curve would move first ie, WIF and POPCAT make their mega moves down, and fill their Yellow Boxes. And then, over time, you'd see each asset further up the risk curve make the same move. We've now had SOL make that move.
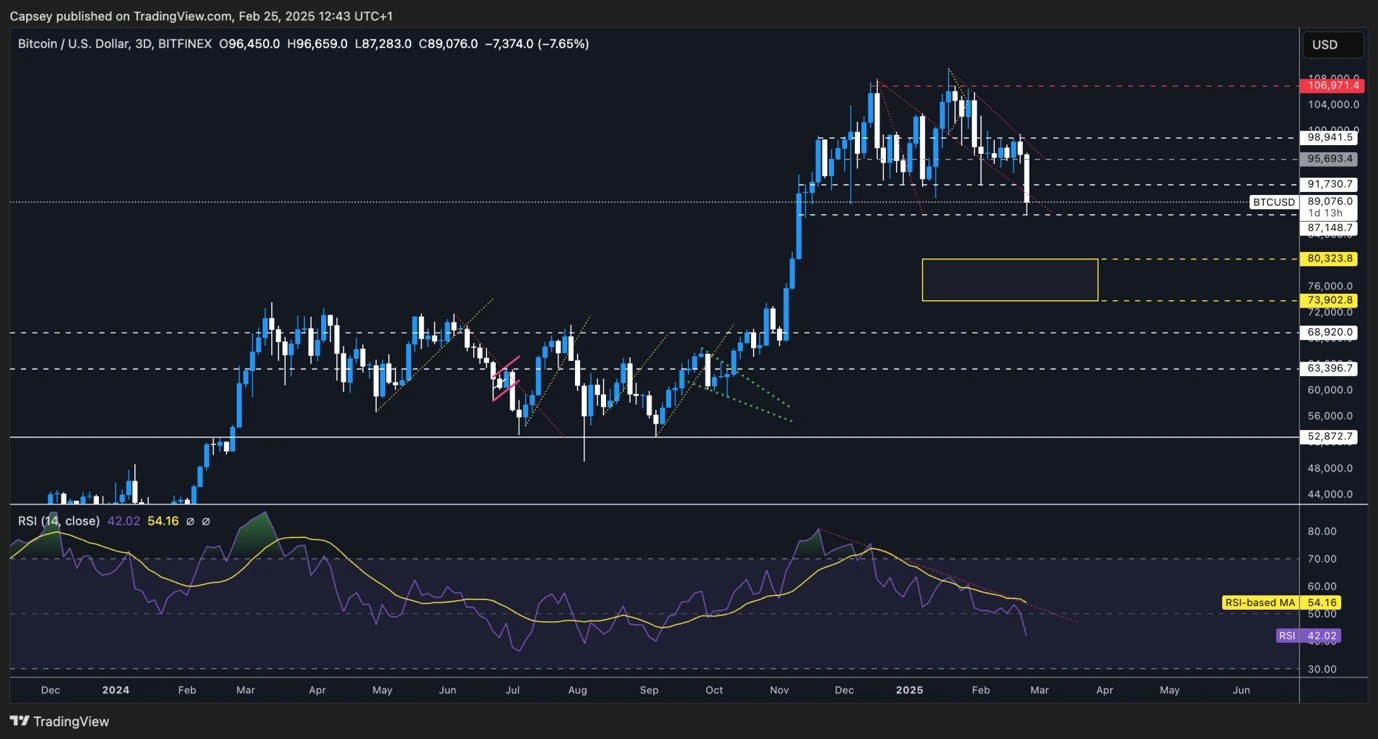
Next, is BTC. We expect that by the end of April, BTC will have filled its Yellow Zone between $73,900 and $80,300. Now, this doesn't mean that Alts/memes will have a massive move down again.
They have sort of done the bulk of their move. However, we do expect them to keep moving lower, but more of a slow bleed, rather than just a capitulation to 0.
BTC 3D timeframe:
Cryptonary's take
We'll keep this simple. The message is the same. We remain in cash, and we're not looking to deploy it as of yet. When trading opportunities come, we'll look to take them, or for those that are comfortable with staking and getting yield, there are options there also.Now, most might think this is boring, and arguably, if you are in stables and just sat on the side waiting, it is boring. But, this is where the money is made. It's made in being patient and letting these assets come lower. There's more cleansing that needs to be done here, so let assets come down more. The more they come down, the greater the multiple back to their all-time-highs is.
At the moment, the outlook isn't good. But this is Q1 and Q2. Beyond that, the outlook is very good (Q3 and Q4). However, being able to see 'the wood through the trees' is important.
This message we can't repeat enough. **Now is the time to be here**. Stay attentive now, and you'll get back in at the right time (the same as how we got many of you out at the right time), and therefore you'll make the maximum gain to be had. If you turn off now and come back when everything is roaring again, honestly, you'll be someone else's exit liquidity.
Recommended from Cryptonary

