Save 23% ($351) & Get a Free 1-1 Call with our Team ⏰ : 0d 2h 59m 43s
Melo, PEPE, and WIF market insights
Let’s take a look at these three assets—Melo, PEPE, and WIF—as they've all shown distinct market behaviors recently. Some have stronger momentum than others, so we’ll dive into each one and analyse where the key levels lie for potential entries, exits, or long-term holds.
Disclaimer: This is not financial or investment advice. You are responsible for any capital-related decisions you make, and only you are accountable for the results.
Melo:
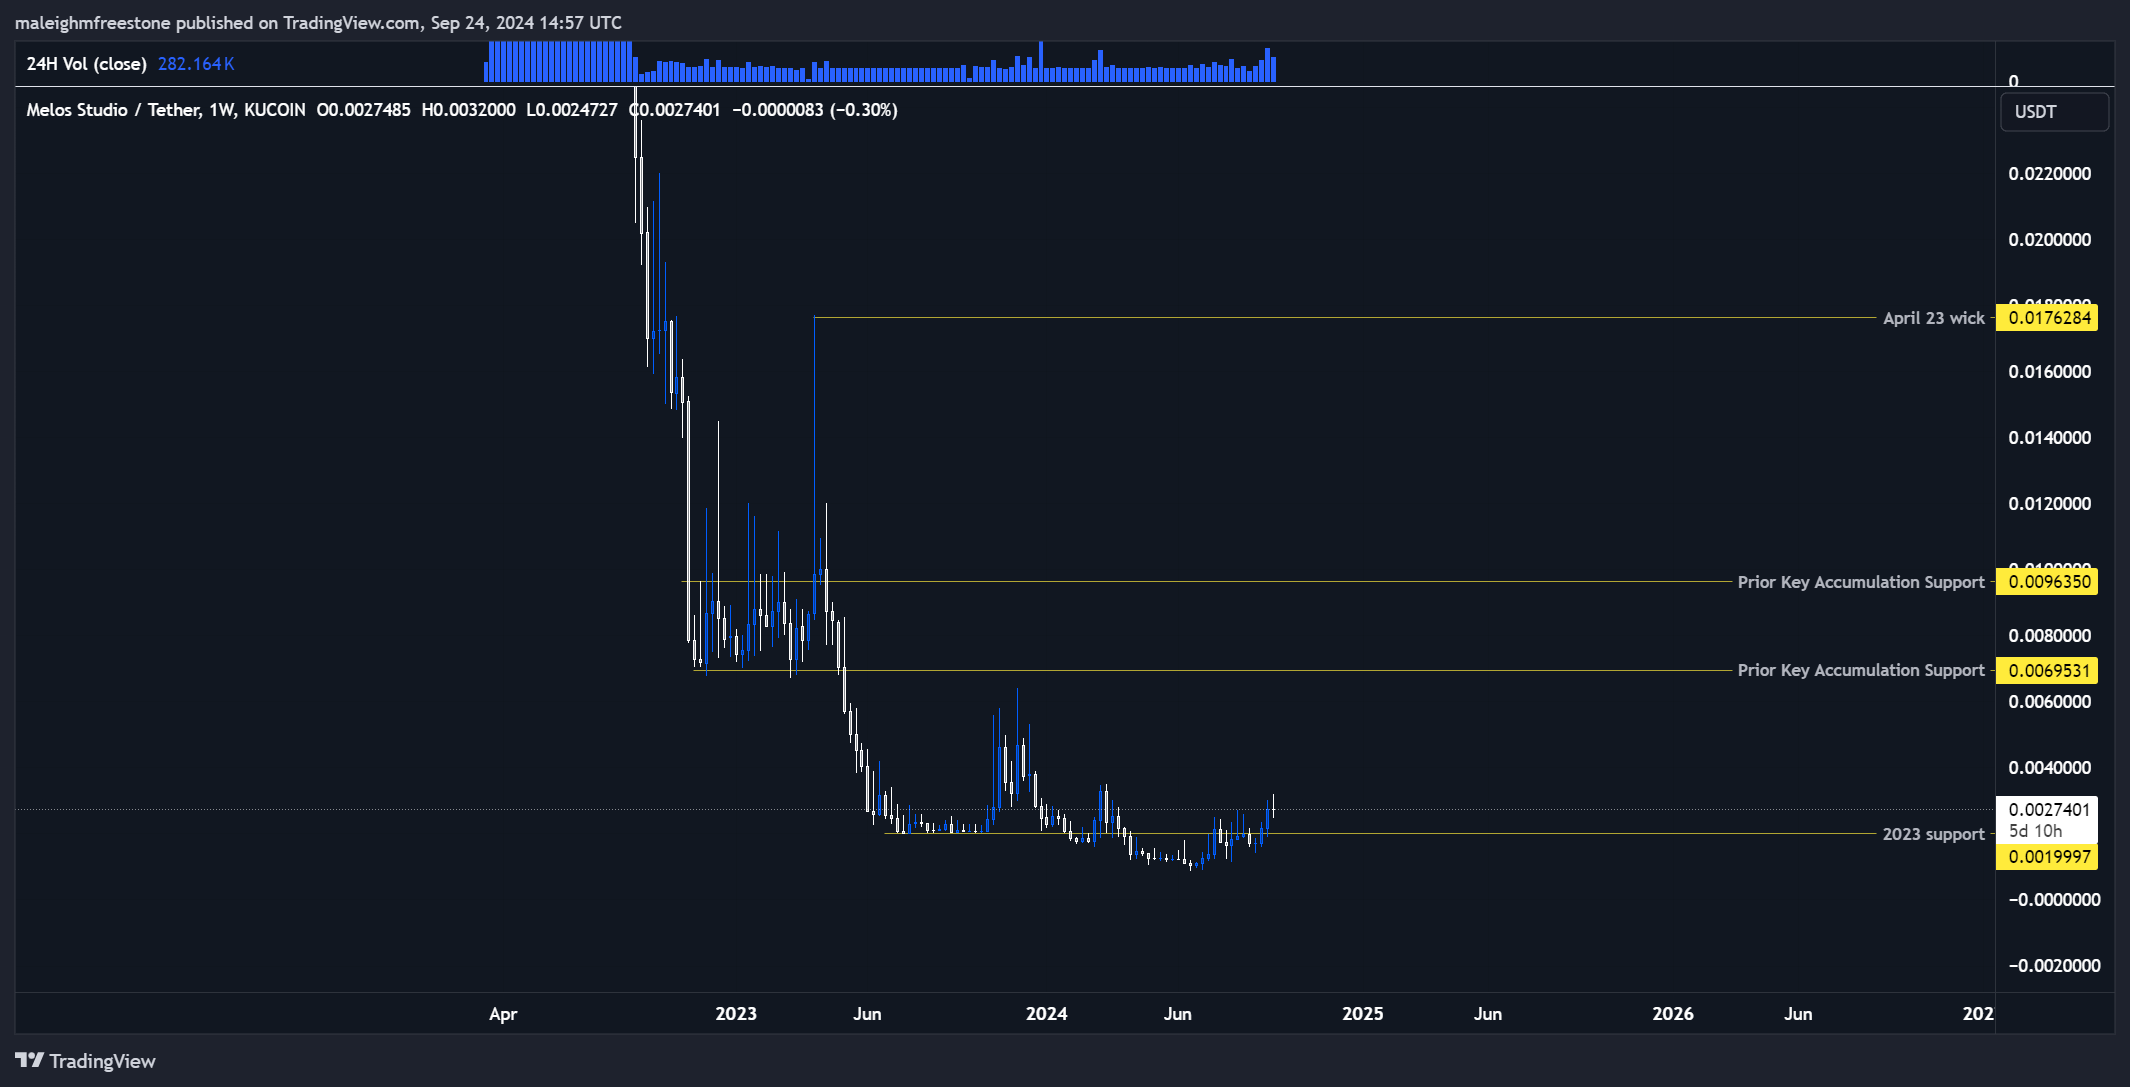
Melo has been in a consistent bearish downtrend since its inception, with no significant signs of recovery. We'll focus on price action from 2020 to 2023.Key events and price levels
- April 3, 2023 Wick: The key moment came with a WIC to 0.0176284, which marked a temporary spike but didn't shift the overall trend.
- Accumulation Phase (End of 2022 - April 2023): There was a strong accumulation zone during this period, offering potential support. However, this zone was broken after the April Wick.
- Sell-off Post-Wick: Following the spike, Melo saw a sell-off that broke through the prior accumulation support and traded down into a new low at 0.0019997. This is our current 2023 support level.
Cryptonarys take
Looking at the overall market context, Melo lacks the momentum seen in other assets. To consider Melo for investment, reclaiming the April 2023 Wick at 0.0176284 would be necessary. Without that, it's not worth the risk based on the current price structure and sentiment when you compare it to the rest of the asset class.PEPE:
Following our last analysis, we haven't seen a ton of movement just yet, but there are a few key developments worth noting, especially in the monthly timeframe. Looking at the broader market context, we can see that from February to May, Pepe made a 1,900% move to the upside- a significant gain compared to other assets in the space.After this, we had a retracement that brought us to the 61.8% Fibonacci level, which is where we're currently trading. Importantly, we've seen a strong reaction at this level. This Fibonacci region has aligned perfectly with a three-pin formation, which is essentially an inverted head and shoulders pattern, one of the strongest reversal signals. We've highlighted this on the chart, as seen with the red-orange circles.
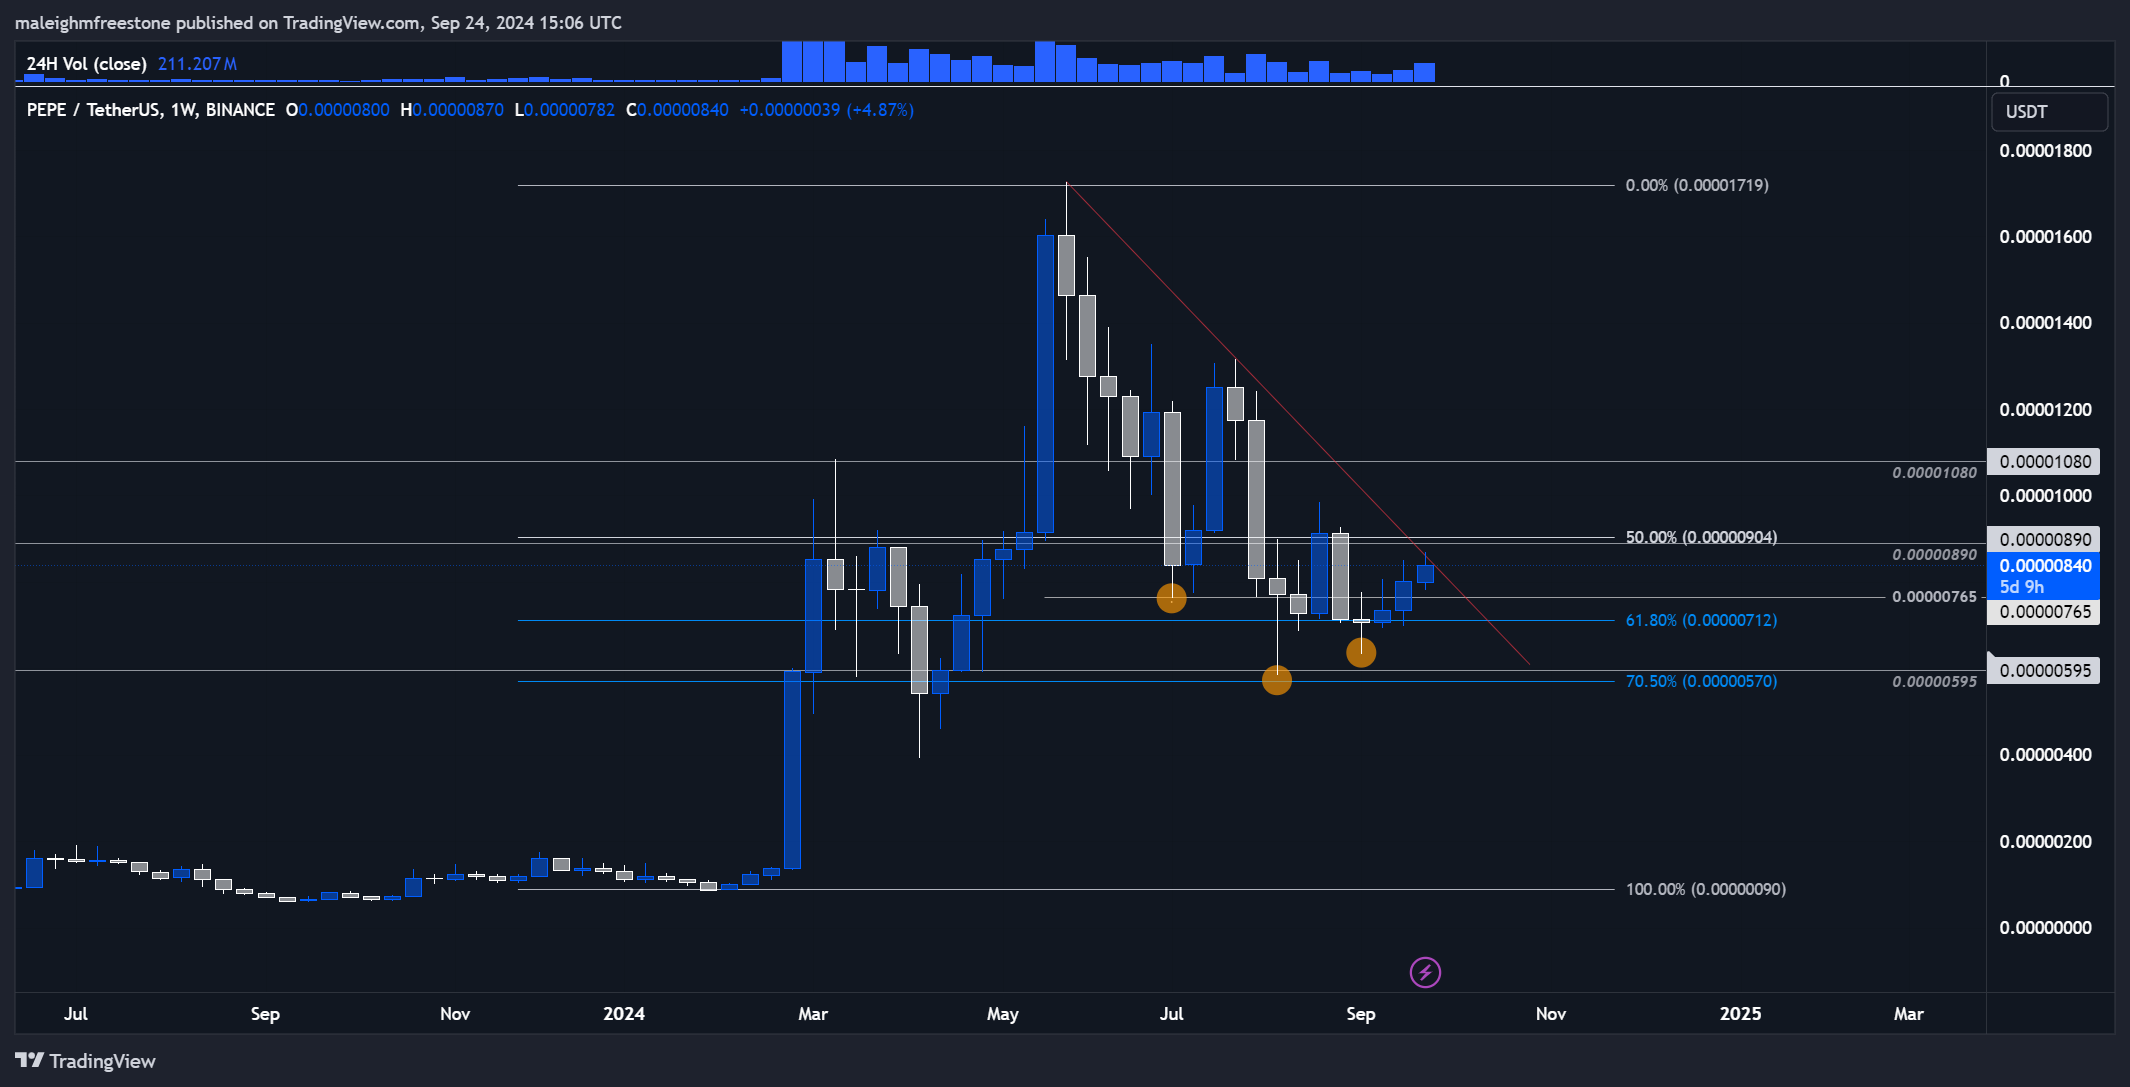
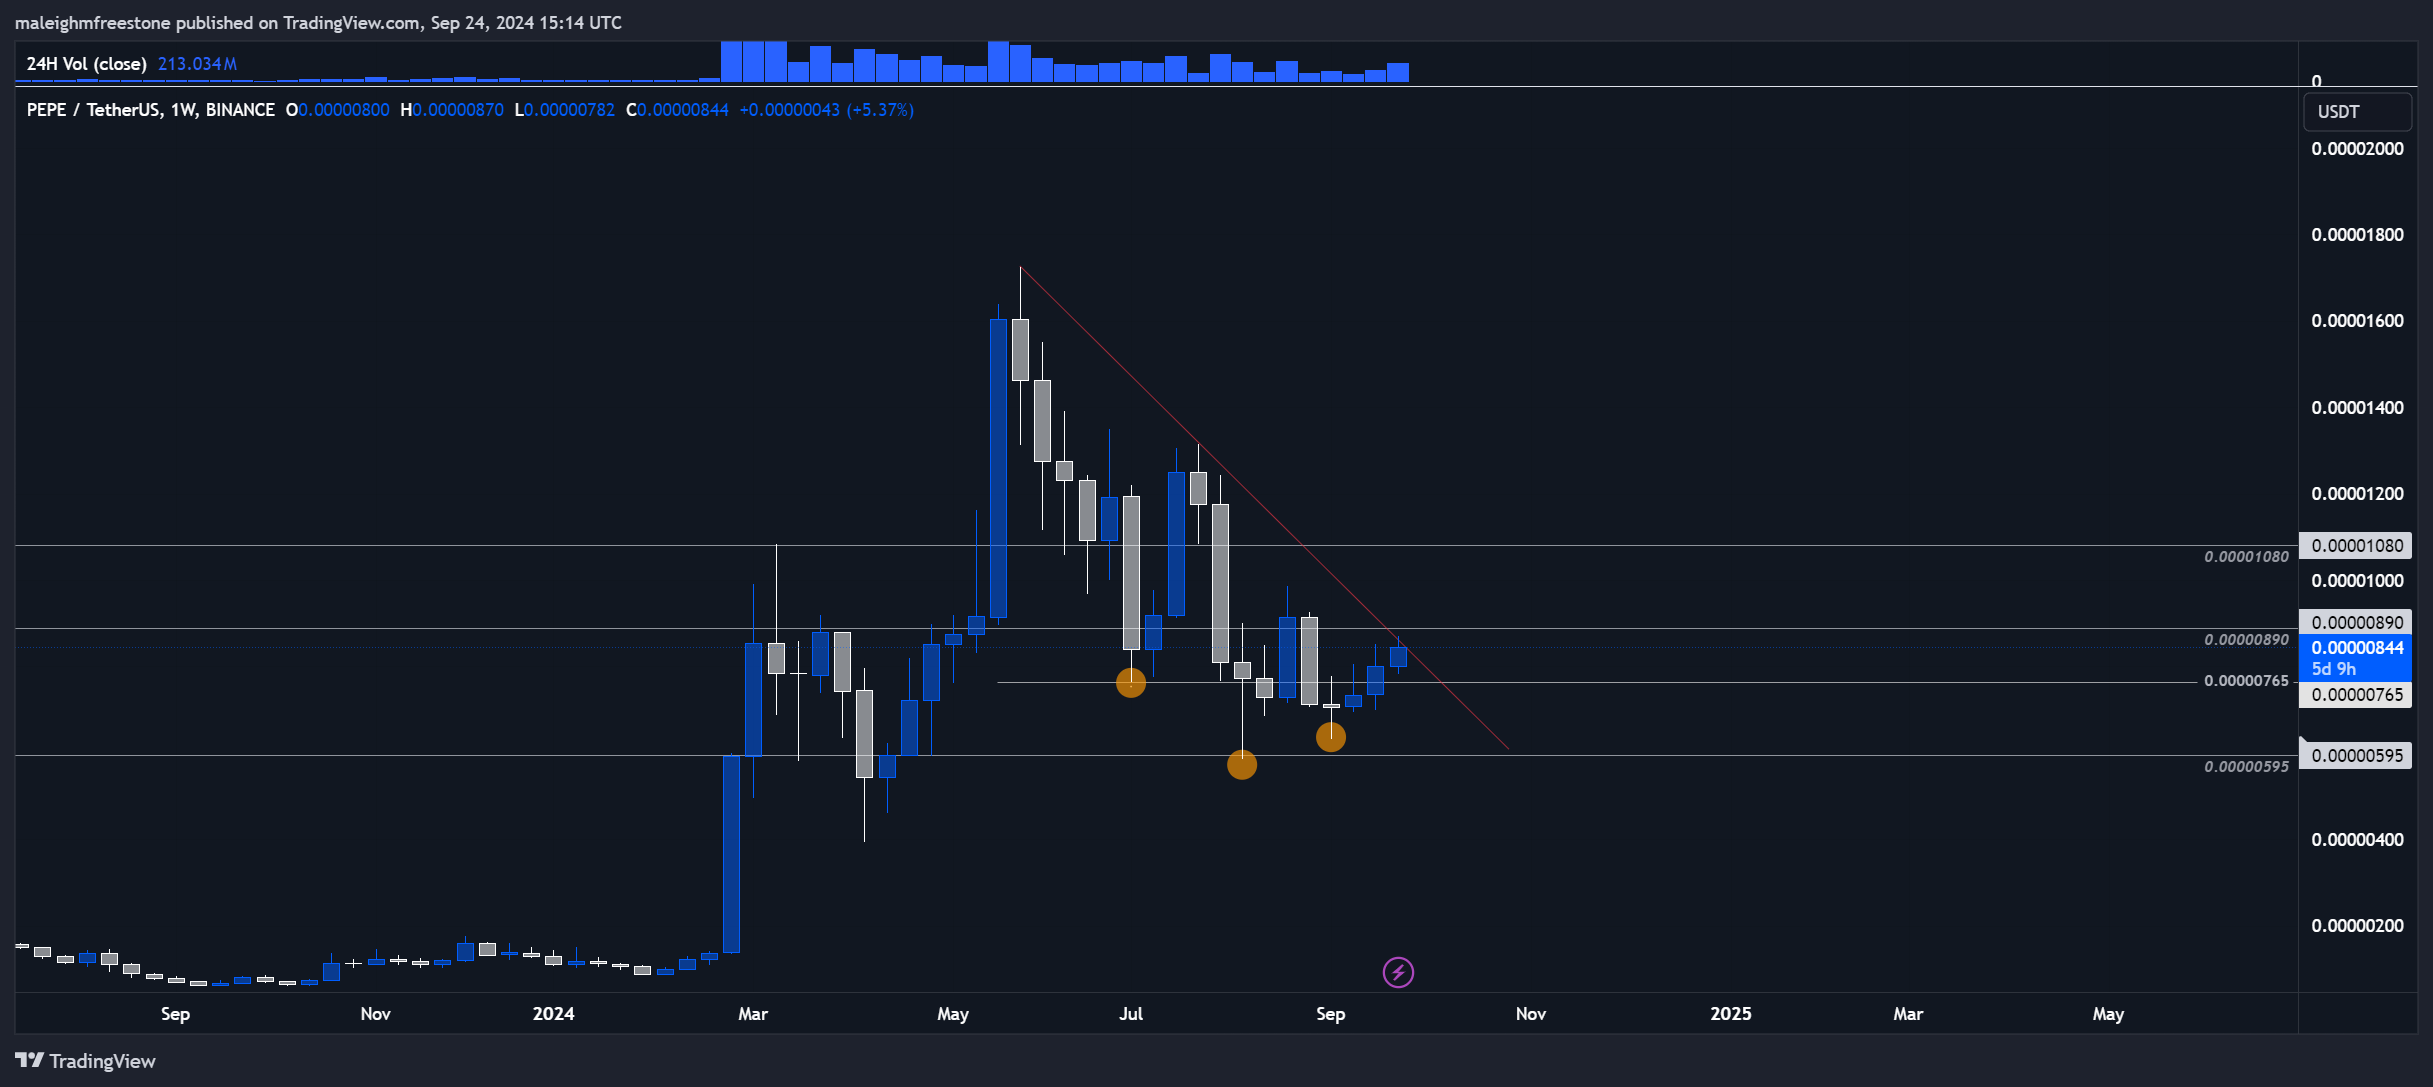
Zooming into the weekly timeframe, we can see a clean, rounded bottom forming. The weekly time frame also reflects a healthy corrective move, with bulls pushing back against the previous bearish momentum. Additionally, we've drawn attention to a red diagonal resistance level, which we're testing right now. A breakout above this level could be a key signal for upward movement.
Playbook
The current zone is ideal for spot accumulation within these price regions. Although we're not invested in Pepe, it's hard to ignore how strong this asset has been, especially considering its price action this year. Pepe remains a serious contender for this cycle.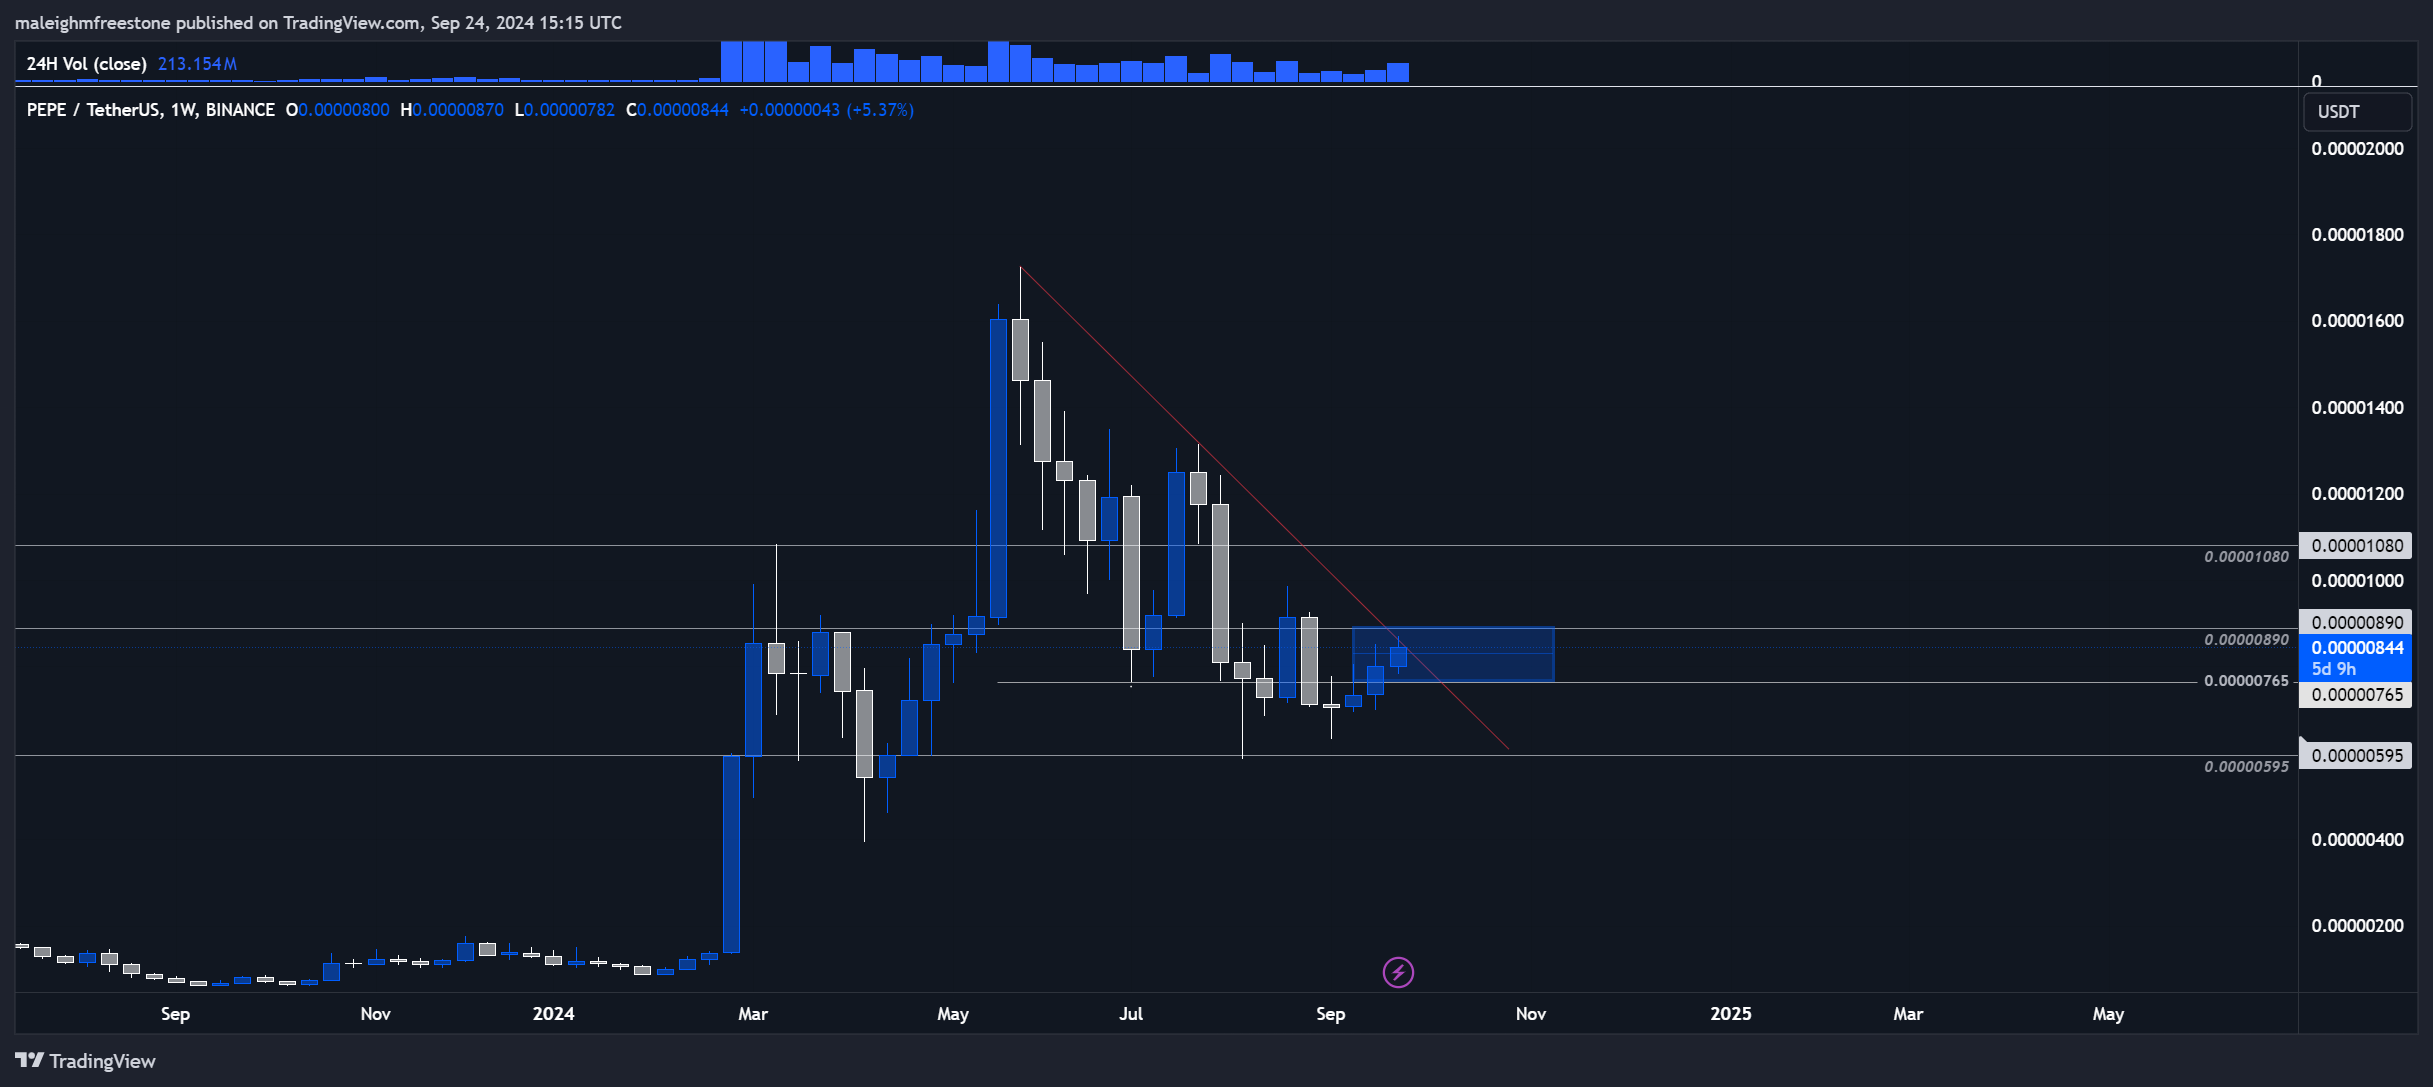
Cryptonarys take
Again, just a reminder-while Pepe has been a standout asset in terms of strength and bullish price action, this isn't something we are invested in. However, when we compare this price action across the board, we see that it's a real player when we look at the technicals.WIF:
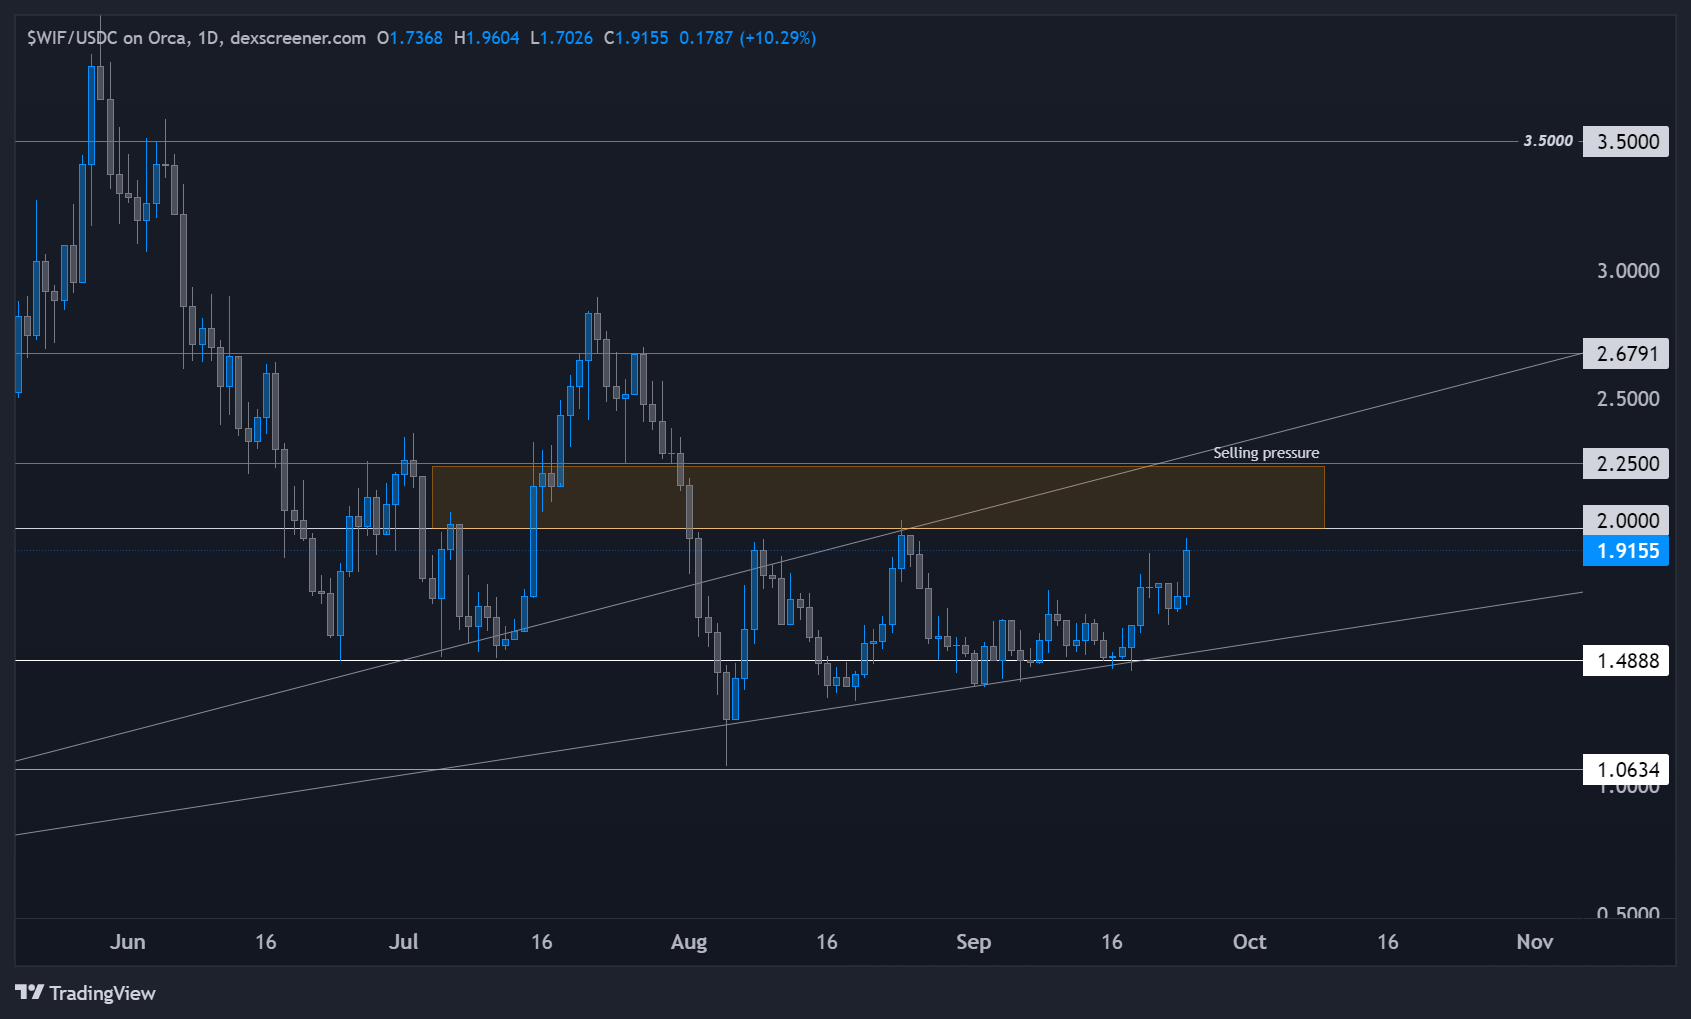
When we trade, understanding why resistance is formed is critical. Resistance levels are created because, at specific price points, sellers consistently step in. In your WIF trade, you've pinpointed a resistance around $2, which is where sellers have been actively entering the market.Every time the price approaches that level, we see WIF rejected, causing a move lower. Now, why does this happen? When sellers either exit their positions or short the asset at that price, it makes it difficult for the market to break through. The key is recognizing that resistance means sellers are stronger than buyers at that level-until proven otherwise. That's why it's important to wait for a breakout.
Waiting for the breakout
What you've done is longed into resistance, which isn't necessarily wrong. In fact, some traders specialize in trading breakouts. But when you're buying right at a resistance level, it can be harder to manage risk. There's less clarity on where to place your stop-loss, and you're effectively betting that this time will be the one where resistance breaks. A more conservative approach is to wait for the breakout to happen and then enter on the retest of the former resistance, now acting as support.Why? Because once resistance breaks, it signals that the sellers at that level have been exhausted or overpowered by buyers. The price often retests the breakout level, and if it holds as support, it gives you much stronger confirmation that buyers are in control. At that point, your entry has better risk management since you can place your stop-loss just below the newly formed support.
Example of breakout and retest
If we look at WIF, there was a key level at $2.69 that served as resistance. We saw the price break through this level, and after the breakout, it came back to retest it. That retest confirmed that buyers had reclaimed control of the level, turning it into support. This is the kind of scenario where you have more confidence in entering a long position because you're now buying from a stronger level, knowing that buyers are stepping in to defend that price.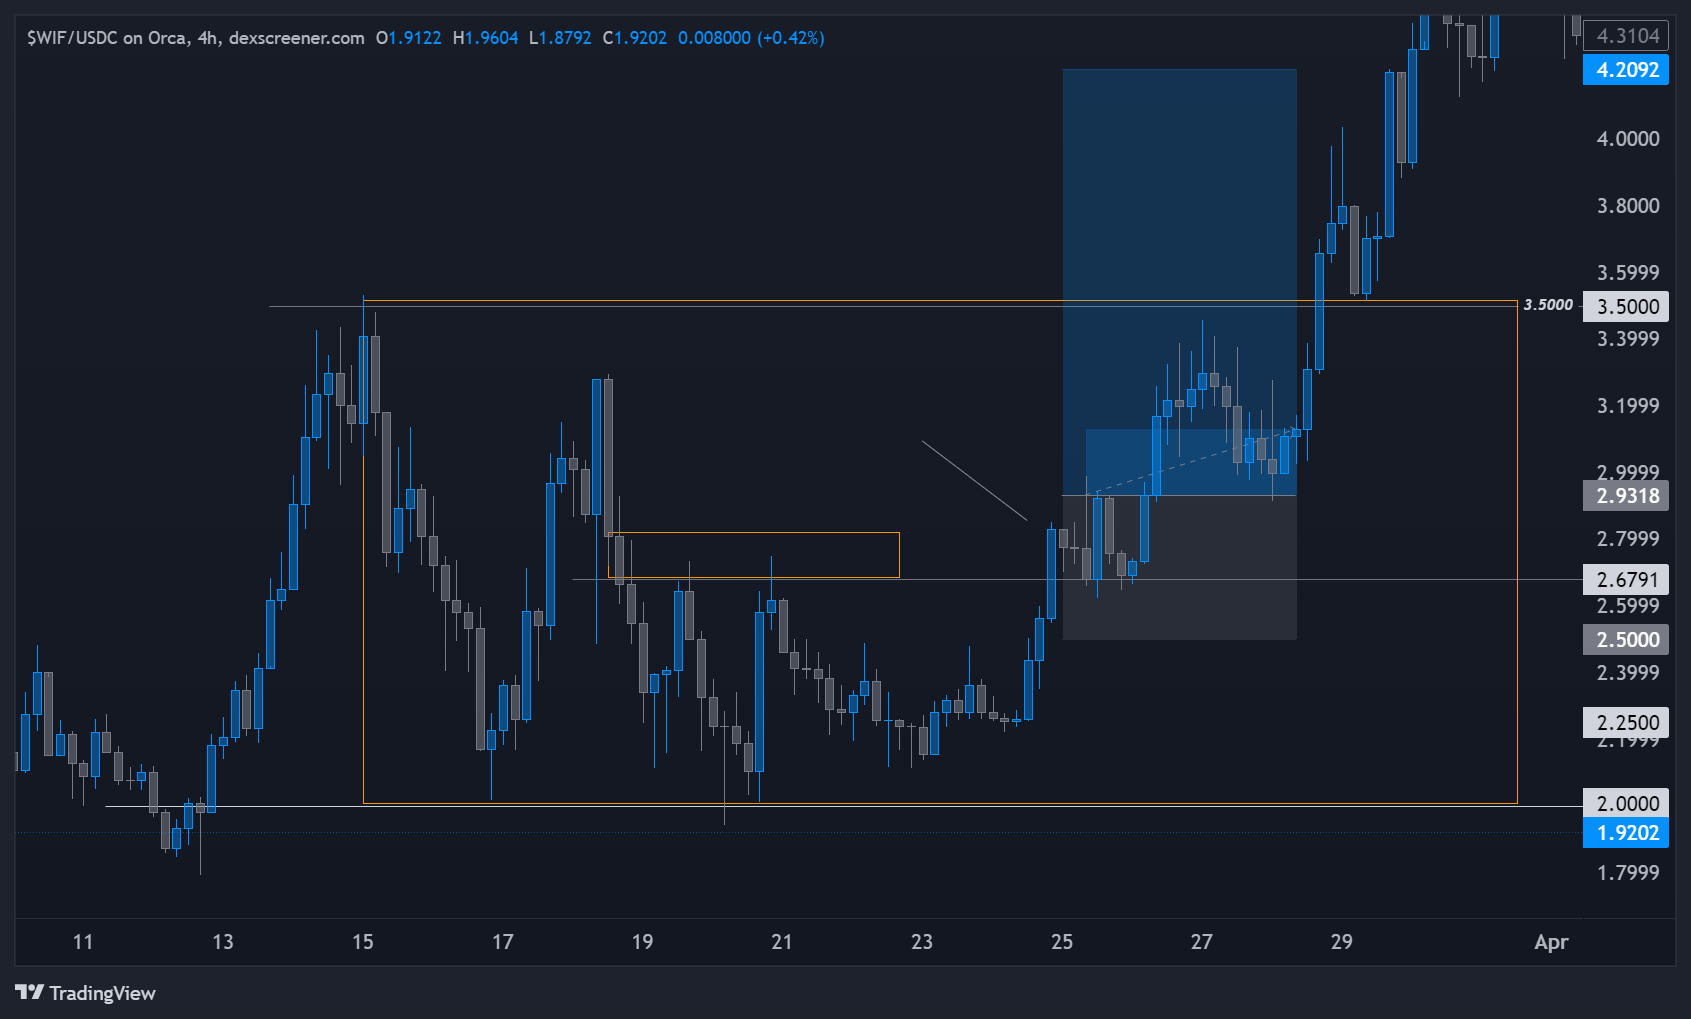
Cryptonary's take
Waiting for a resistance break and retest is a simple yet powerful strategy. It allows you to confidently enter trades, knowing that the previous sellers have been overcome. It also helps with risk management since you can place a stop-loss below the new support level. While breakouts can be tempting to trade right away, sometimes, a bit of patience can put the odds more in your favour. Just a little tip for future trades. You've identified the levels well, which could be another step to enhance your execution.Recommended from Cryptonary


