Save 23% ($351) & Get a Free 1-1 Call with our Team ⏰ : 0d 2h 59m 44s
Members Breakdown - 30 January 2021
In less than 48 hours, both the monthly and weekly candles will be closing. These closures will set the tone for the upcoming week. Let's review price action, with an emphasis on Ether for reasons you will understand below.

Bitcoin
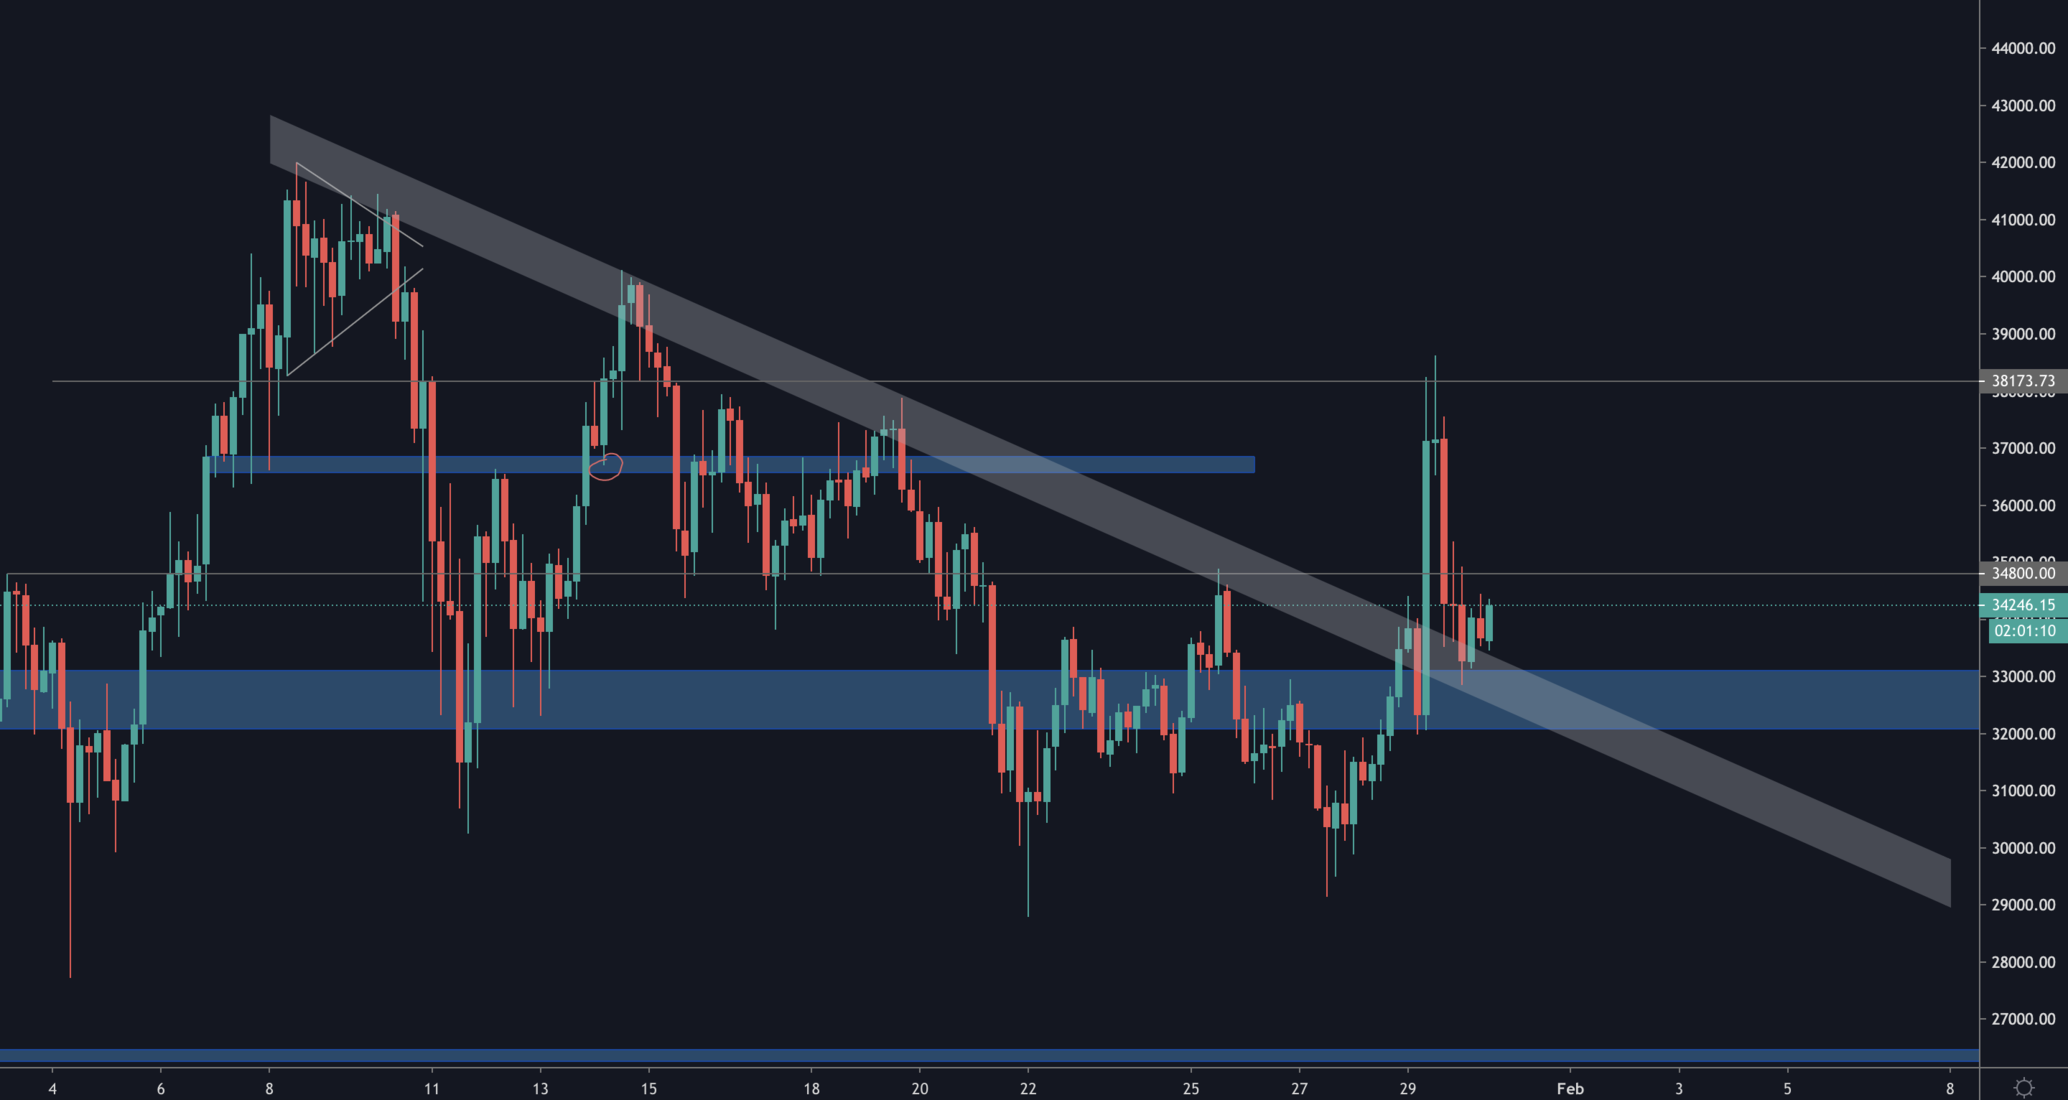
After the "Elon Candle"; yes that is what we call it now (story here), Bitcoin saw a quasi-full retrace back to the [$32,000-$33,000] support area which coincided with a retest of the broken counter-trendline.
From a technical perspective, these are bullish retests. However, when the market moves sharply up to this magnitude and retraces the majority of the moves it leads to confusion amongst market participants. This in turn, leads to price stagnation for a few days. Which favours what Alts are drawing out to do - ETH in particular.
Ether
We might as well call this breakdown the "Ether Breakdown" given the importance of the moves it is pulling.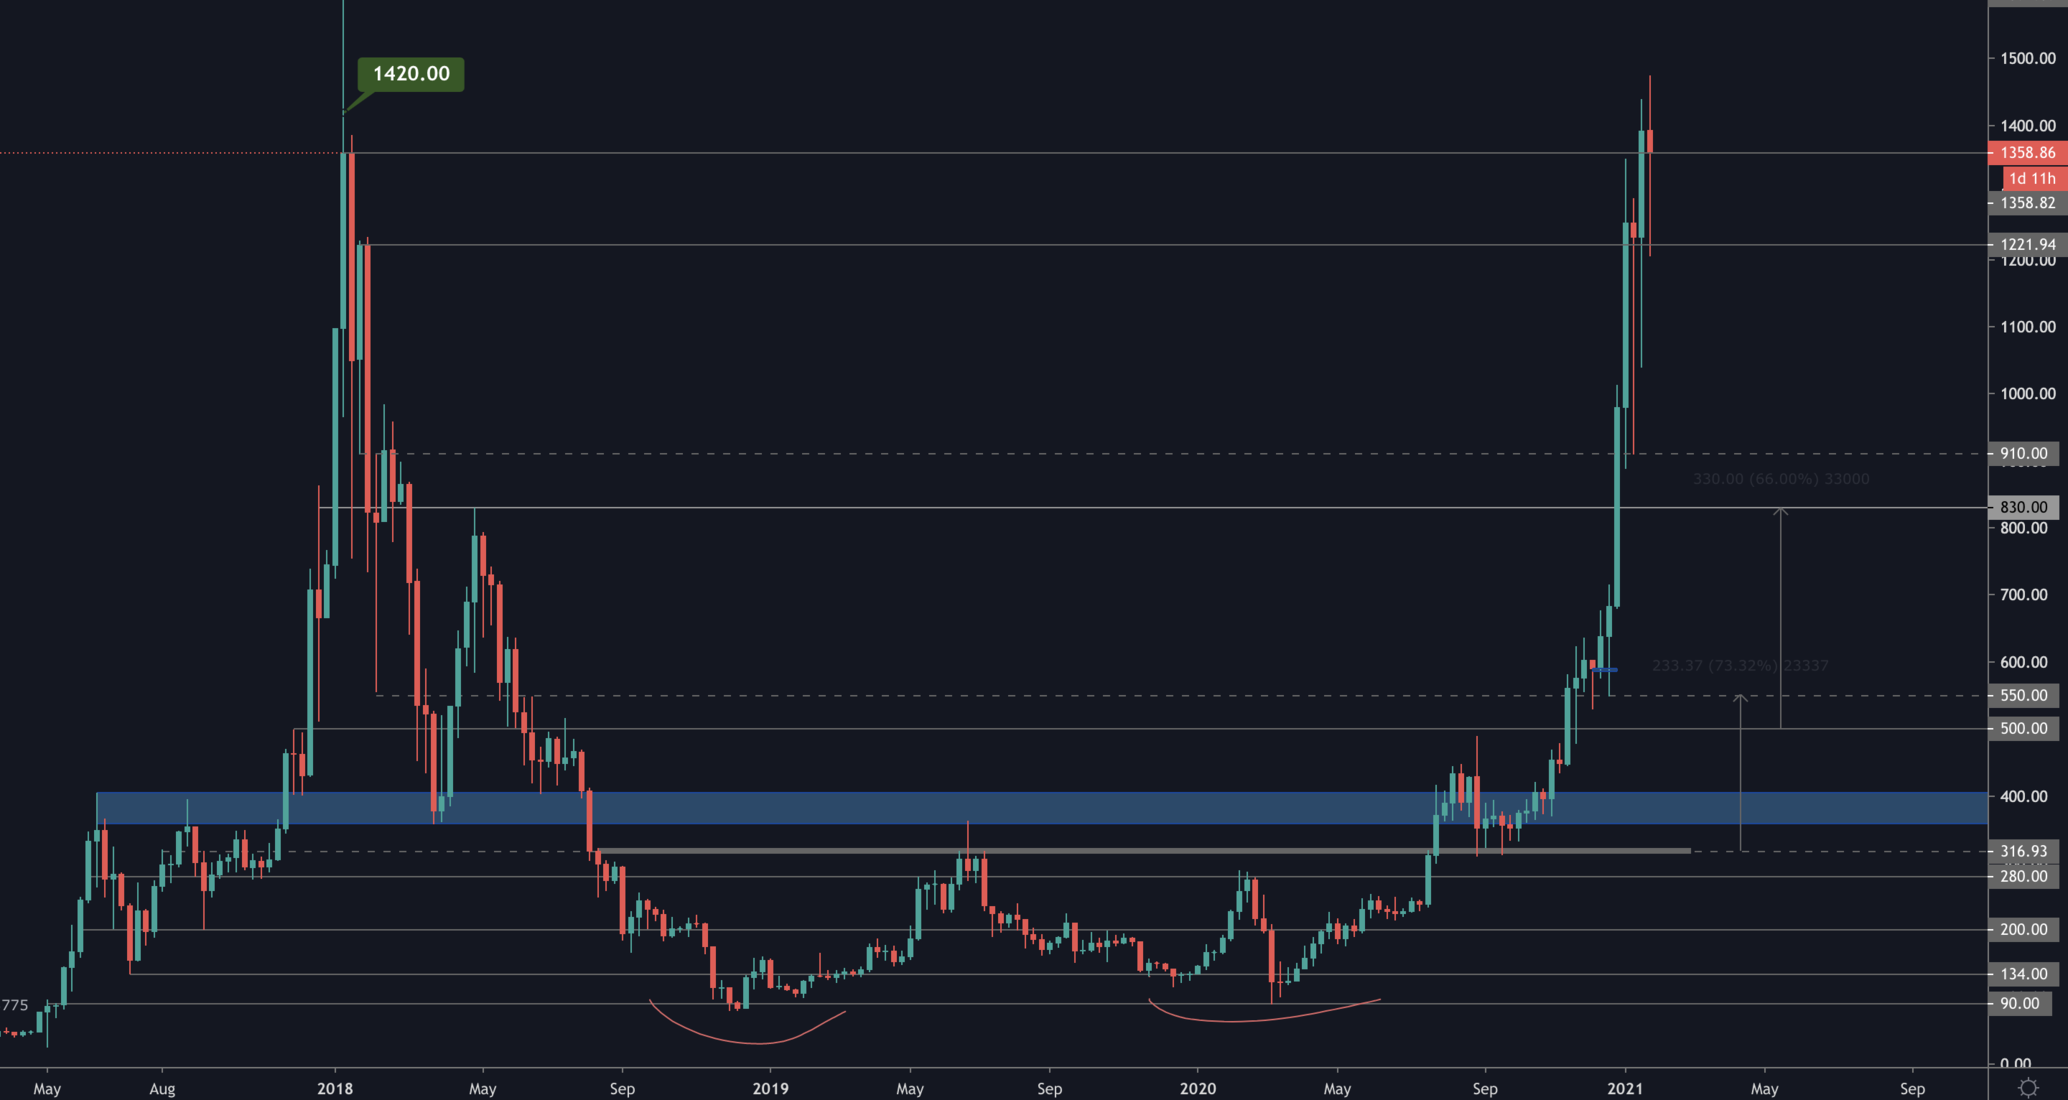
From a weekly perspective, ETH is looking to close the candle over $1,360 which happens to be the weekly high of 2017. We've seen this on Bitcoin before it entered price discovery with a lot fo strength (all details in this Pro-exclusive YouTube Breakdown Video).
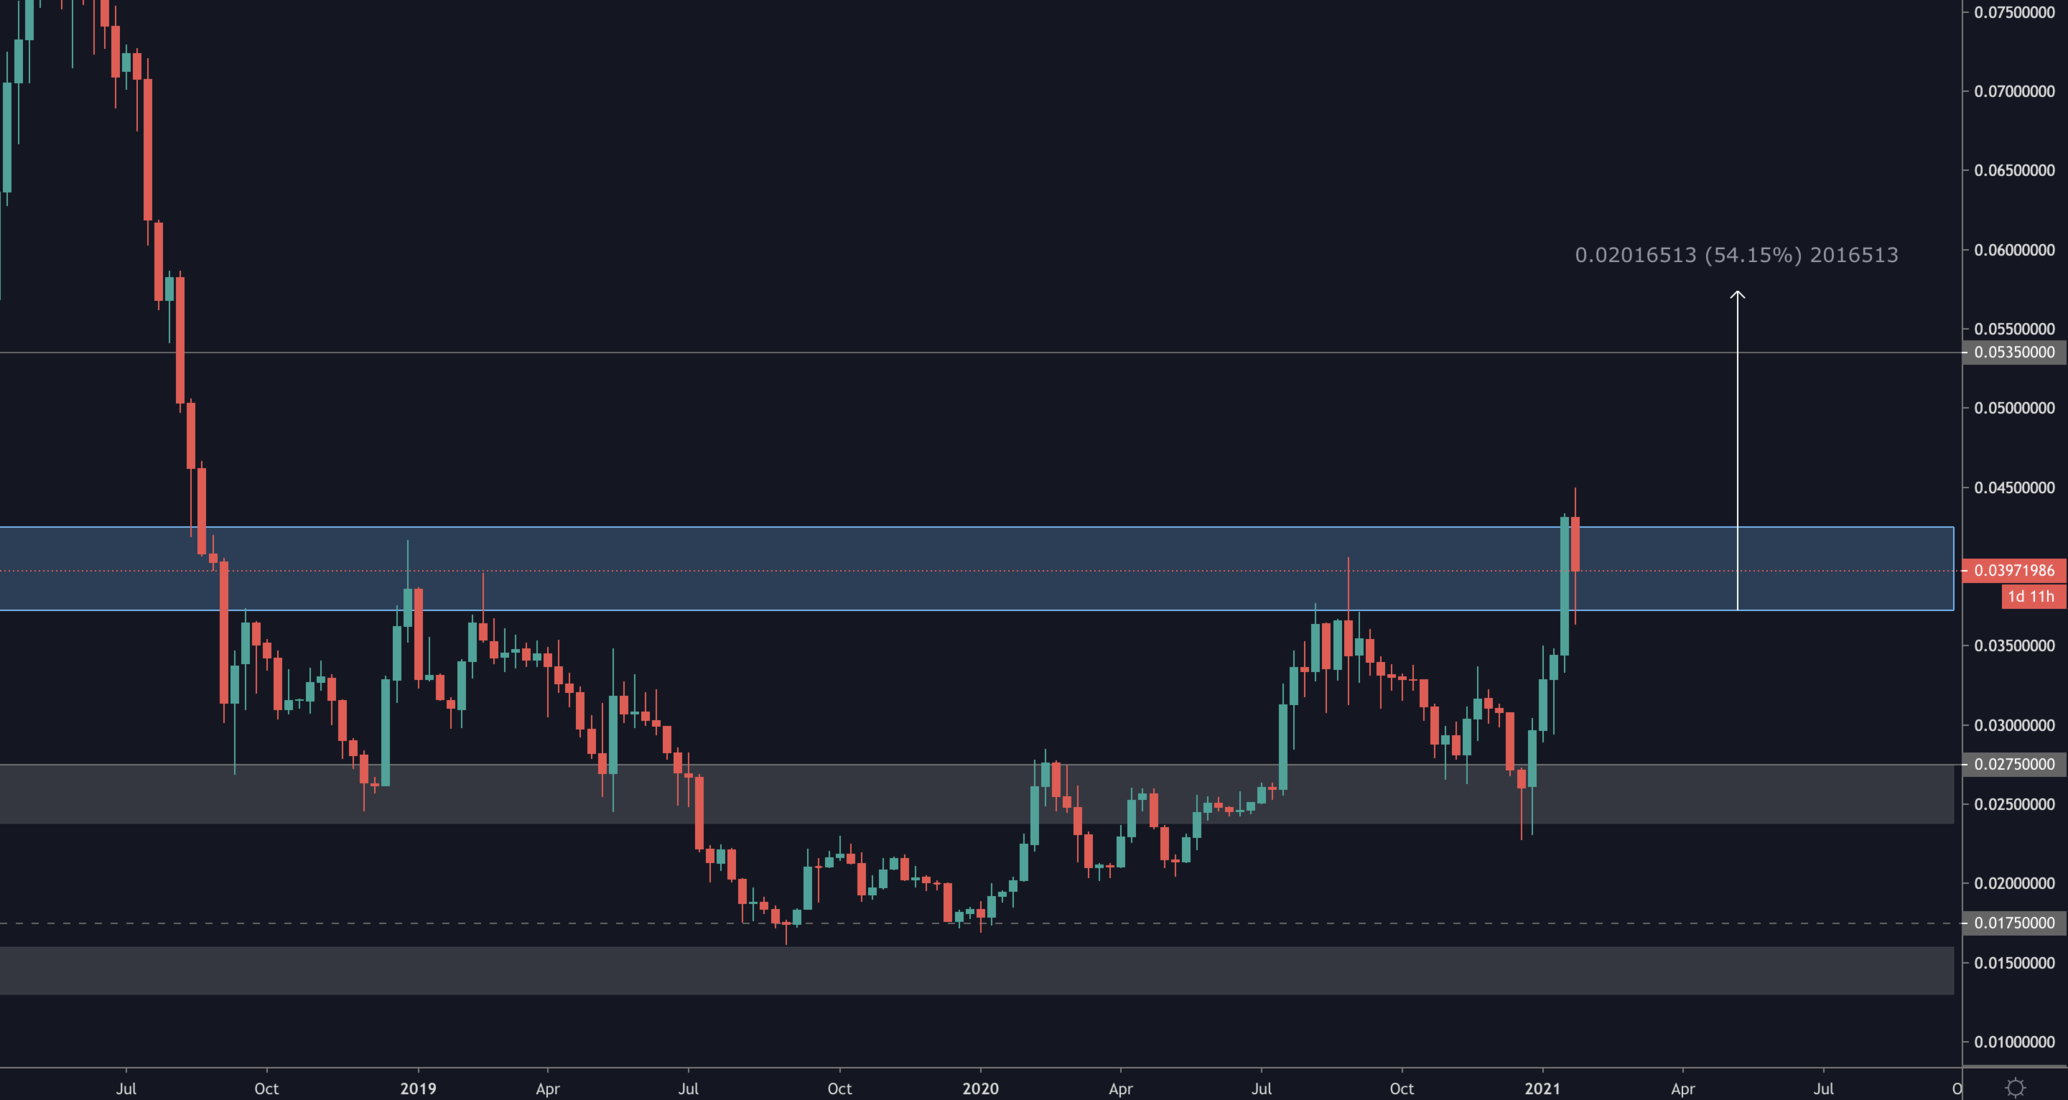
This ETH/BTC, a chart with a breakout that should not be taken lightly. ETH managed to breakout above a resistance which held strong for 885 days. This is a major development and favours the upcoming ETH outperformance of BTC. The first target you ask? 0.058
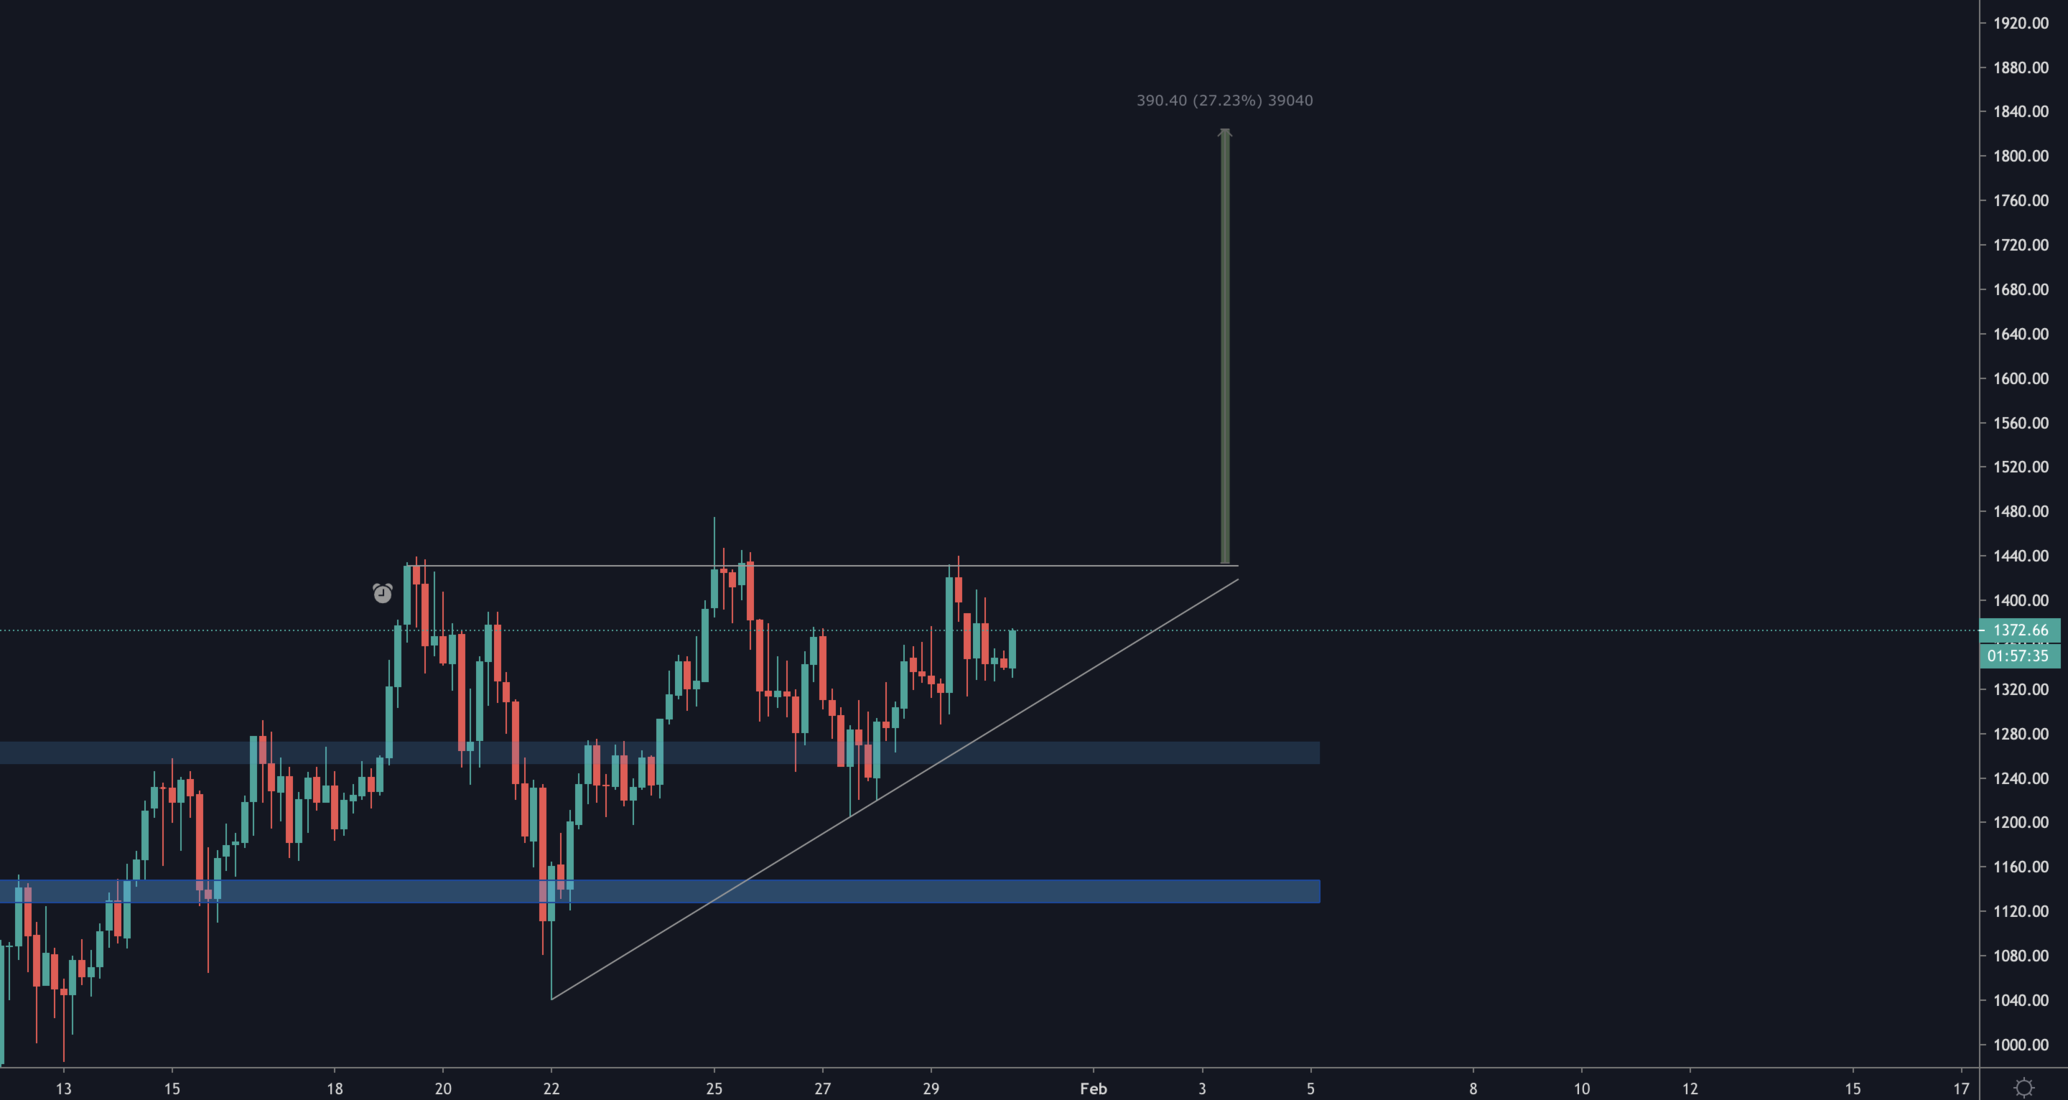
Now we go to the 4H timeframe to find the intricacies of price action and understand market participants' behaviour.
Price is building an ascending triangle. For anyone who is not familiar with TA, this pattern is characterised by higher lows and a horizontal resistance.
What this means from a logical perspective is the following: Sellers want to get their orders filled at $1,430 (in this case) and buyers keeping bidding higher and higher prices - hence the creation of higher lows. What this indicates is more conviction and power coming from buyers than the stagnant sellers. Eventually this balance breaks; it tends to break to the upside.
The target of such a pattern is measured by taking (resistance - first low), which is this case gives us a target of $1,825.
The starts have aligned for ETH.
XRP

Recommended from Cryptonary


