Log in

Save 23% ($351) & Get a Free 1-1 Call with our Team ⏰ : 0d 2h 59m 44s

Home
Research
Analysis
Community
  1. Cryptonary
  2. Market Analysis
  3. Meme Coins on the rise: Gigachad and Lock-In hold strong
Technical Analysis

Meme Coins on the rise: Gigachad and Lock-In hold strong

Published: Nov 11, 2024
0
Share:

As meme coins heat up, Gigachad and Lock-In defend key levels, with support holding firm and bullish patterns setting the stage for potential new highs.

Post Feature Image

Disclaimer: This is not financial or investment advice. You are responsible for any capital-related decisions you make, and only you are accountable for the results.


Gigachad:

Overview

Gigachad ($GIGA) has been a standout performer within the Solana meme coin sector, steadily climbing over recent months. Starting its rally in September from a market cap of approximately $100 million, Giga has demonstrated strong price action, characterised by continuous higher highs and higher lows.

This has solidified its position as a leading meme asset, showing resilience through various resistance levels as it scales.

Daily time frame analysis

  • Market structure: Since initiating its rally from around $100 million in September, Giga has consistently maintained an upward trajectory. One of the initial major resistances was the $300 million market cap, which was decisively broken on the upside. However, this level did not act as a retest support; the price continued moving higher without revisiting it, highlighting strong upward momentum.
  • Key support at $481 million: The next significant resistance was at the $481 million market cap. Once Giga surpassed this level, it eventually turned into a solid support zone, with the price consolidating above it for an extended period. This area has since become a dependable base for further upward movement, indicating buyers' commitment at this price level.
  • Current price action: As of now, Giga is trading within the range of $481 million to $664 million, with $481 million acting as robust support. The $664 million market cap has been a resistance zone and, if broken, could lead to a retest of its previous high of around $861 million.
  • Bullish trendline: Giga has followed a steady bullish trendline throughout its rally, which has provided consistent support along its path. Maintaining above this trendline will be critical for sustaining the bullish structure.
GigaSOL price chart on the daily timeframe, showing steady uptrend with key support levels at $481 million and $664 million.

Potential scenarios

  • Upside potential: If Giga breaks above the $664 million resistance, we could see a move toward its previous high of $861 million. A confirmed breakout above this level would indicate strength and open the potential for further exploration in price discovery.
  • Downside risks: If the price fails to hold the $481 million support zone, the next area to watch would be around $300 million, though it was not previously tested as support. A breakdown from the trendline and significant support levels would signal a shift in momentum and could lead to a broader pullback.

Cryptonary's take

Giga continues to exhibit strong price action, supported by key levels and a well-established trendline. While meme coins are inherently volatile, Giga's consistent demand and support zones provide a favourable outlook. Investors should, however, remain cautious of its high volatility and consider broader market conditions when evaluating positions.


Lock-in:

Overview

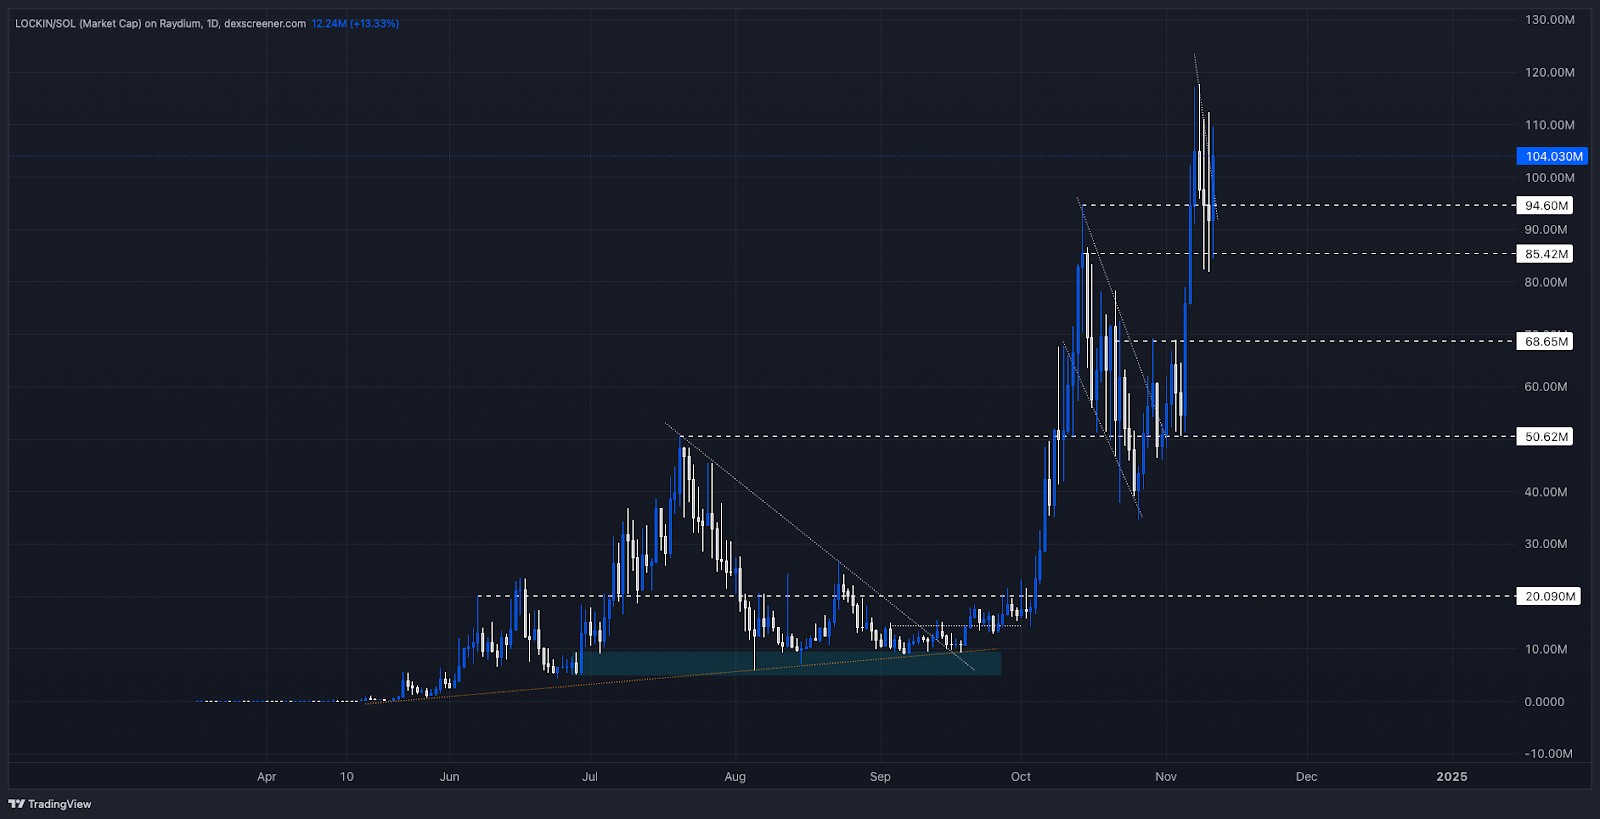
Lock-In has shown substantial growth recently, showcasing strong bullish momentum through higher highs and higher lows. Since October 1st, the token has experienced impressive swings, climbing from under $20 million to a peak of around $117 million market cap in mid-October. This rally reflects a solid interest in Lock-In, and the recent retracement may set the stage for further upward movement.

Daily time frame analysis

  • Bullish swings: Lock-In initially surged by approximately 500% in early October, moving from under $20 million to around $94 million in market cap. After a brief pullback, the price rebounded sharply to reach $117 million, a significant jump of 240%.
  • Support and resistance zones: Currently, Lock-In is trading at around $103 million, showing an attempt to hold support levels between $94 million and $85 million. These levels are essential for establishing a base and may act as strong footholds if the price maintains above them.
  • Potential downside supports: Should the current support levels fail, Lock-In may revisit the $68 million zone, with $50 million acting as further downside support if needed.
LockInSOL price chart on the daily timeframe, highlighting bullish momentum and major support levels at $94 million and $85 million.

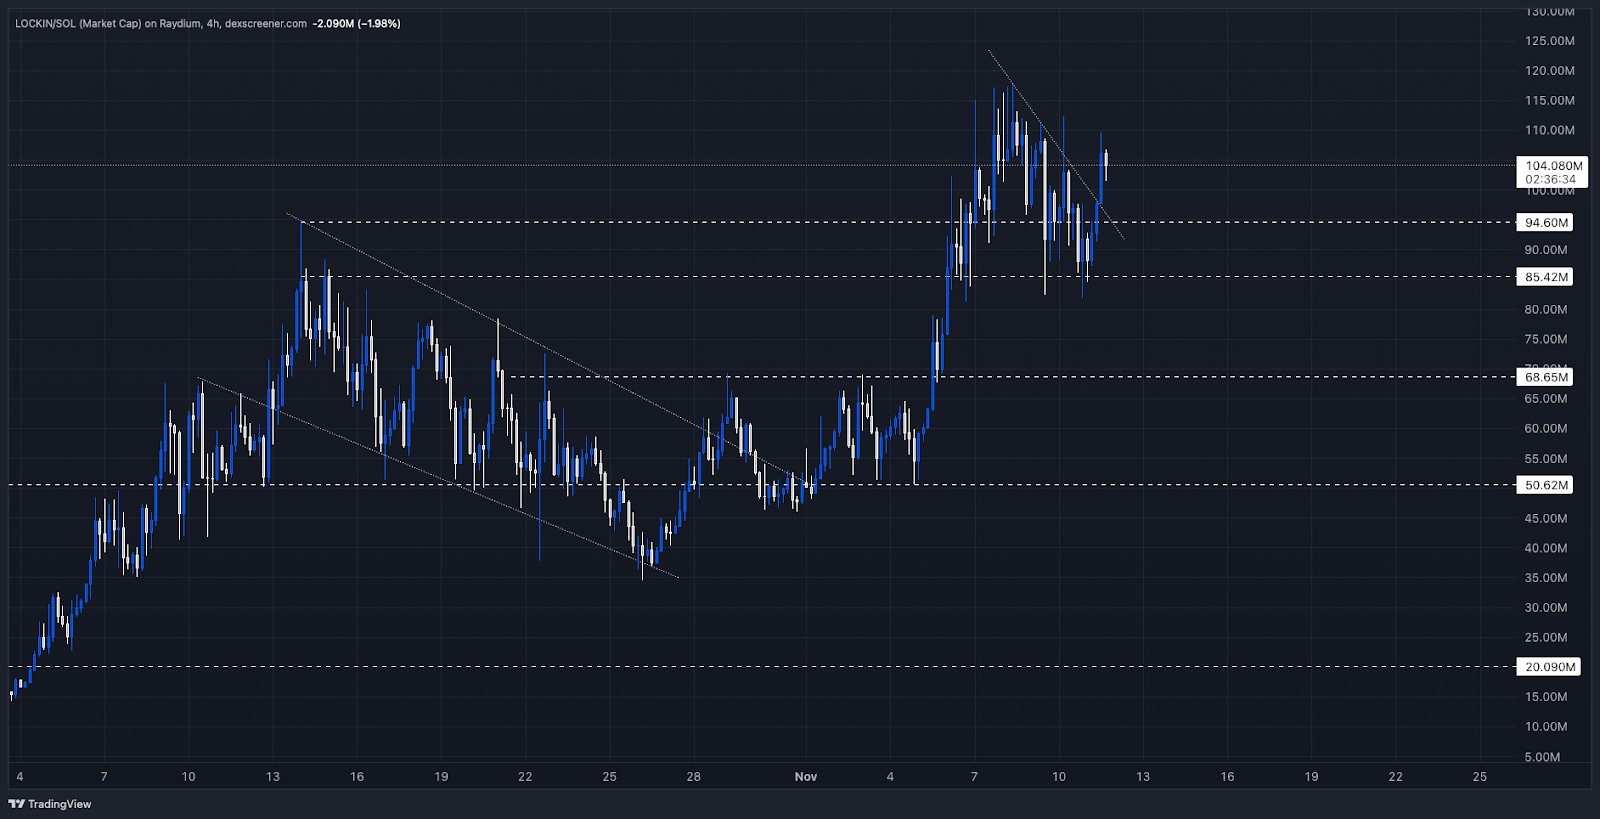
4-Hour time frame analysis

  • Bullish flag formation: On the 4-hour time frame, Lock-In recently broke out of a bullish flag that had been in play for over 15 days. This pattern suggested a consolidation phase, which ultimately led to a breakout, pushing Lock-In past the $68 million mark and later toward its recent high of $117 million.
  • Current price action: Lock-In is trying to sustain above the $94 million mark. If this level holds as support, it could signal another potential leg up. Conversely, a dip below this zone might see Lock-In retracing towards the $68 million mark or even the $50 million support area if the broader market retraces.
LockInSOL 4-hour timeframe chart showing bullish breakout and support levels around $94 million, $85 million, and $68 million.

Conclusion

Lock-In continues to display bullish characteristics, with solid support zones providing potential springboards for further upward movement. Should it maintain above the $94 million level, a continuation to the upside seems likely, setting up another potential rally.

Get started for free

Create your free account or log in to read the full article.

​

Netherlands

By signing up, you agree to our Terms & Conditions
Recommended from Cryptonary
BTC, ETH and More: Crypto Structure Diverges, Bitcoin Remains Fragile
PRO
Market Direction
BTC, ETH and More: Crypto Structure...Over the past week, downside played out where expected, but follow-through has been inconsistent, wi...
11 min read
Mar 24, 2026
Market Update: Risk Assets Rebound Amid Tightening Conditions
PRO
Market Updates
Market Update: Risk Assets Rebound ...The market just gave us a perfect example of how fragile this environment is. Escalation over the we...
8 min read
Mar 23, 2026
BTC, ETH and More: Stablecoin Dominance Signals Downside
PRO
Market Direction
BTC, ETH and More: Stablecoin Domin...A more fragile backdrop is beginning to show. With the Fed turning less supportive and stablecoin do...
13 min read
Mar 20, 2026
BTC, ETH and More: Short-Term Upside Liquidity in Play
PRO
Market Direction
BTC, ETH and More: Short-Term Upsid...Markets are pausing at key levels, and the next move is starting to take shape. After completing the...
13 min read
Mar 31, 2026
Market Update: Fed in a Bind & Bitcoin at a Breaking Point
PRO
Market Updates
Market Update: Fed in a Bind & Bitc...Markets are turning fragile as escalating Middle East tensions drive a clear risk-off shift, tighten...
8 min read
Mar 30, 2026
Market Update: Macro Risks Signal Further Downside
PRO
Market Updates
Market Update: Macro Risks Signal F...Earlier in the week, we had a lot of questions about whether we still see the $50k-$60k level being ...
11 min read
Mar 27, 2026
BTC, ETH and More: Crypto Structure Diverges, Bitcoin Remains Fragile
PRO
Market Direction
BTC, ETH and More: Crypto Structure...Over the past week, downside played out where expected, but follow-through has been inconsistent, wi...
11 min read
Mar 24, 2026
Market Update: Risk Assets Rebound Amid Tightening Conditions
PRO
Market Updates
Market Update: Risk Assets Rebound ...The market just gave us a perfect example of how fragile this environment is. Escalation over the we...
8 min read
Mar 23, 2026
BTC, ETH and More: Stablecoin Dominance Signals Downside
PRO
Market Direction
BTC, ETH and More: Stablecoin Domin...A more fragile backdrop is beginning to show. With the Fed turning less supportive and stablecoin do...
13 min read
Mar 20, 2026
Research
Top PicksDeep DivesPassive IncomeAirdrop ReportsMemecoins
Analysis
Market UpdatesMarket DirectionMarket PulseLivestreams
Tools
Market DirectionAssets & PicksAirdropsPortfolio Tracker
Cryptonary
Affiliate programEducationPrivacy PolicyTerms & ConditionsContact UsWrite for usTeam
Stay connected
Disclaimer: The information provided on this website is for educational and informational purposes only and does not constitute financial, investment, legal, or tax advice. Cryptonary is not a licensed financial advisor. All content is shared without any guarantee of accuracy or completeness. You are solely responsible for your investment decisions. Always do your own research and consult with a licensed professional before making financial choices. Past performance is not indicative of future results.

×
popupimage
Our Latest Utility Token Research ReportPreviously locked for Pro members, now available to read in full.
  • tickThe utility token we're tracking closely
  • tickWhy we believe it's still early in the cycle
  • tickWhat we're watching to confirm a structural shift
​
Netherlands

No spam. No hype. Just the research.