With the recent Binance listing of POPCAT, the cat meme narrative has hit a new milestone, and other cat-themed coins like Mini are expected to follow suit. Despite being only about 100 days old, Mini has shown impressive early performance and potential within the cat-themed coin ecosystem.
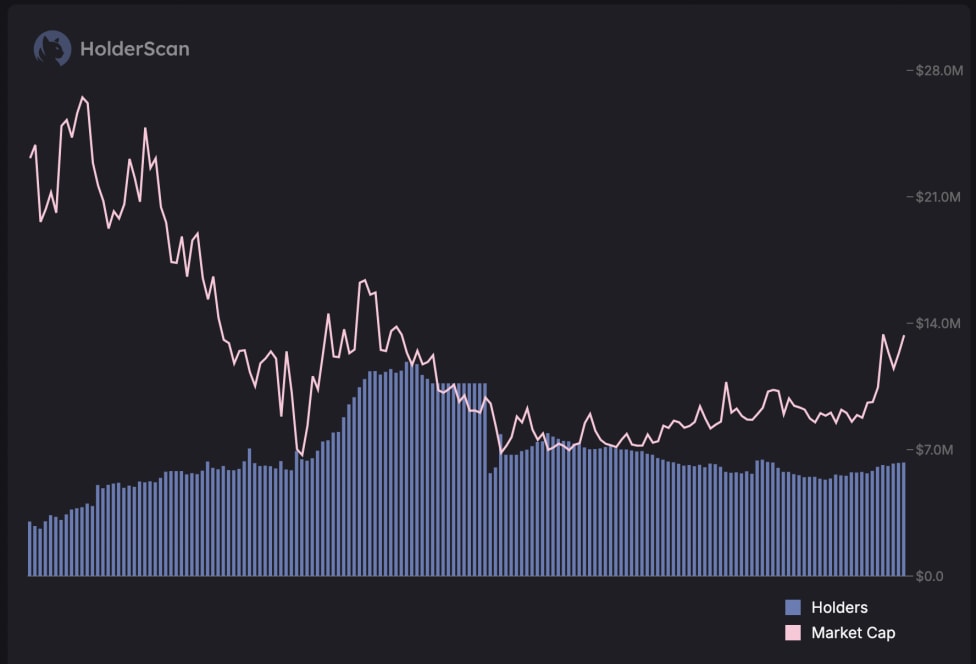
Holder count vs. market cap analysis: Over the past 30 days, the chart clearly illustrates a two-phase movement in Mini’s market cap and holder count.
First half (Bloodbath for market cap): In the initial 15 days of the period, Mini’s market cap experienced a significant decline, reflective of broader market conditions. Despite this sharp drop, the holder count continued to increase steadily. This divergence suggests that new investors were entering the market, seeing the dip as a buying opportunity, and seizing the chance to accumulate Mini at lower prices. The increase in holders during a period of falling market cap is typically a positive sign, indicating growing interest and belief in the asset's long-term potential.
Second half (Stabilisation): The latter half of the 30-day period shows a relatively flat trend for both the market cap and the holder count. This suggests that the market reached a stabilisation point, with fewer new investors entering, but also with current holders maintaining their positions rather than selling off. This plateau could indicate that the market is waiting for a new catalyst or breakout move, which could either reignite interest or solidify the current support levels.
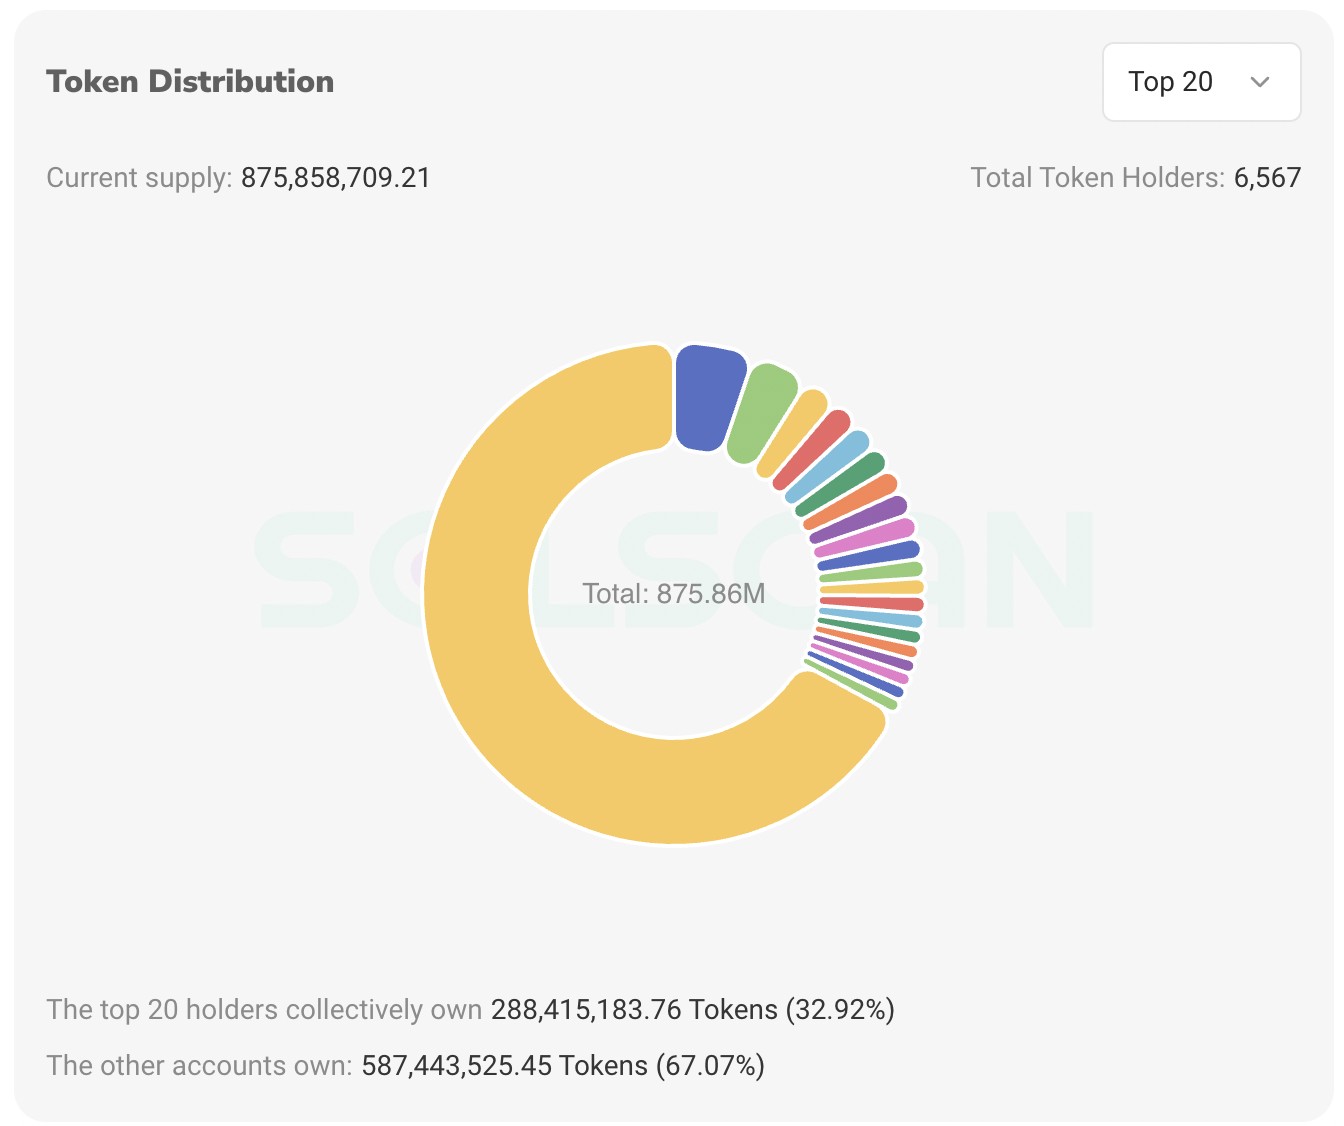
Token distribution analysis
Top 10 wallet holder breakdown: Excluding the largest holder, which is the Raydium liquidity pool for Mini, the next largest holders (from position 2 through 11) collectively own between 1.08% and 3.27% of the supply. This means that even though some wallets hold a larger portion of the supply, there is no overwhelming centralization of ownership, helping to maintain overall stability.

Top 20 and Top 100 wallets: The top 20 holders of Mini collectively own 288,415,183.76 tokens, which accounts for 32.92% of the total supply of 875,858,709.21 tokens. This concentration level is notable but expected for a newer coin, suggesting that while there are key significant holders, the token distribution is still relatively healthy.
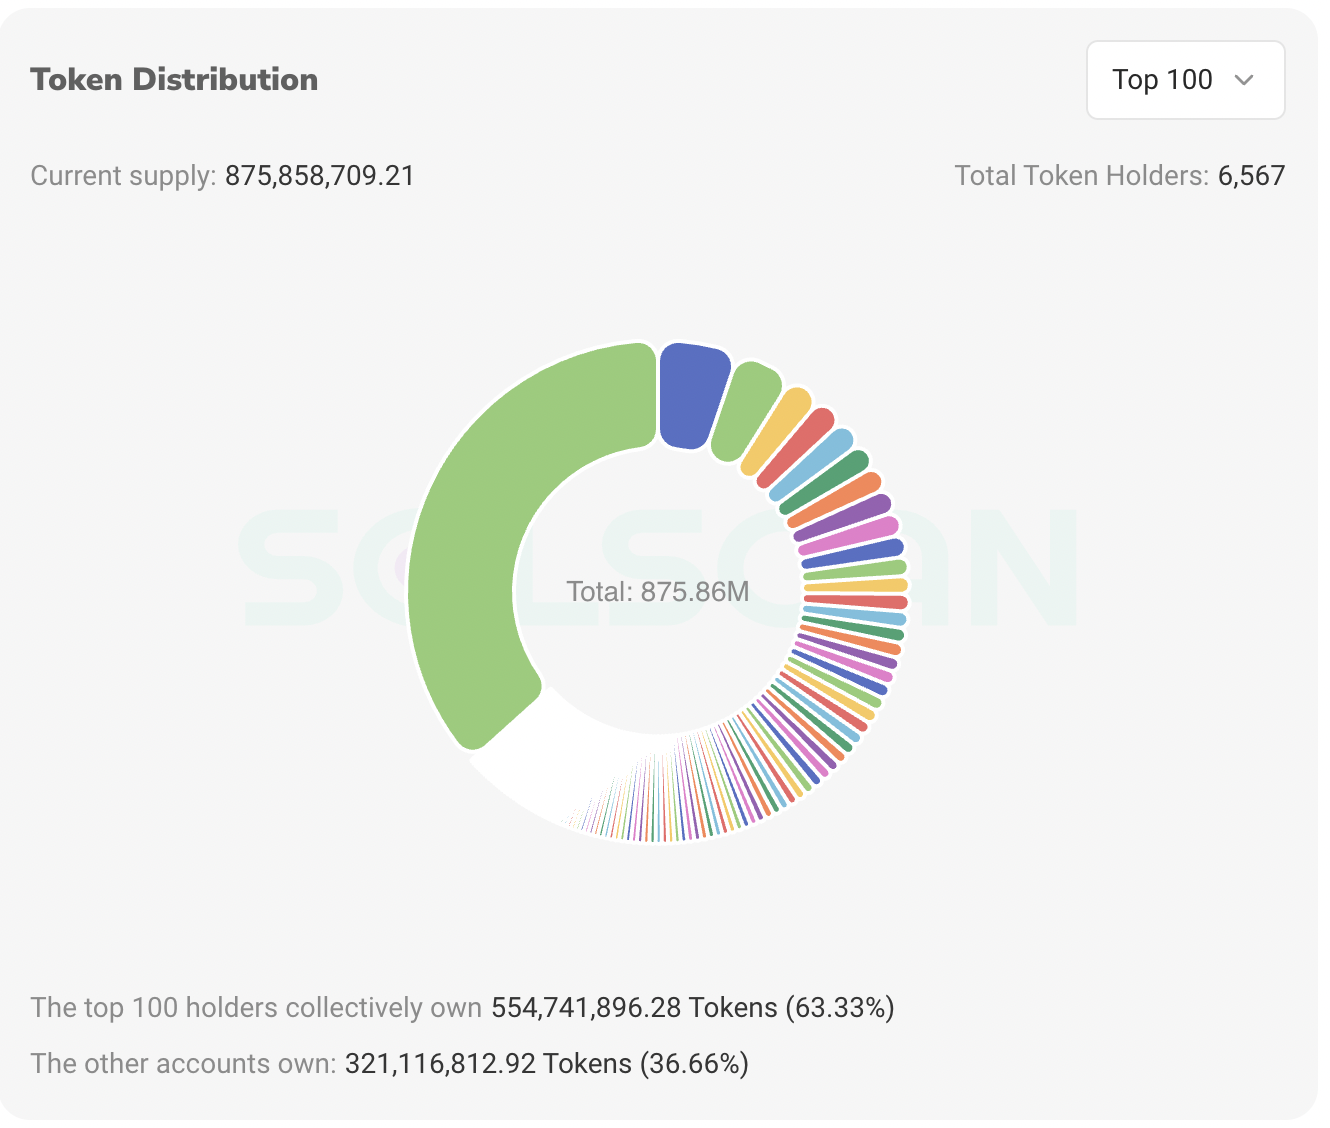
The top 100 holders control 554,741,896.28 tokens, or 63.33% of the total supply. While this shows a higher concentration of ownership, it also indicates that a significant portion of the token supply remains spread across a larger base of holders.
Historical rally analysis
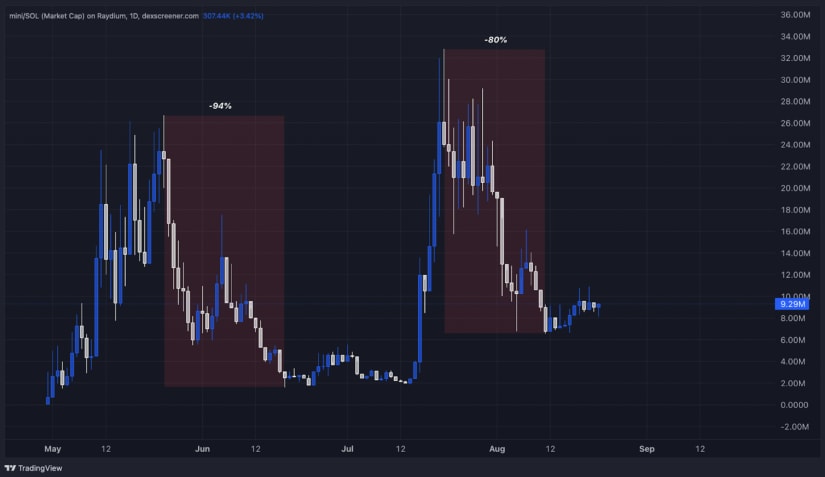
First rally ~Timeframe: April 30th to May 24th, 24 days ~Performance: Mini's first rally was exceptional, achieving a staggering 50,000%+ gain in just 24 days. This rally pushed Mini to a market cap of $26 million, marking its first significant entry into the meme coin scene.
Second rally ~Performance: After the first pullback, Mini experienced a second rally, posting an impressive 2,000% move that pushed its market cap above $32 million, further cementing its status as a strong player within the meme coin space.

Historical pullback analysis
~First pullback: After the first massive rally, Mini saw a sharp 95% correction, which brought the market cap down to around $1.5 million. This pullback was significant but typical of meme coins, which often experience extreme volatility following large rallies.
~Second pullback: The second pullback followed the second rally and saw Mini's market cap drop by 80% to around $6.5 million. Despite this correction, the coin appears to be forming a local bottom, which could signal the potential for another move higher as the market structure begins to stabilize.
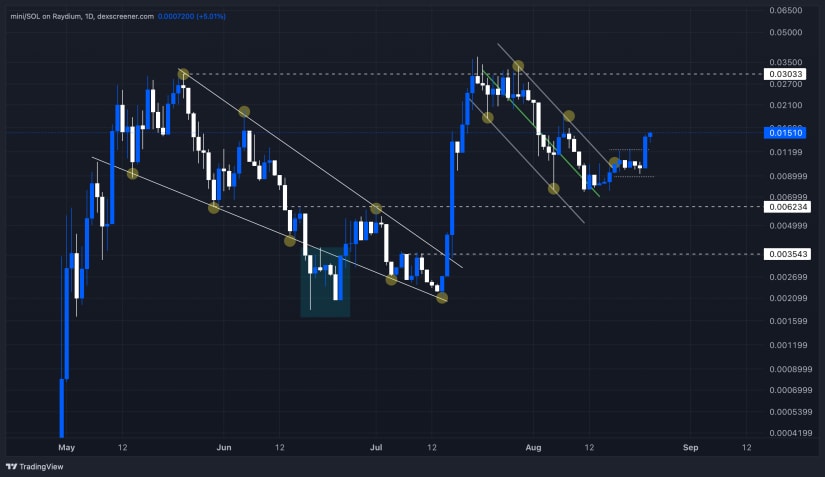
Current market structure and outlook Logarithmic chart analysis:
Looking at Mini’s logarithmic chart provides a clearer understanding of the coin’s movement. After the first rally, Mini entered a falling wedge pattern, trading within this channel until it eventually broke out and reclaimed new highs. Notably, there was a small squeeze in the price below the $0.0035 level before it broke out of the wedge and surged 200%.
In recent developments, Mini has successfully broken to the upside of its consolidation phase following the breakout from the bull flag. This bullish move has resulted in a significant price increase, with Mini currently up 100% from its local bottom of $0.0076. The breakout confirms the bullish sentiment that was anticipated, especially given the strong cat meme narrative currently driving the market.
Key levels to watch:
~Support levels: If Mini breaks to the downside, key DCA (Dollar-Cost Averaging) zones to watch are $0.006 and $0.0035, which have historically acted as strong support and resistance.
~Market cap: With the market cap currently just above $10 million, Mini remains a low-cap gem within the cat meme sector. This presents a high-risk, high-reward scenario for investors.
Overall sentiment:
The current breakout has solidified Mini's position within the market, and the bullish narrative surrounding cat-themed tokens remains strong. As the broader market continues to support this narrative, Mini could see further upward momentum, particularly given its relatively low market cap and the recent 100% price surge.
Cryptonary's take
Mini has quickly established itself as a strong contender in the cat meme coin space, with recent technical developments reinforcing its bullish potential. The token distribution remains balanced, and the current breakout highlights the coin's ability to capitalise on market momentum.
However, it's important to note that Cryptonary has no financial interest in Mini. This analysis is provided purely for educational purposes, and Cryptonary has not invested in this asset. The high-risk nature of meme coins remains, and we advise investors to exercise caution and conduct thorough research before considering any involvement.