Save 23% ($351) & Get a Free 1-1 Call with our Team ⏰ : 0d 2h 59m 44s
Momentum builds for BTC, ETH, and key Altcoins
Crypto markets are important for BTC, ETH, SOL, WIF, POPCAT, and SPX. Bitcoin holds $87K in support, ETH stays above $2,875, and SOL aims for $255. WIF is steady at $3.40, POPCAT targets $2, and SPX finds support around $0.50. Big moves could be coming!
Disclaimer: This is not financial or investment advice. You are responsible for any capital-related decisions you make, and only you are accountable for the results.
BTC:
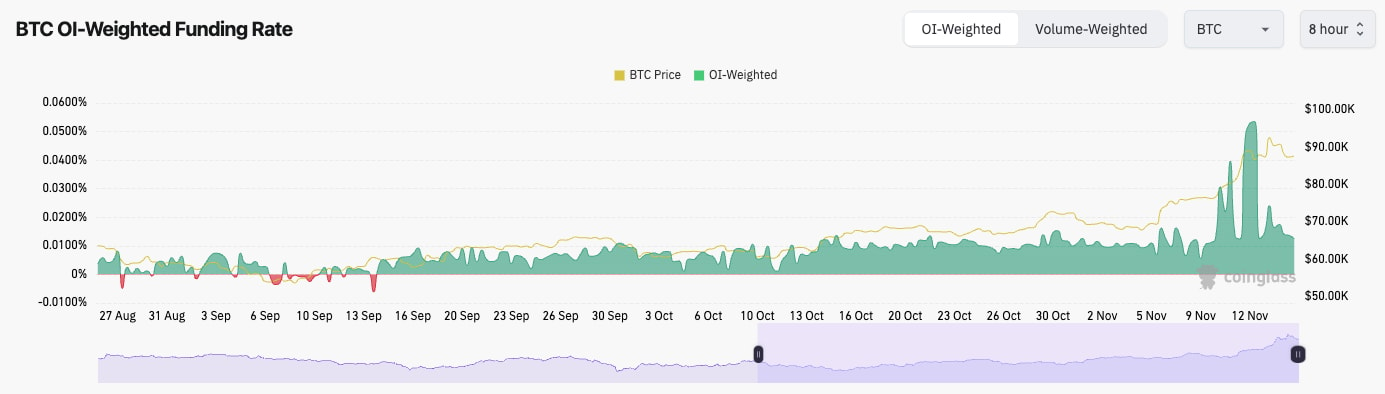
- BTC's Open Interest still remains high (as measured by the number of coins), suggesting there's still a lot of leverage in the system here.
- BTC's funding rate has been substantially reset, meaning that there is a more even balance between Longs and Shorts. This is a healthier leverage setup than when Funding was 5/6 times the current level.
Technical analysis
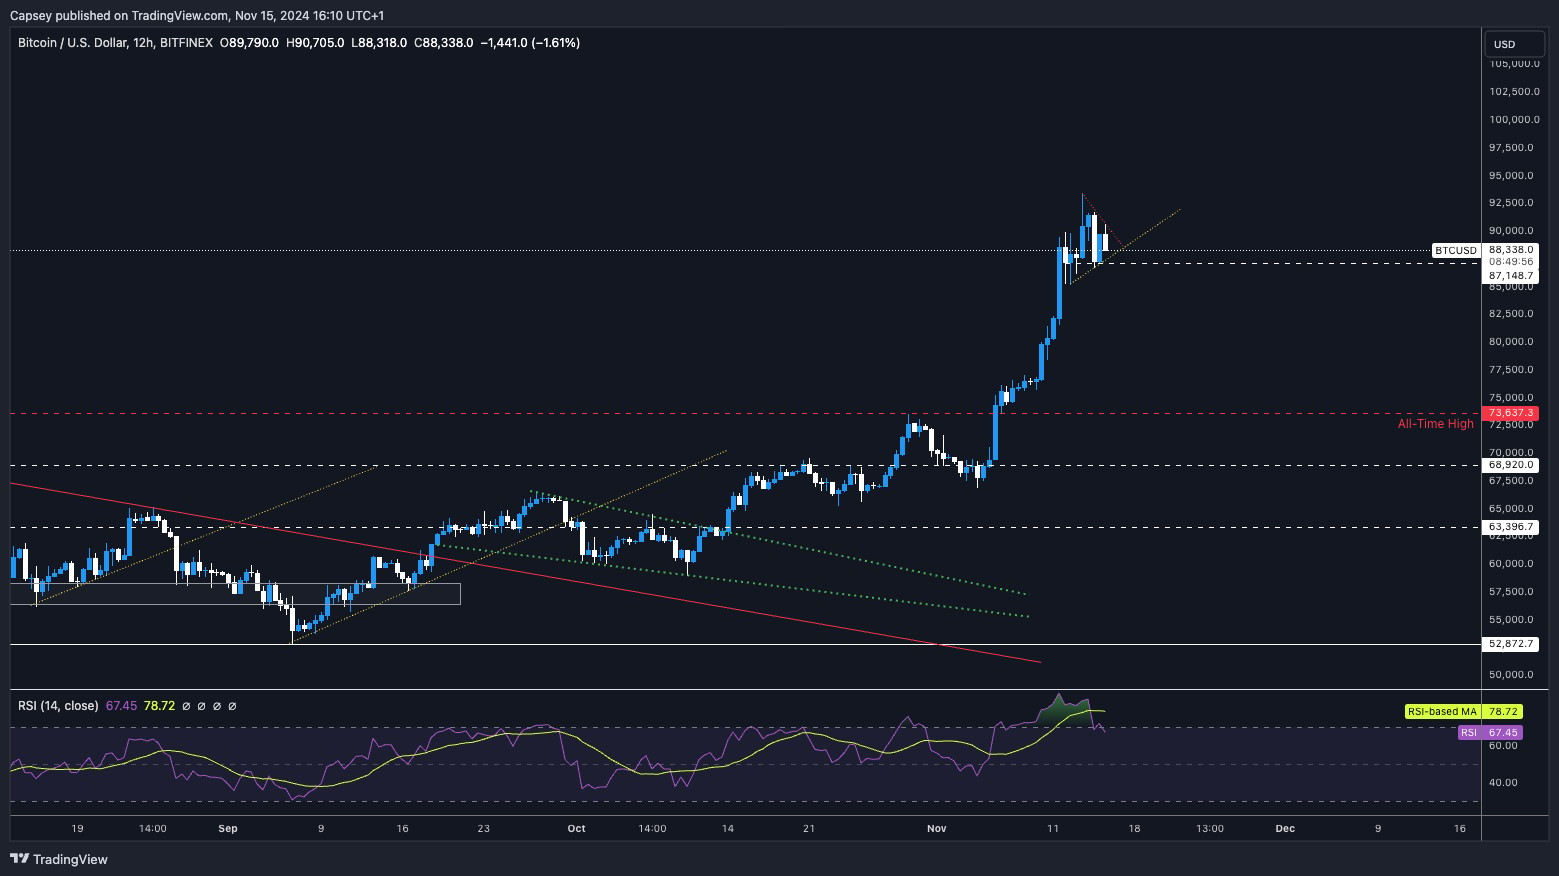
- For the TA, we will look to the 12-hour timeframe just to get more information, as the move-up has essentially been a straight move-up. Zooming in slightly helps us to identify levels.
- On the 12hr, BTC has formed a bearish divergence (a new high in price whilst putting in a lower high on the oscillator). This bearish divergence has also been printed in overbought territory in both the 12-hour and the daily timeframes.
- Local support is at $87,000, whilst the deeper level for a pullback might be around $82k. However, it's very hard to identify a clear, deeper level.
- To the upside, the all-time high of $93,300 is the level for the price to clear above.
- BTC is potentially forming a bullish pennant despite the bearish divergence. If this pattern played out, we'd likely see BTC break to the upside.
- Next Support: $87,000
- Next Resistance: $93,300
- Direction: Neutral/Bullish
- Upside Target: $93,300 (then $100k)
- Downside Target: $87,000
Cryptonary's take
There are two key contrasts here currently: the bullish pennant and the bearish divergence. Both have opposite results. Market momentum suggests more upside, but the extremity of the move suggests a small pullback. It's very difficult to know which will play out here, and unfortunately, we can't see one outcome favouring the other here. Sorry guys.Personally, I (Tom) think a pullback to $82k - $85k, somewhere in there, would be positive for us in the medium term. This would reset some of the indicators and also prolong retail piling back into the space.
A grind higher is better for higher prices than a quick cycle blow-off top. Even though a pullback might be possible, it would be extremely risky to sell Spot positions here. We're certainly not doing that. We're holding and seeing what the next days/weeks give us. We're expecting much more upside in the coming weeks, even if we have a week of consolidation.
ETH:
ETH's Open Interest remains extremely high and at all-time highs in USD value and by the number of ETH. Like BTC, ETH's Funding Rate has also pulled back to more sensible and therefore healthy levels. This is positive.ETH's funding rate: 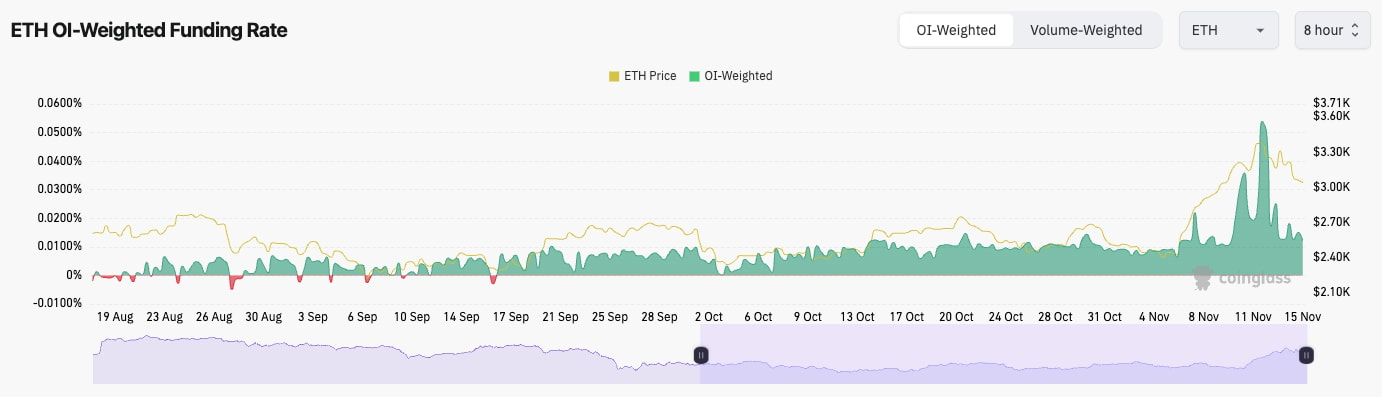
Technical analysis
- Even though ETH's move was also mostly straight up, we're referring back to the Daily timeframe for the ETH chart.
- ETH moved into the range between two key levels: $3,280 and $3,480. ETH couldn't sustain in this higher range and has since pulled back.
- It's possible that the psychological level of $3,000 acts as local support for ETH. However, the major support for ETH is at $2,875.
- ETH was very overbought, but via pulling back, the RSI has reset more meaningfully, and it's back in the middle territory and finding support on its moving average. This is better and needed.
- On the upside, it's likely that $3,280 to $3,480 will be more significant resistance for ETH to overcome.
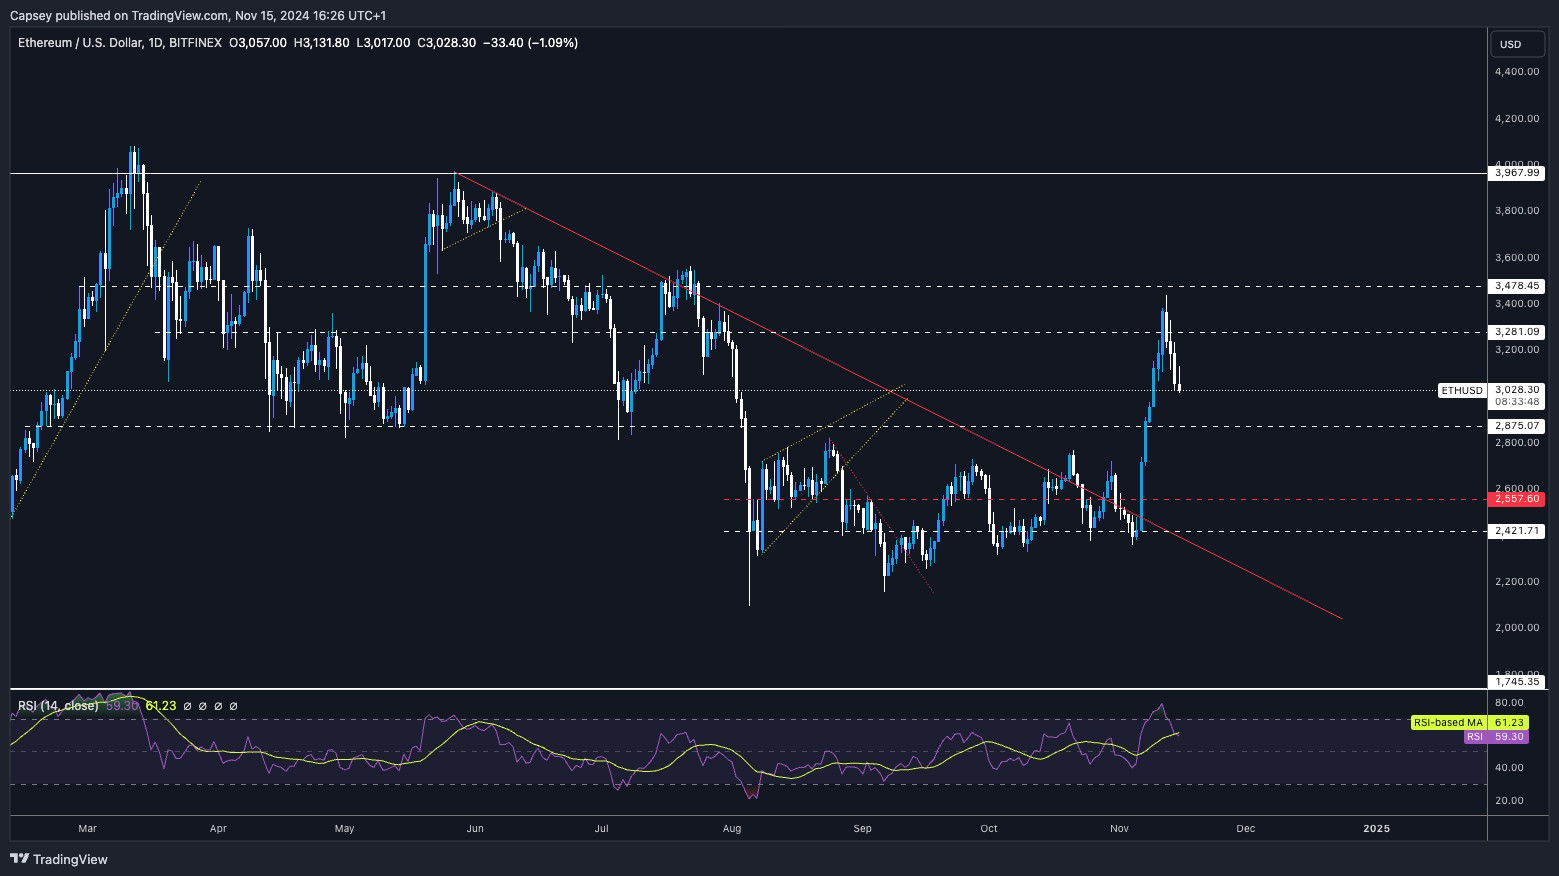
- Next Support: $3,000
- Next Resistance: $3,280
- Direction: Neutral
- Upside Target: $3,280 (then $3,480)
- Downside Target: $2,875
Cryptonary's take
It was a massive move higher for ETH, so it could be expected that some of that move is given back, which we're seeing now. Since pulling back, some of the indicators have reset from very overbought levels, and ETH is close to approaching an area of support.We expect ETH to hold above $2,875 and potentially find support in that range between $2,875 and $3,000. Let's see if we get that over the coming days/week. We're not looking to sell any Spot ETH, and we're looking to hold through this period, which we merely see as a small pullback in a wider bull market.
SOL:
- SOL's Open Interest is at record highs in USD value, and it's at cycle highs measured by coins (this excludes when SOL was sub $20, as the coin was so much cheaper, so less money was needed to take on more leverage, measured by coins).
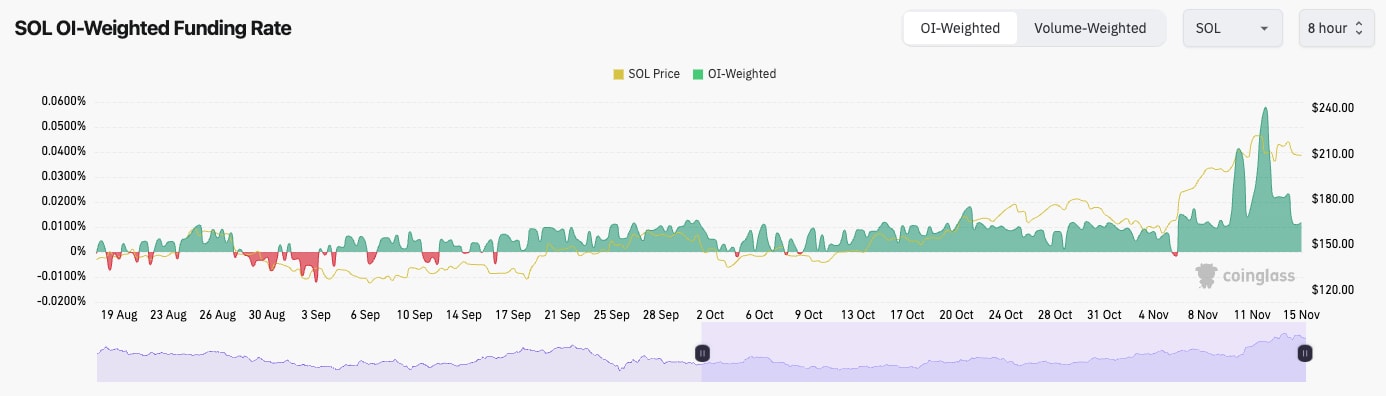
- SOL's funding rate has reset substantially, and it's now back to normal levels. A 10% price pull-down has flushed out some of the over-levered Longs.
Technical analysis
- SOL is forming a bullish pennant above the prior horizontal resistance, which is now acting as new support ($203).
- The RSI has also pulled back from overbought territory; although it still remains quite high, it is now finding support on top of its moving average.
- If the $203 horizontal support is lost, we'd expect the $185 to $190 to be the next major level of support, and we'd be extremely surprised if the price fell below this level.
- On the upside, the resistances are at $220, and then the prior cycle's all-time high is $255.
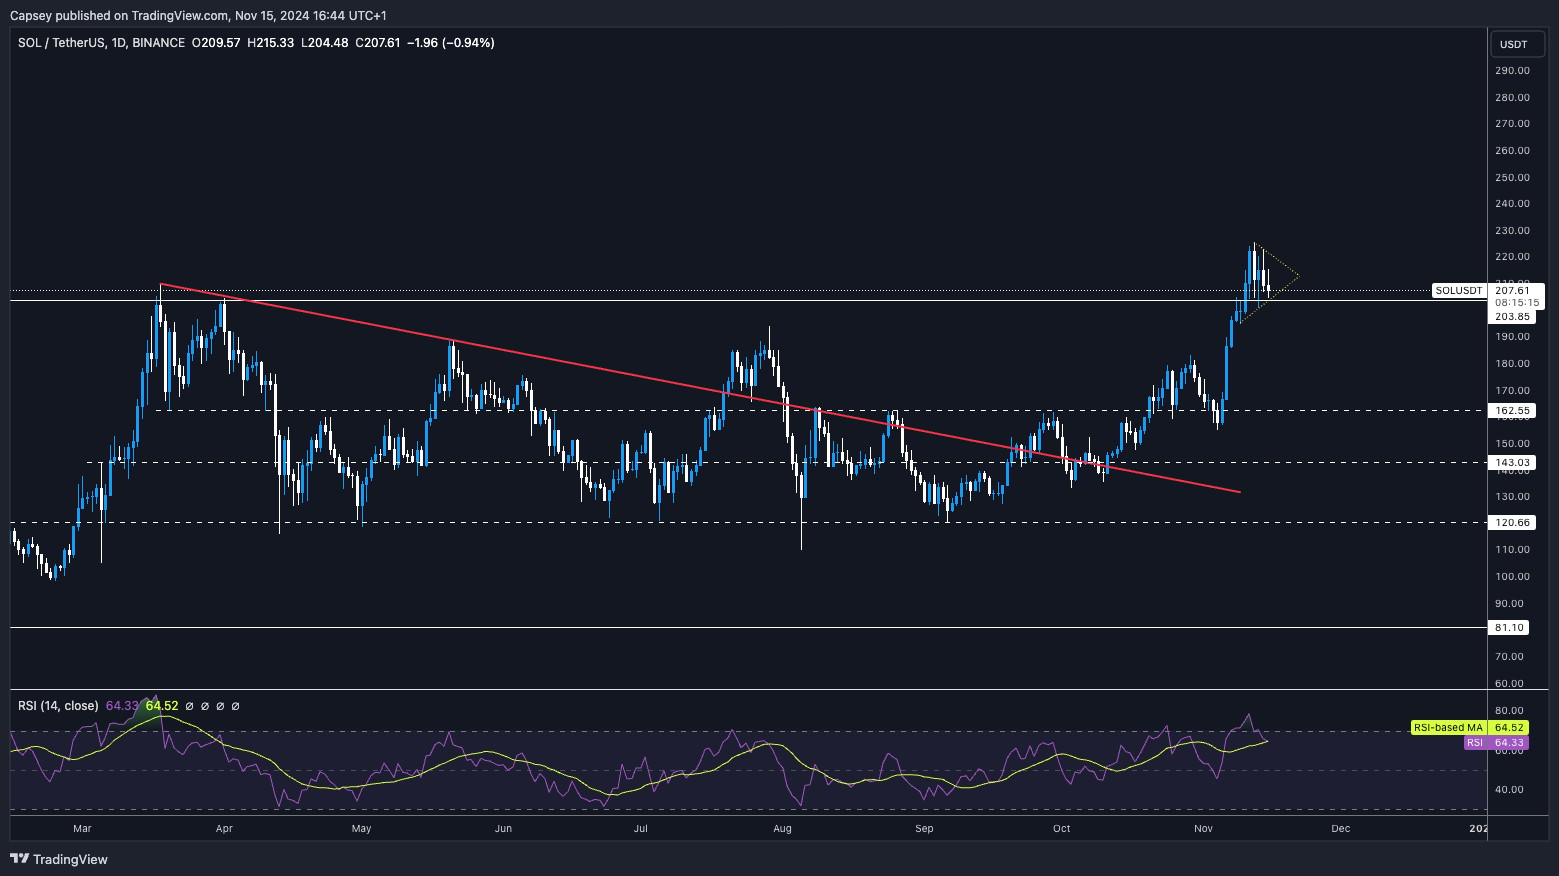
- Next Support: $203
- Next Resistance: $220
- Direction: Bullish
- Upside Target: $255
- Downside Target: $185 - $190
Cryptonary's take
SOL looks to be one of the better charts here. It's holding above key horizontal support for now, and it has built some support above that level ($203). Price is also in the formation of a bullish pennant, which has a bias to break to the upside.Meanwhile, the indicators that were overbought have been more meaningfully reset. If BTC doesn't get a more meaningful pullback and it can maintain its current level, SOL is potentially set up here to break out to the upside and run to the prior cycle's highs ($255). Let's see what the coming days give us.
WIF:
- It was a wicked move, all in all. And the price is much higher than a few weeks back, even with this pullback we're seeing currently.
- WIF was rejected at the candle body tops of its all-time high, and it has since pulled back to the horizontal support level of $3.40. Price is managing to hold this area as support for now.
- Below $3.40, there is another support at $3.05. We expect the $3.05 to $3.40 range to hold as support. We wouldn't be surprised if $3.40 itself acted as support before we see more upside.
- On the large move up, the RSI became tremendously overbought. However, that has since reset somewhat, but the RSI's moving average is still slightly lower, so it's possible there's slightly more room to pull back for price.
- On the upside, the resistance and the goal for the price to surpass are all-time highs.
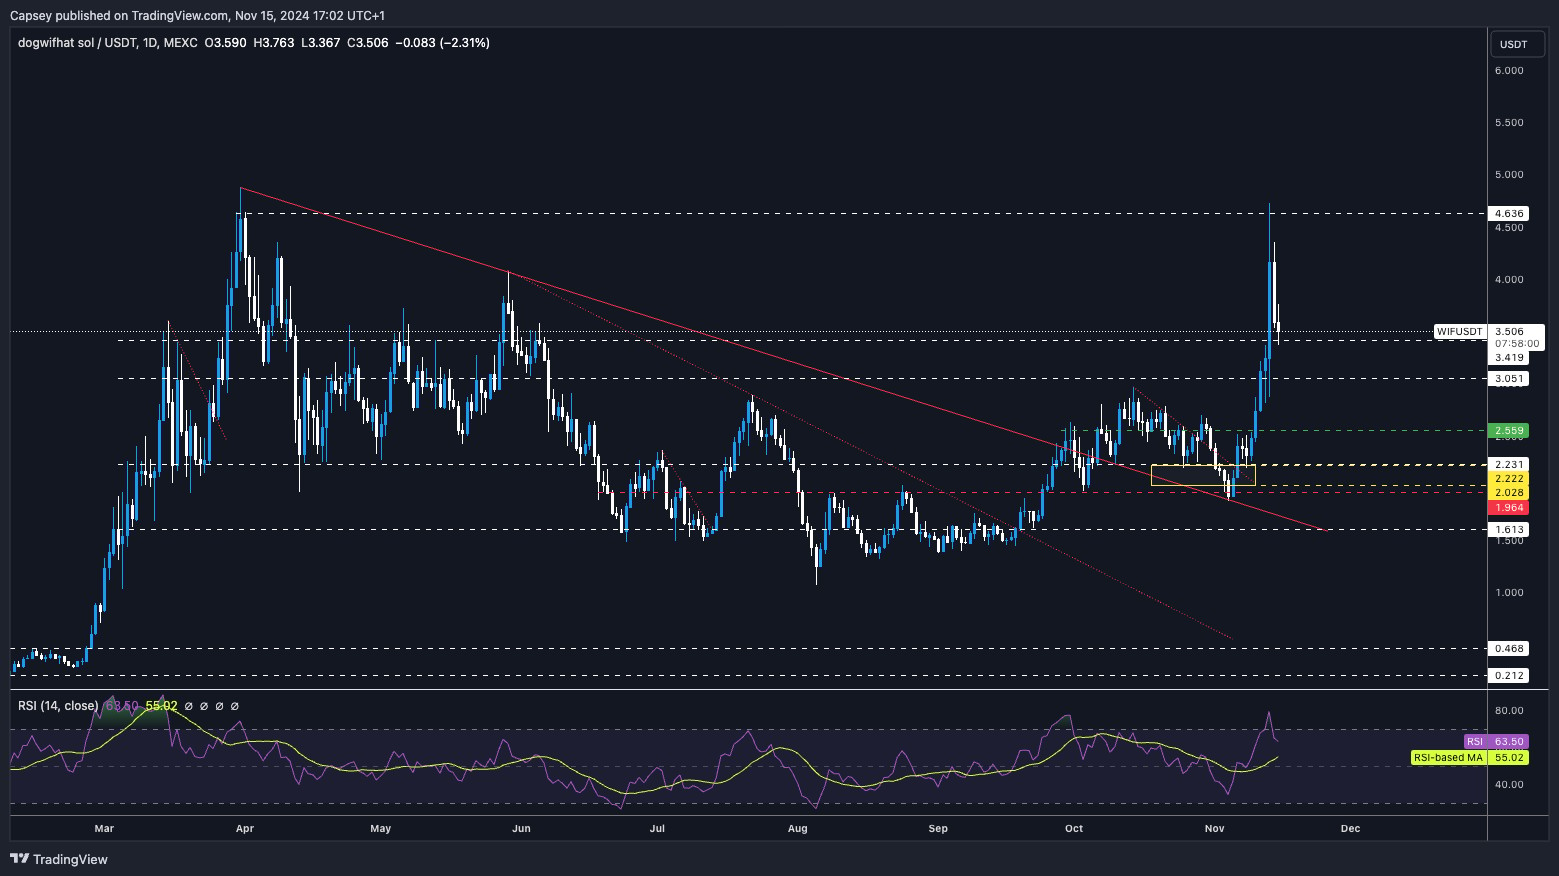
- Next Support: $3.40
- Next Resistance: $4.80
- Direction: Neutral
- Upside Target: $4.80
- Downside Target: $3.05
Cryptonary's take
Coinbase listing WIF is likely a sign that they see the market moving in a positive direction and retail likely coming back, and they want to capture the fees off of people who are trading it. After a massive move-up like we've seen, it's normal for the price to pull back.Price remains well above the levels we've seen it trading at in the last few months. We're expecting a period of consolidation for the price (maybe a week), and we expect this between $3.40 and $4.00. Beyond that, we expect the break out to be to the upside. We're holding Spot WIF positions, and we're expecting fireworks in the coming months. No plans to sell anytime soon.
POPCAT:
- A really tricky chart to work out here.
- Price managed to break out from the consolidation range between $1.40 to $1.60. However, the breakout went as high as $2.00 but couldn't break past that level.
- The RSI throughout has remained below overbought territory, and we haven't seen a parabolic move higher... yet!
- We're looking for POPCAT to continue with this consolidation, and now ideally above $1.60.
- If $1.60 is lost, we expect $1.40 to remain strong support.
- On the upside, it's clear. $2.00 is the level, and if it's broken to the upside, we could probably expect a strong move past it, maybe as high as $2.50.
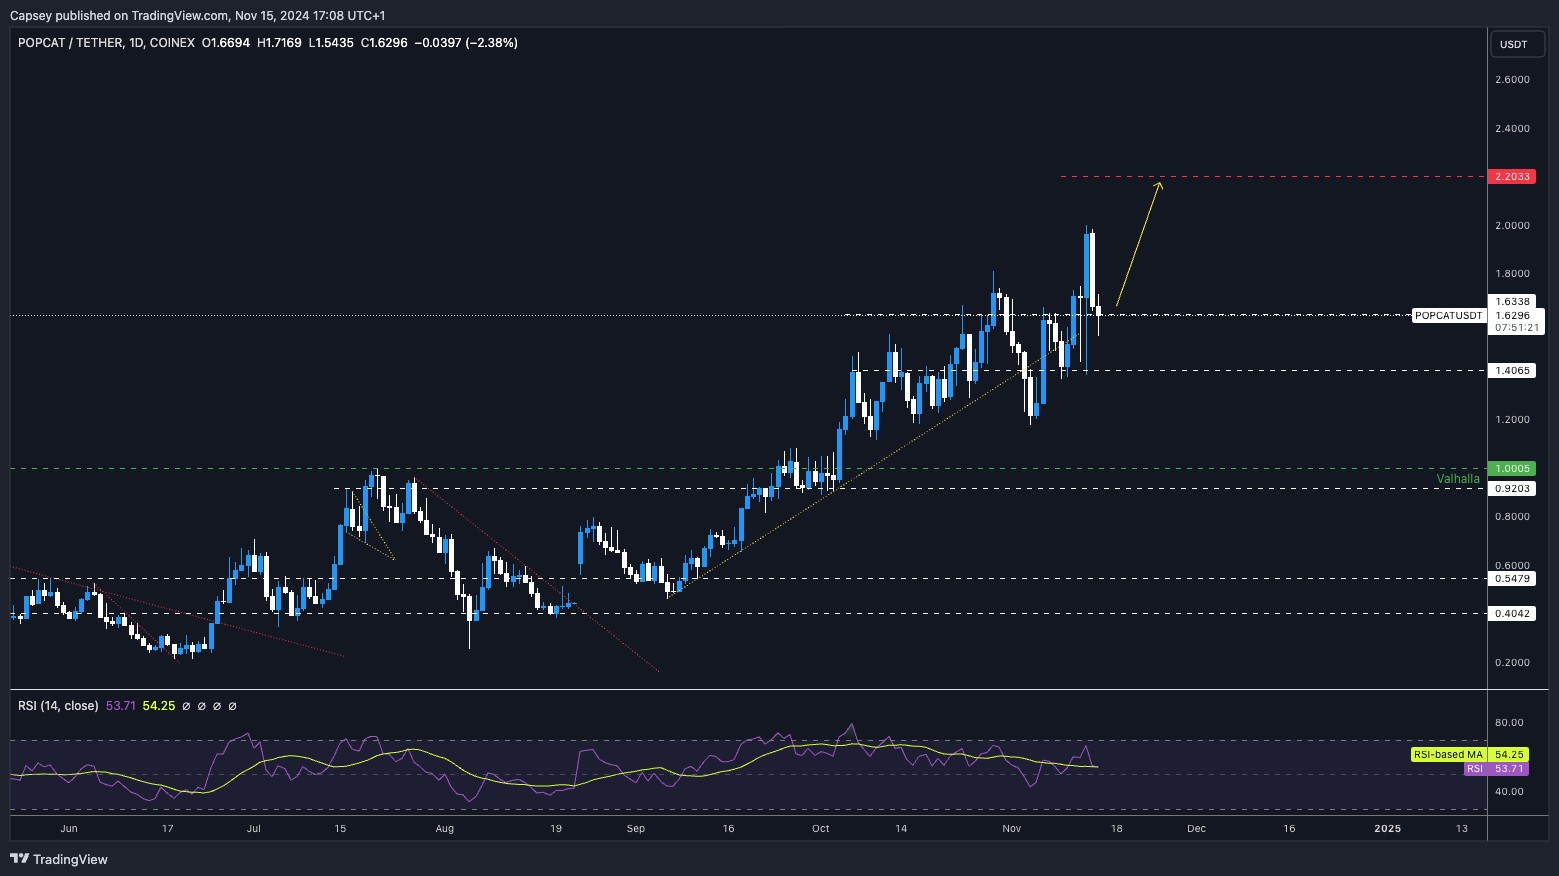
- Next Support: $1.60
- Next Resistance: $2.00
- Direction: Neutral
- Upside Target: $2.00 (then $2.50)
- Downside Target: $1.40
Cryptonary's take
We expect POPCAT to continue to consolidate in this higher range, potentially between $1.50 and $1.80 for the next week. However, if/when SOL breaks out, we would expect WIF and then POPCAT to swiftly follow once SOL slows down/consolidates. We remain in Spot POPCAT positions, with 0 plans to sell any time soon.SPX:
- SPX broke below its main uptrend line, and now it's had a trend continuation with its downtrend.
- Unfortunately, the support levels of $0.75 and then $0.65 were both lost. However, the $0.50 to $0.60 area has been a good area of support now, each time it's been tested.
- We can notice that there was increased volume over the last few days. However, this hasn't helped the price run more considerably to the upside, and the price is back down close to its low.
- It's possible that if the price visits $0.50 to $0.55 (a deviation below the lows), we might see bidders step in at those levels.
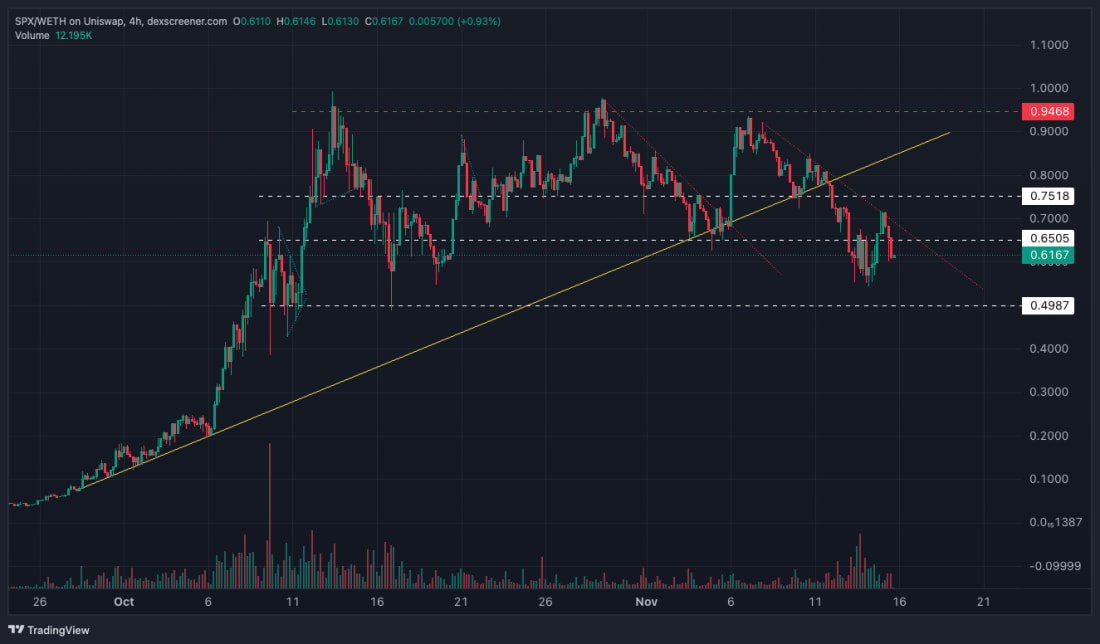
- Next Support: $0.50 - $0.55
- Next Resistance: $0.65
- Direction: Neutral/Bearish
- Upside Target: $0.75
- Downside Target: $0.50
Cryptonary's take
Charting-wise, it doesn't look great here. We've had other memes run more and hold up at higher price ranges (WIF, POPCAT), but SPX is back close to its lows. However, it's possible the area beneath the lows (so $0.50 to $0.55) might see longer-term bidders step in, as that's where the volume came in 48 hours ago. For those holding SPX as a company (Cryptonary), we believe in it as a long-term play, so for that reason, we're not looking to sell Spot bags here.Recommended from Cryptonary


