Save 23% ($351) & Get a Free 1-1 Call with our Team ⏰ : 0d 2h 59m 43s

Disclaimer: Not financial nor investment advice. You are responsible for any capital-related decisions you make, and only you are accountable for the results.
Summary for July ’22
- Total Market Cap – +22.46%
- Altcoins Market Cap – +26.15%
TLDR
- The smallest wallet cohorts are continuing to add both Bitcoin and Ether and most are adding at a more aggressive rate. The largest wallet cohorts are still yet to risk back on.
- The Realised Price by Address suggests that there may be some significant resistance to the upside between $23,455 and $28,855.
- The Hash Ribbon indicator shows that a miner capitulation is underway but has perhaps yet to have really got going. Miner capitulations are signs of late stage bear markets.
- Both majors have bounced off from their 2017, respectively 2018 all-time highs, suggesting strong demand at said levels.
Total Market Cap
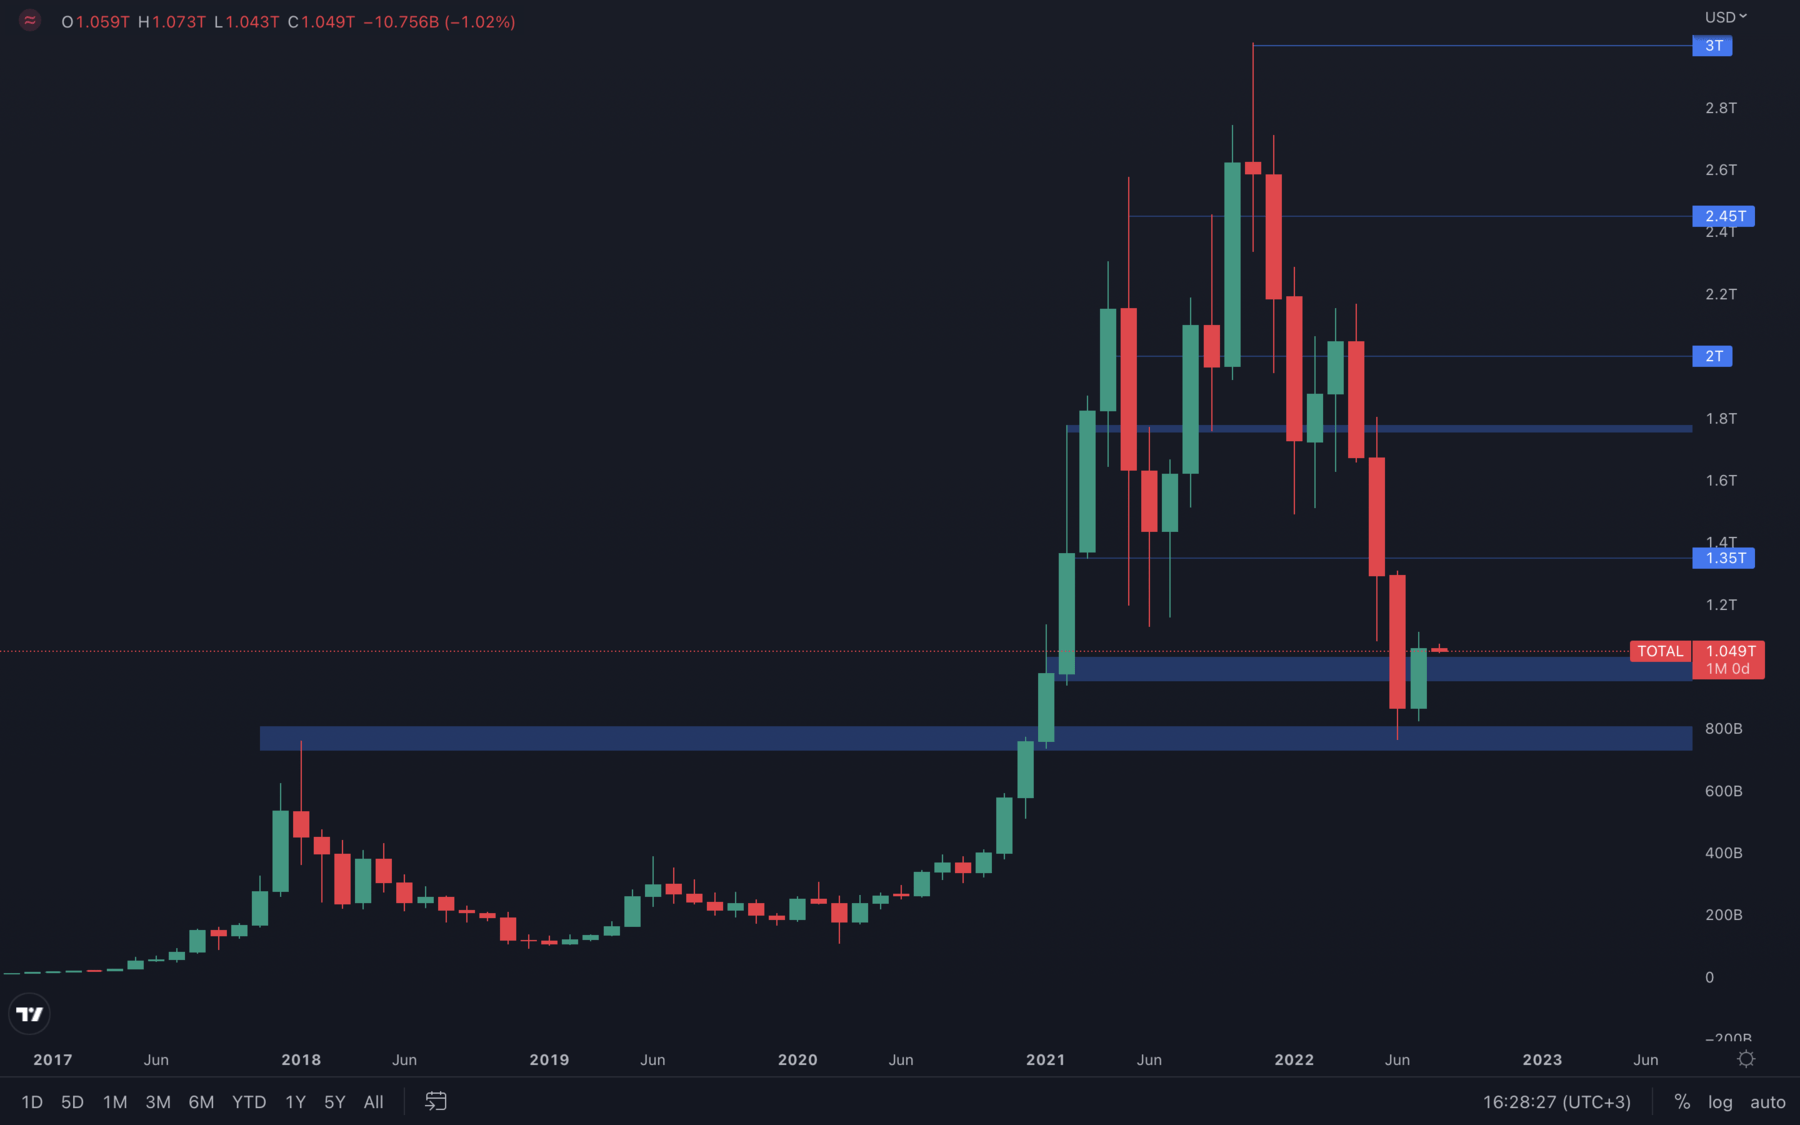
After three extremely difficult months, we’ve finally seen a bullish monthly candle. July closed with a +22% increase, above its psychological and technical resistance level of $1T. The monthly timeframe is the most powerful out of them all, and we’ve managed to reclaim one of the most important levels on the TMC chart.
With that said, the odds of a $1.35T test have now been increased and this is the level we expect the Total Market Cap will achieve during August unless a weekly loss of $950B occurs.
Altcoins Market Cap
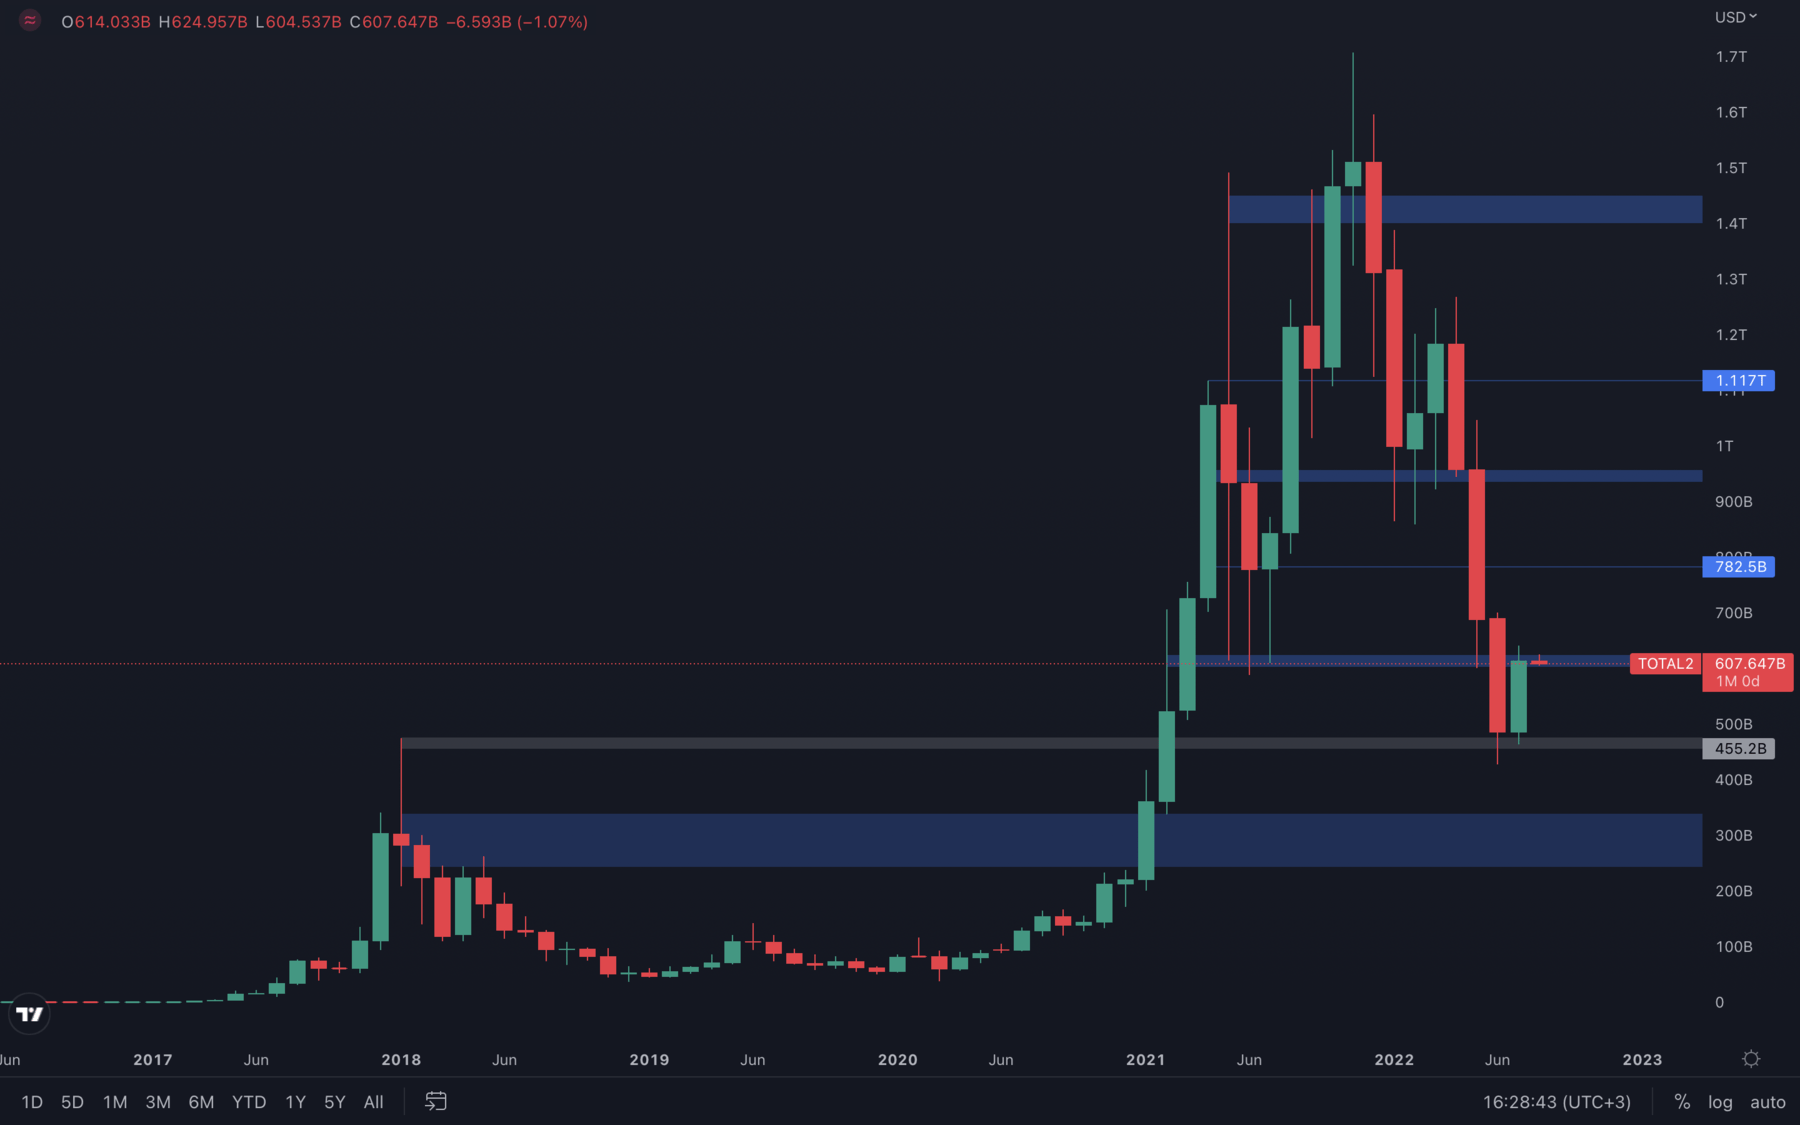
The Altcoins Market Cap index barely managed to reclaim its $600B level, which might suggest it will encounter difficulties rising further. Both daily & weekly timeframes are now showing signs of rejection upon test of the ~$600B level, and a weekly closure under $586B will result in a bearish engulfing candle that can bring the index towards $550B - $500B.
There's still a bit of uncertainty left, even with the Total Market Cap index reclaiming its $1T level. Keeping an eye out on both indexes and both majors will help us stay one step ahead.
Bitcoin - Technical & On-Chain Analysis
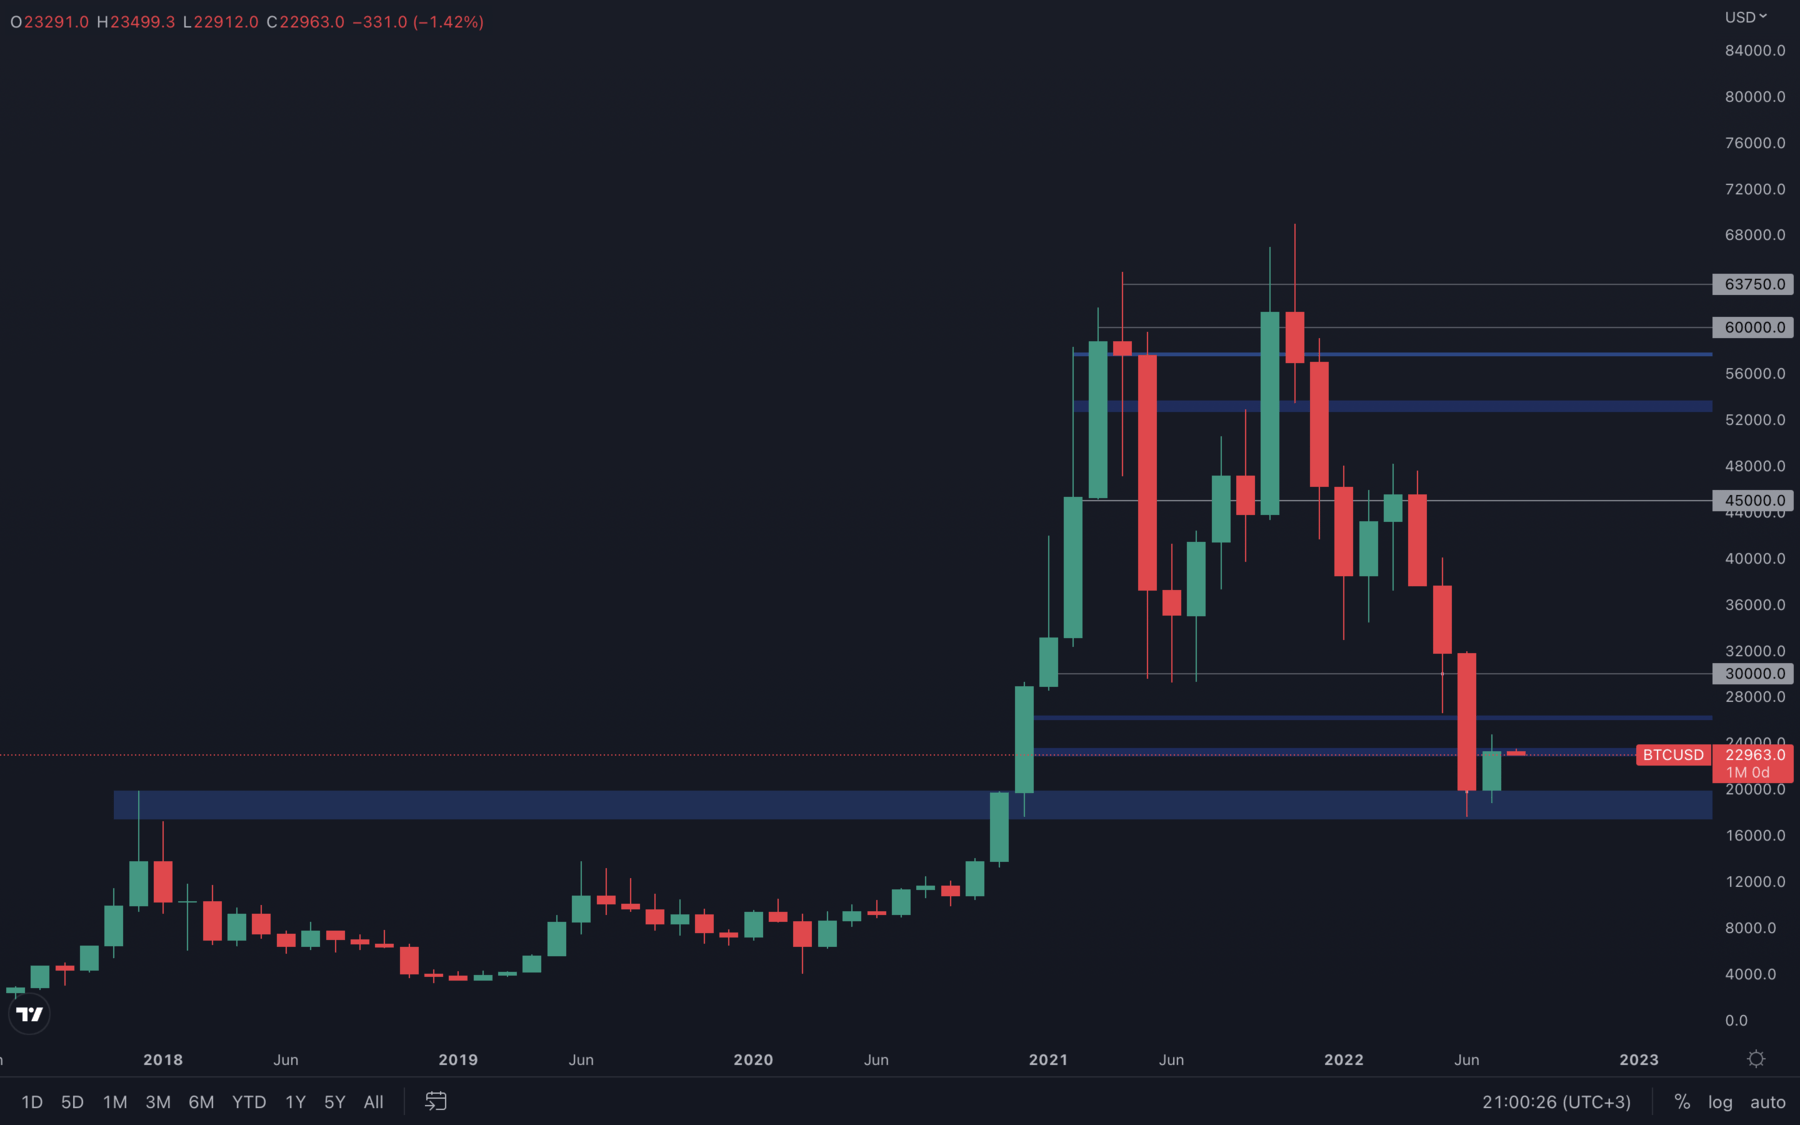
Bitcoin bounced perfectly from its 2017 all-time high, which, at least for now, invalidates any price movements under $20,000. On the contrary, Bitcoin is now on a path to $30,000, a psychological and technical level that might not be reached due to the lack of conviction in the markets. However, with $26,000 as an intermediate level between the current price and Bitcoin’s $30,000 resistance level, it’s safe to assume that $26,000 is where the price will encounter difficulties and start to descend, as there isn’t any significant volume to sustain moves higher.
On another note, July closed just under resistance. This can also be interpreted as a warning sign, for us not to get ahead of ourselves and expect further upside just yet. Same as on the Altcoins MCap index, it's actually fairly easy for Bitcoin to form a bearish engulfing candle on the weekly timeframe, which will bring its price towards a new higher low at around the $21,000 level.
Metric 1 – Addresses
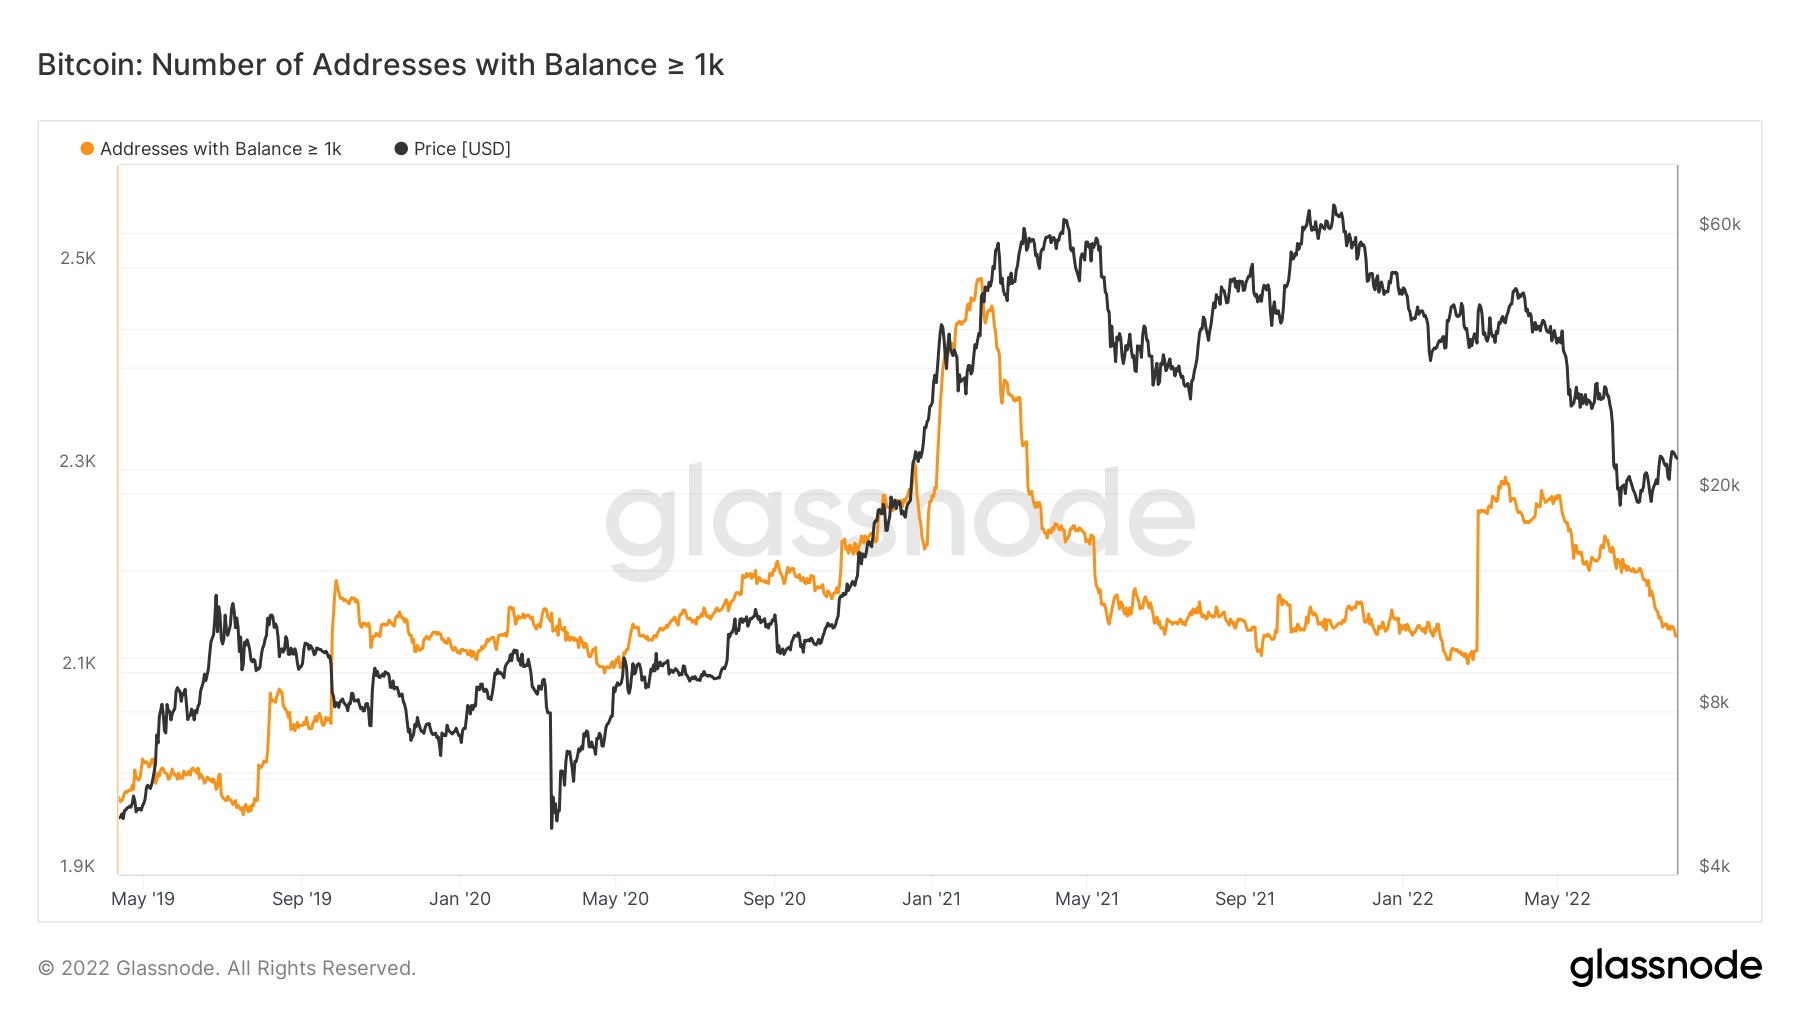
Over the past month, perhaps one of the most important cohort of metrics is the Addresses metrics. The wallet groups with the smaller amounts of coins are usually emotional to changes in price and hence this is reflected in the risk-on (buy coins) and risk-off (sell coins) of these groups. We, therefore, concentrate on the ‘Addresses with Balances > 1,000 Bitcoin’ and the ‘Addresses with Balances > 1,000 Ether’ as they have been better at predicting the best times to risk-on and risk-off.
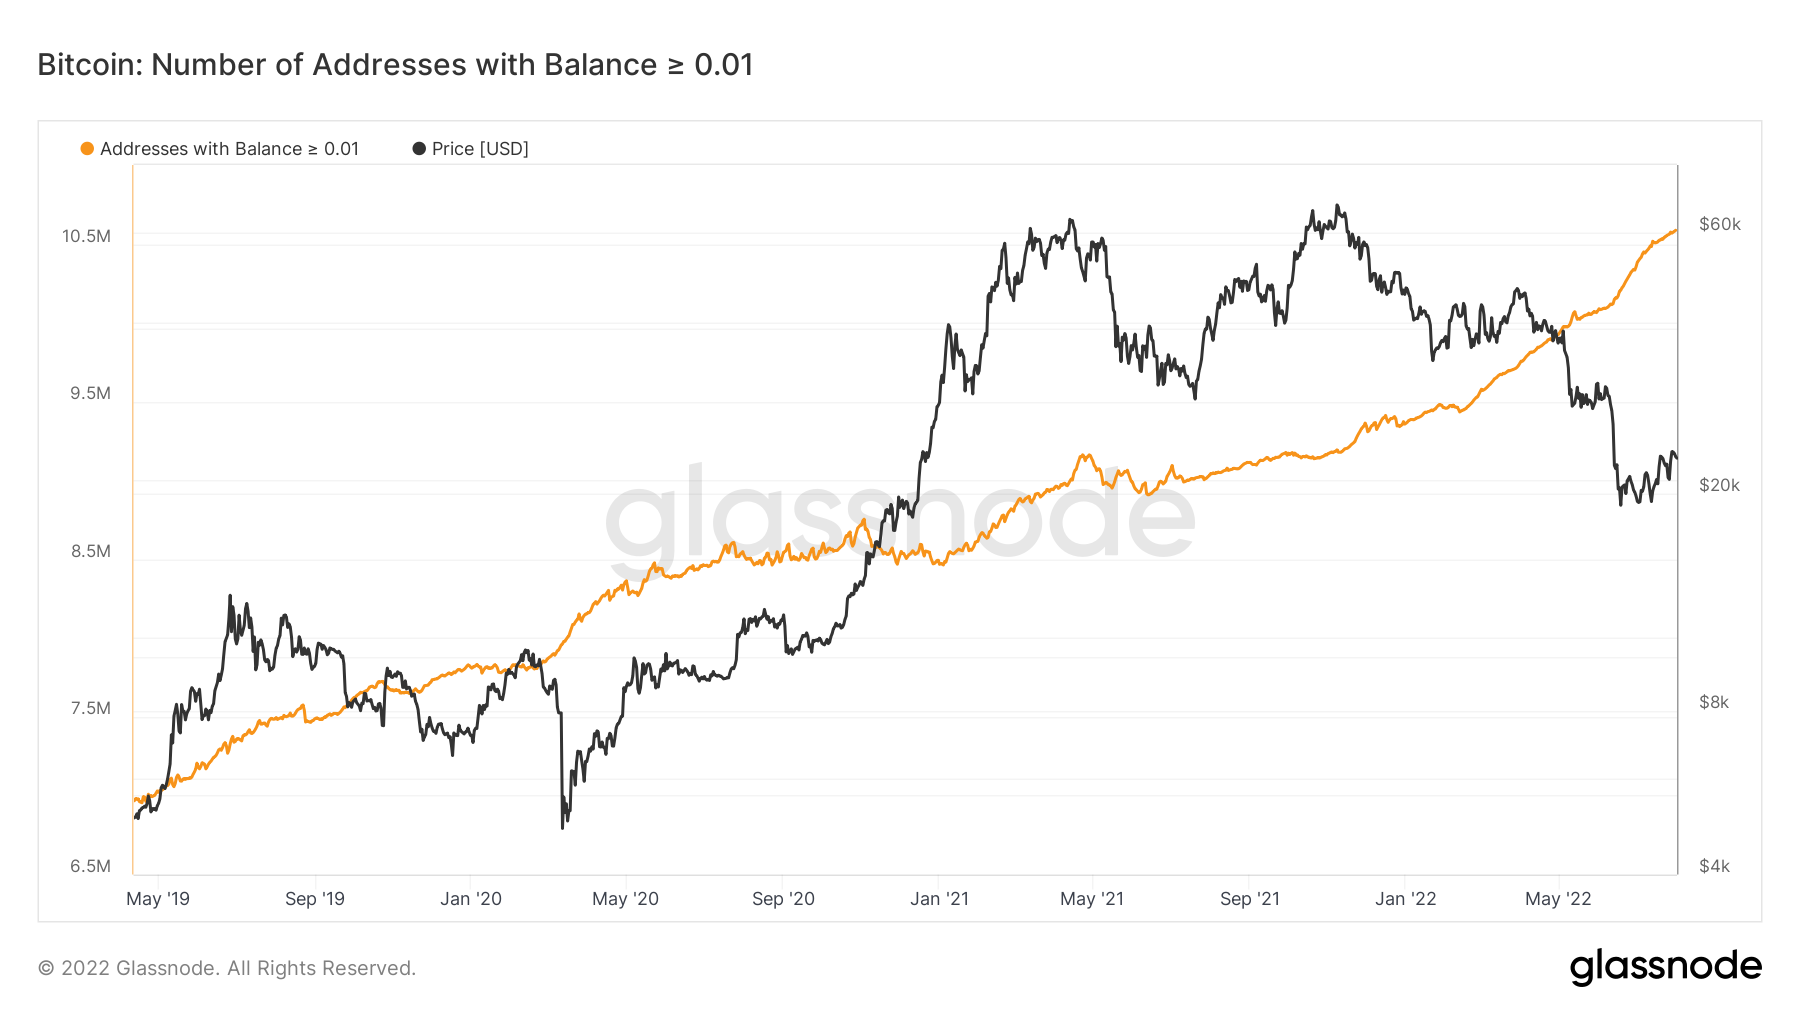
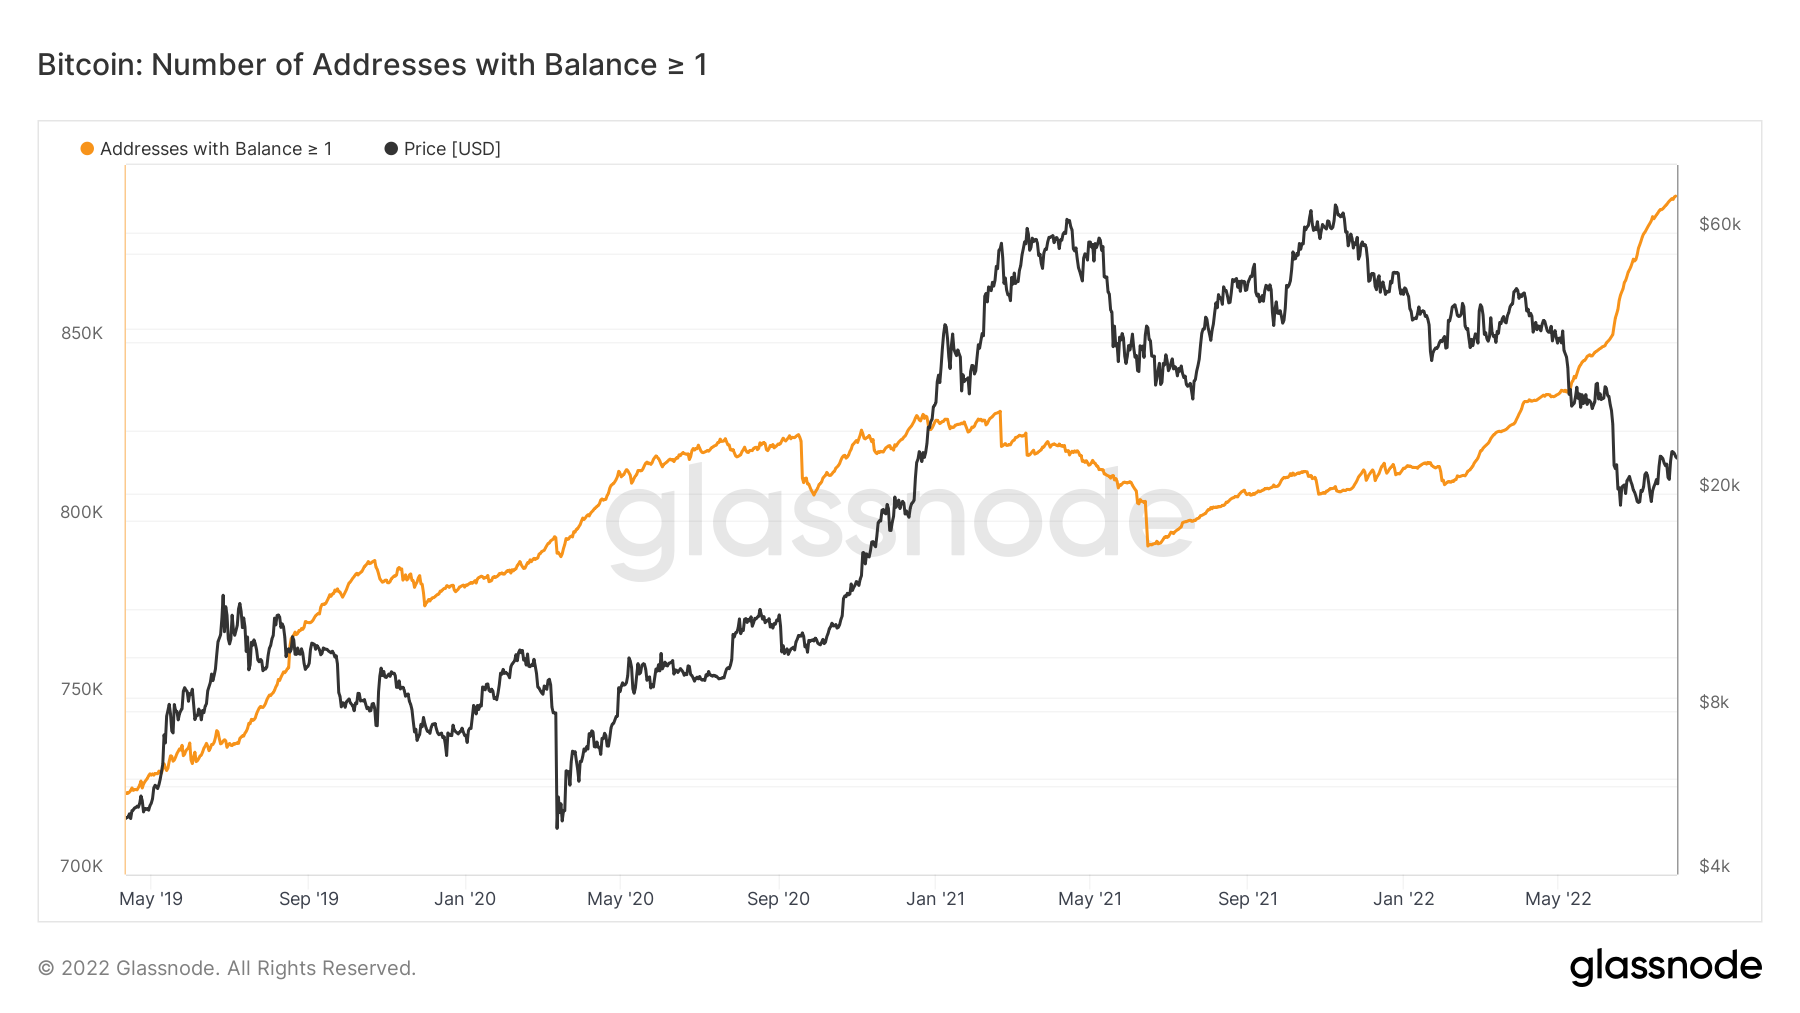
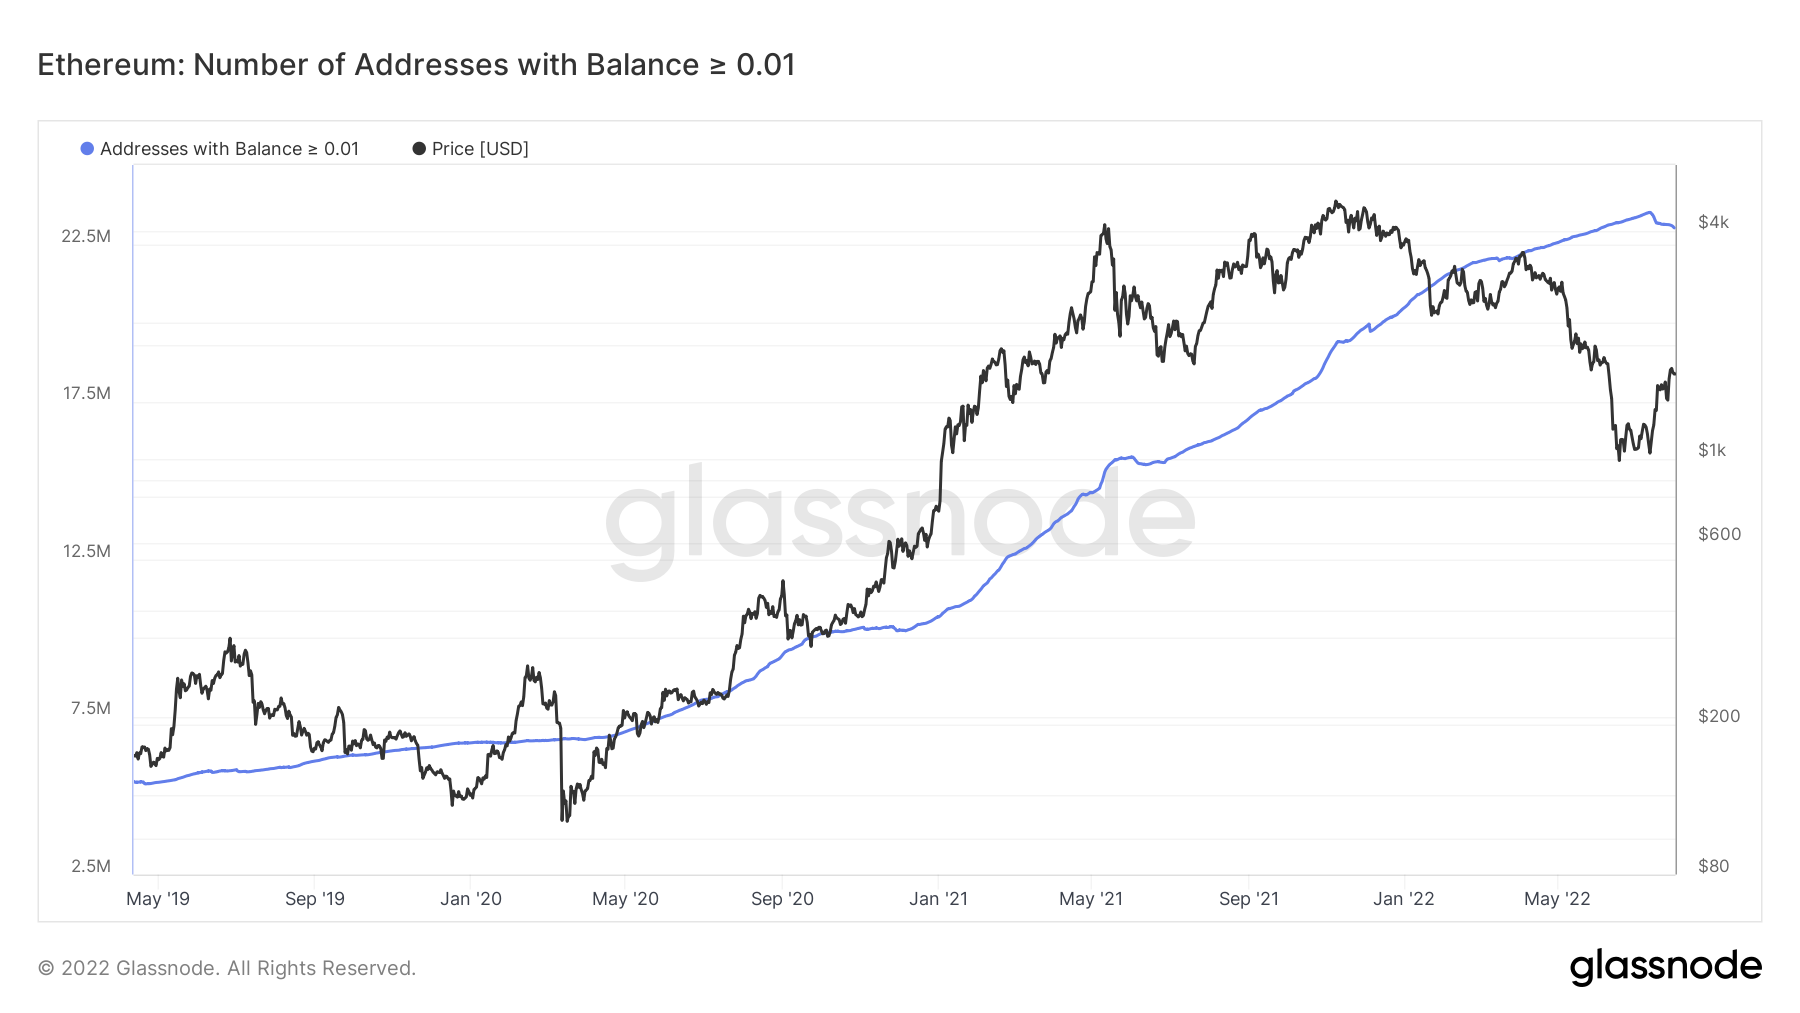
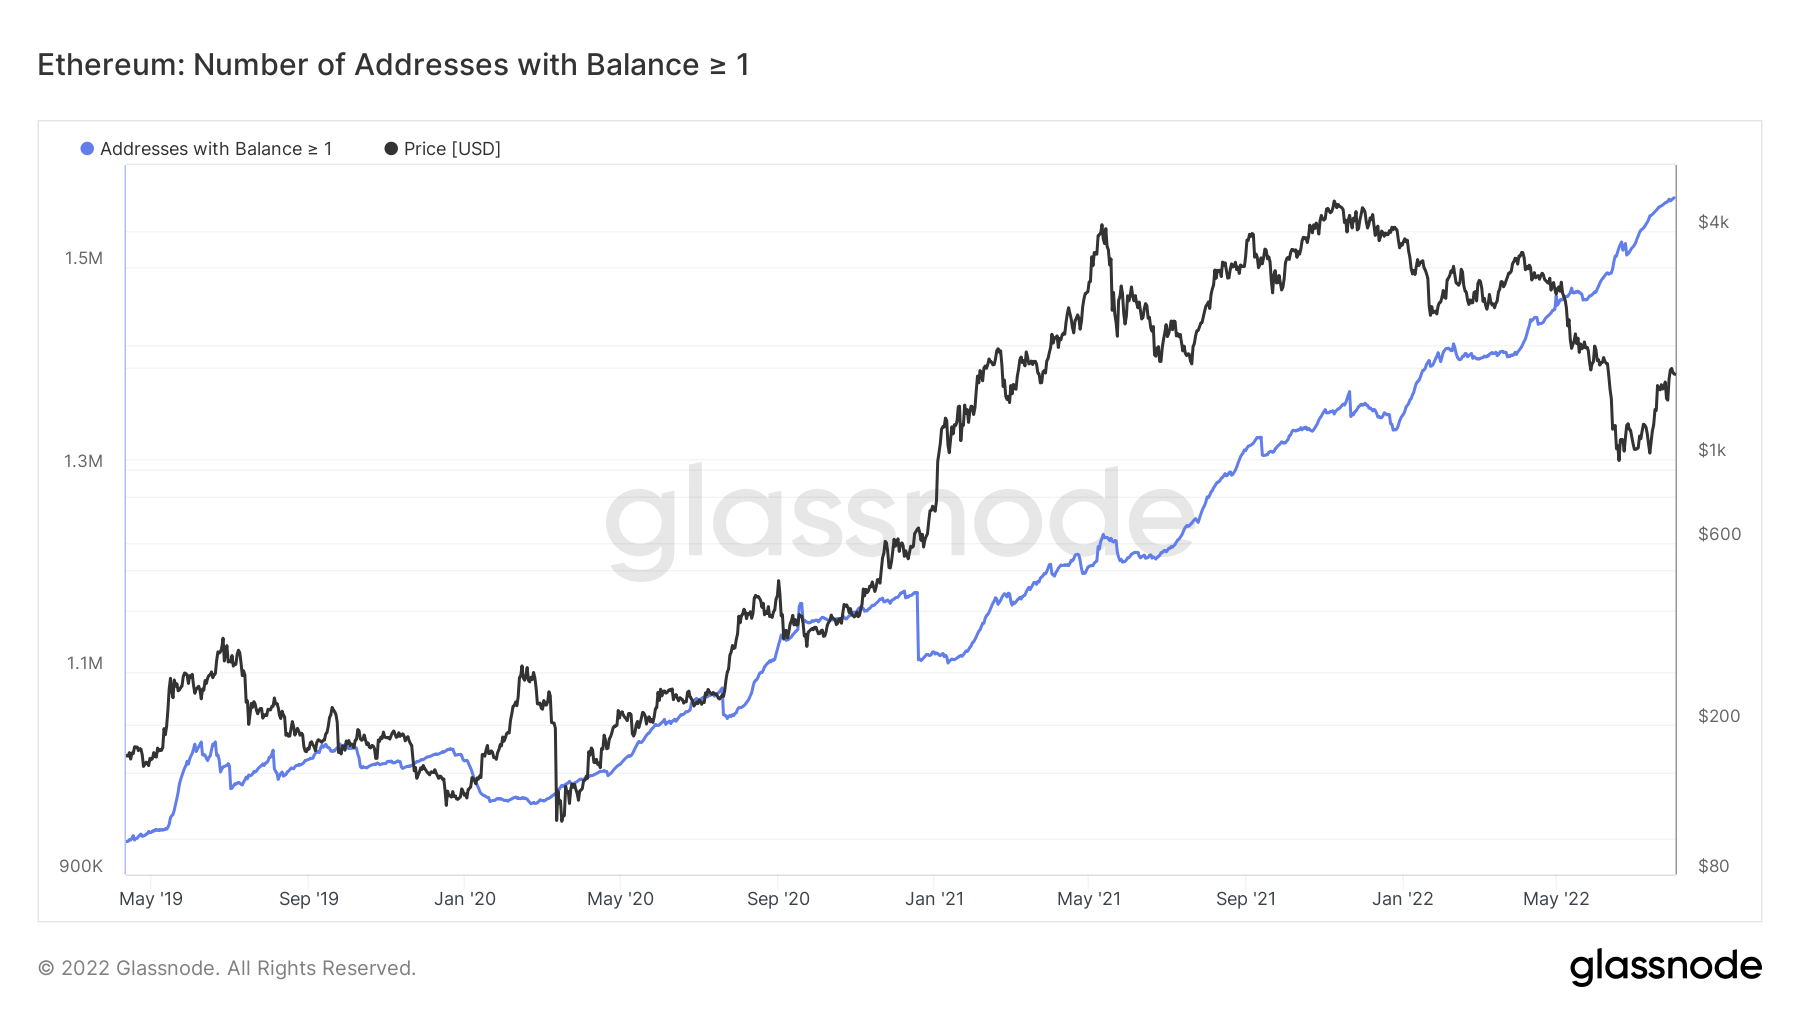
If we begin by looking at the wallet groups with the smaller number of coins, we can see that in the majority, the number of wallets is constantly increasing. This is likely due to new people entering the space and becoming long-term ‘hodlers’ and adding to their balances irregularly. We can see in the past month that these cohorts have seen increased accumulation of coins.
Bitcoin – Addresses with Balance > 0.01 Bitcoin
Bitcoin – Addresses with Balance > 1 Bitcoin
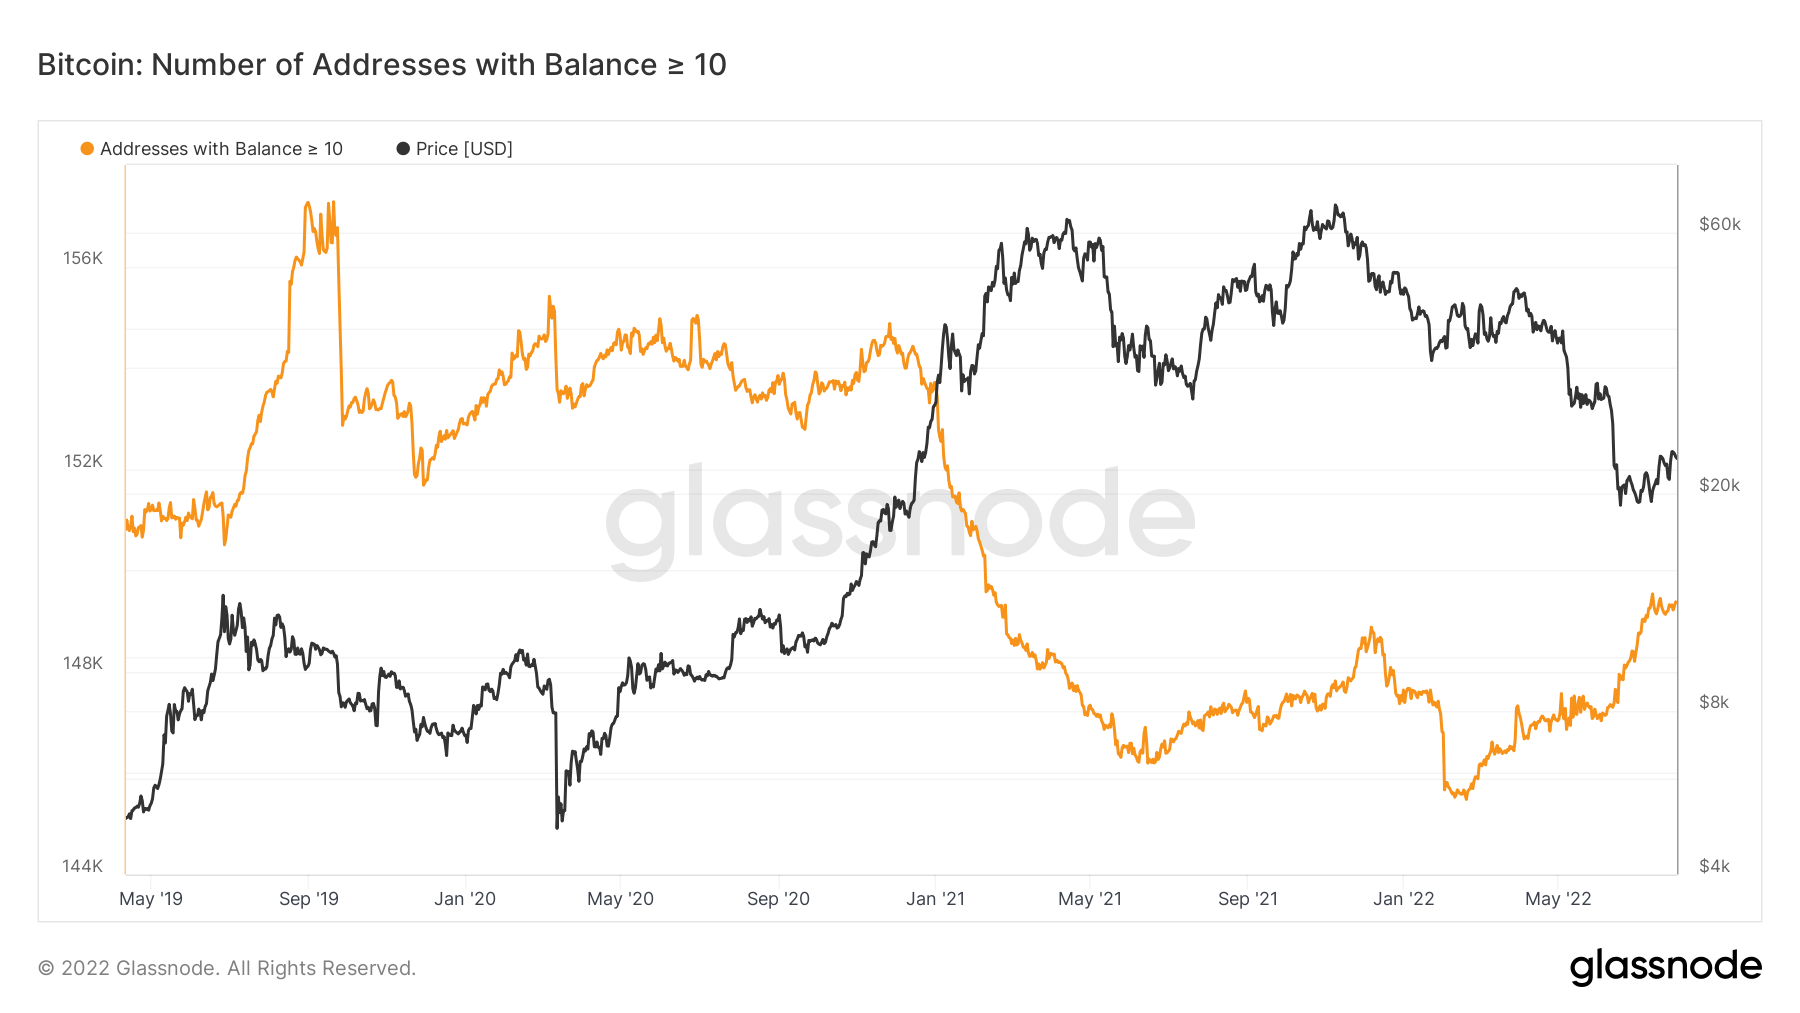
Bitcoin – Addresses with Balance > 10 Bitcoin
Bitcoin – Addresses with Balance > 1,000 Bitcoin
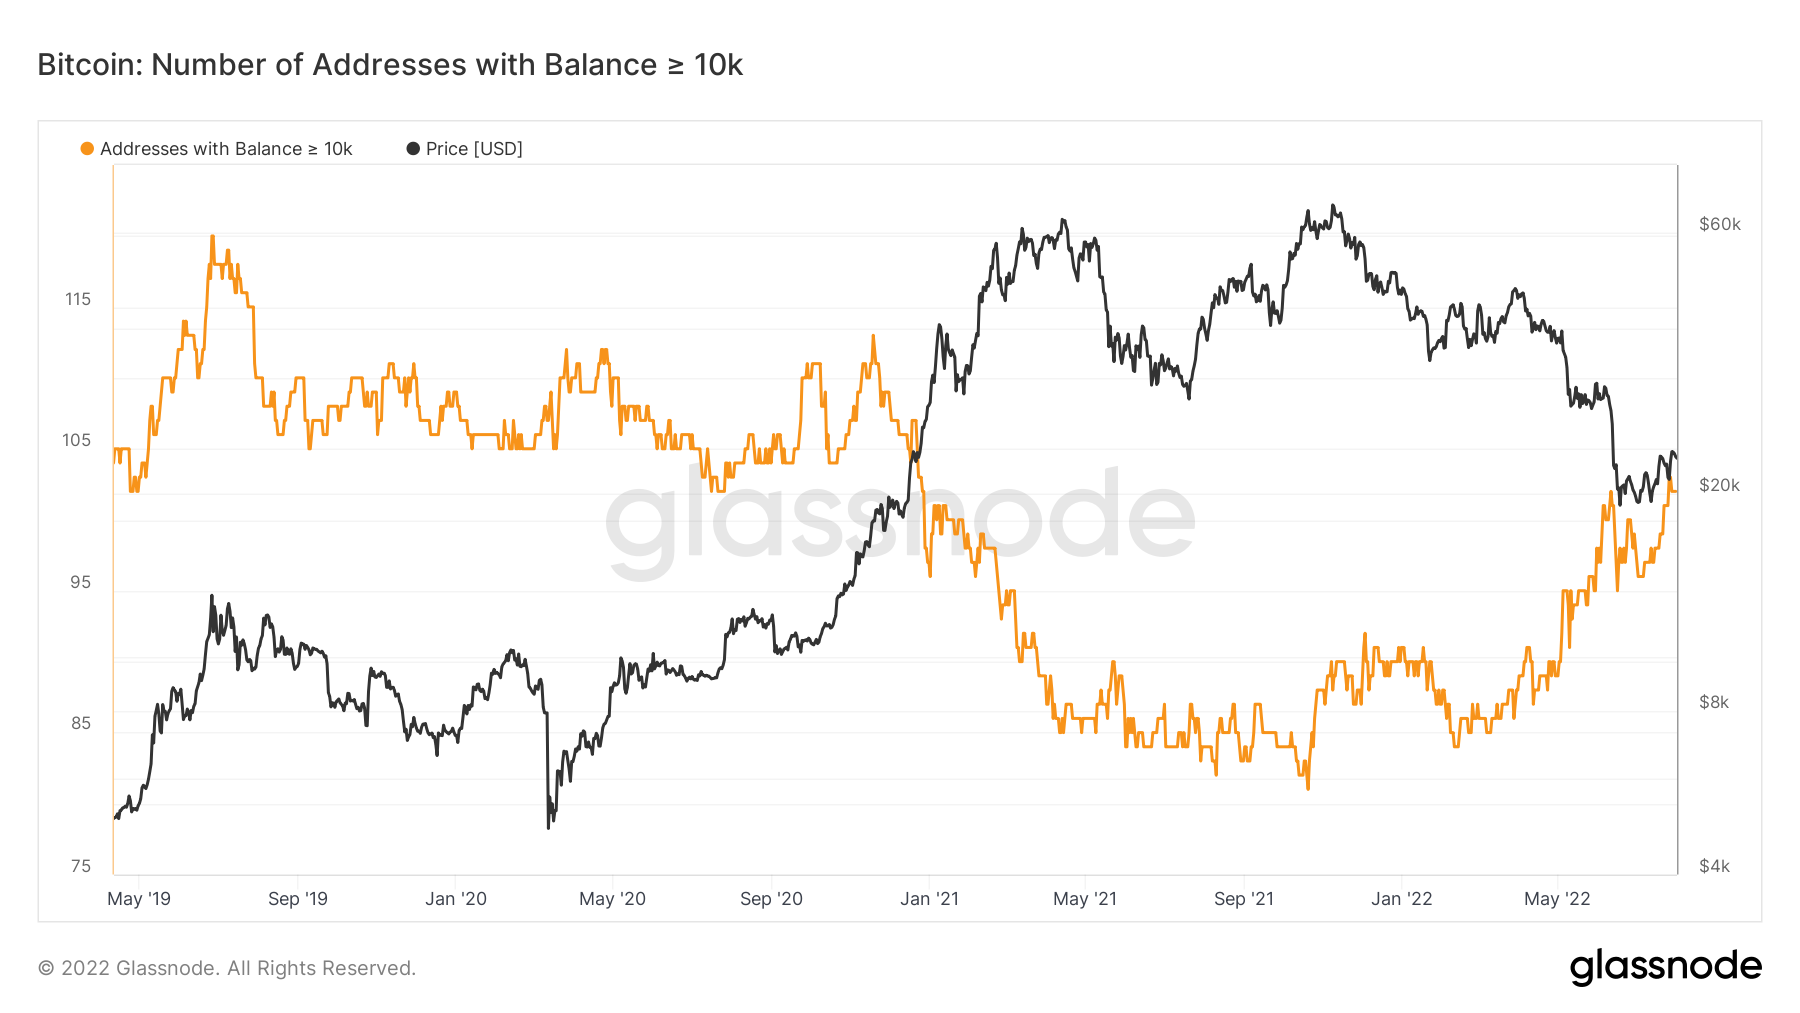
Bitcoin – Addresses with Balance > 10,000 Bitcoin
Metric 2 – Realised Price by Address
In the last few weeks, Bitcoin and Ether have seen relief rallies in their prices. Many are wondering if this is just a relief rally or if the bottom is already in. There are many factors that will be put together to answer this question, however, the Realised Price by Address shows us that there may be some significant resistance to the upside.
Bitcoin – Realised Price by Address
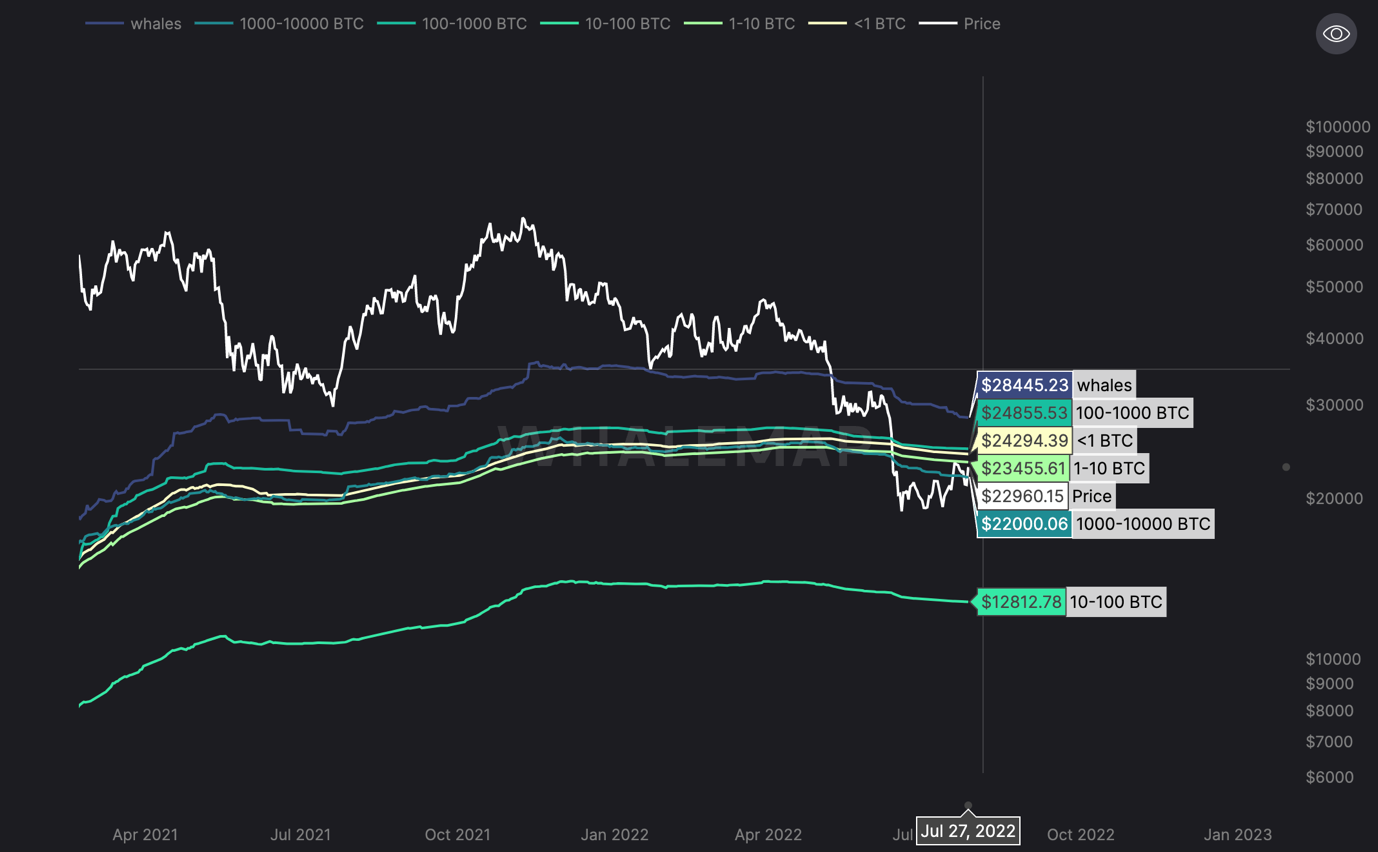
In the above, we can see that the realised price (average buy price) by the wallet cohorts is between $23,455 and $24,855. This means that the price is below the average entry of these wallet cohorts and therefore there are likely more users in unrealised losses than profits. If the price then reaches break-even levels (average entry prices) for these wallet cohorts, we may see investors sell their coins rather than have the conviction to hold them and wait for higher prices. This may provide added resistance to the upside if investors sell into break-even levels.
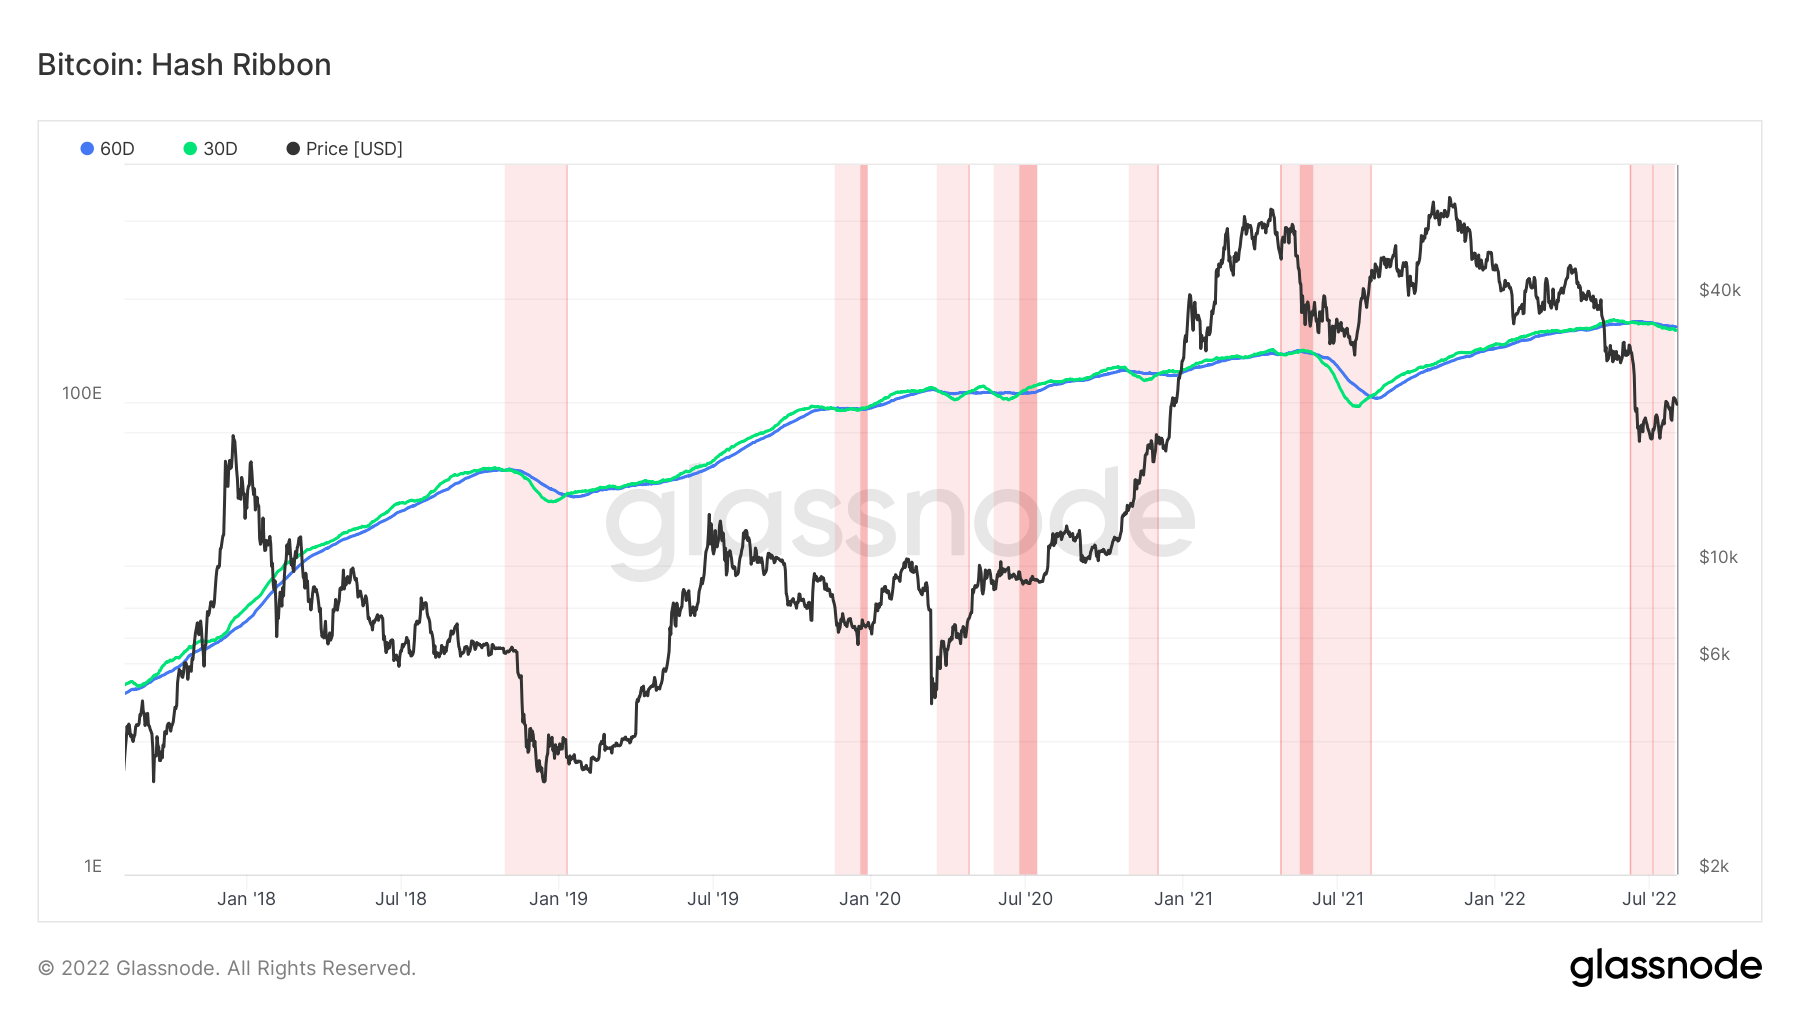
Metric 3 – Hash Ribbon
The last metric we will look at is the Hash Ribbon. When the Hash Ribbon turns down and bottoms, this is usually a sign of late-stage bear markets. This is due to the price of Bitcoin coming down so much that inefficient miners are no longer generating enough Bitcoin (rewards for their mining) to cover their costs. They, therefore, turn their rigs off and exit the market. The difficulty then decreases followed by Hash Rate, meaning efficient miners are rewarded with greater rewards. In turn, they expand and buy old rigs at a discount, and Difficulty and Hash Rate increase once more, which in turn pushes the Bitcoin price higher.
The Hash Ribbon indicates that Bitcoin tends to reach a market bottom when miners capitulate – inefficient miners have been flushed out i.e. when Bitcoin becomes too expensive to mine. When the 30d MA of the hash rate crosses the 60d MA, this suggests the worst is over and the market has begun its recovery. We’re currently seeing this MA’s turnover and likely trend lower (look back to late 2018 for a reference for the last bear market). Once we see this metric bottom and begin to turn higher, this may an indication that this miner capitulation stage is over. However, as of yet, we’re yet to see this even significantly turn lower, so there may be more downside to come – it’s possible we haven’t seen enough capitulation from miners yet).
Bitcoin – Hash Ribbon
Ether - Technical & On-Chain Analysis
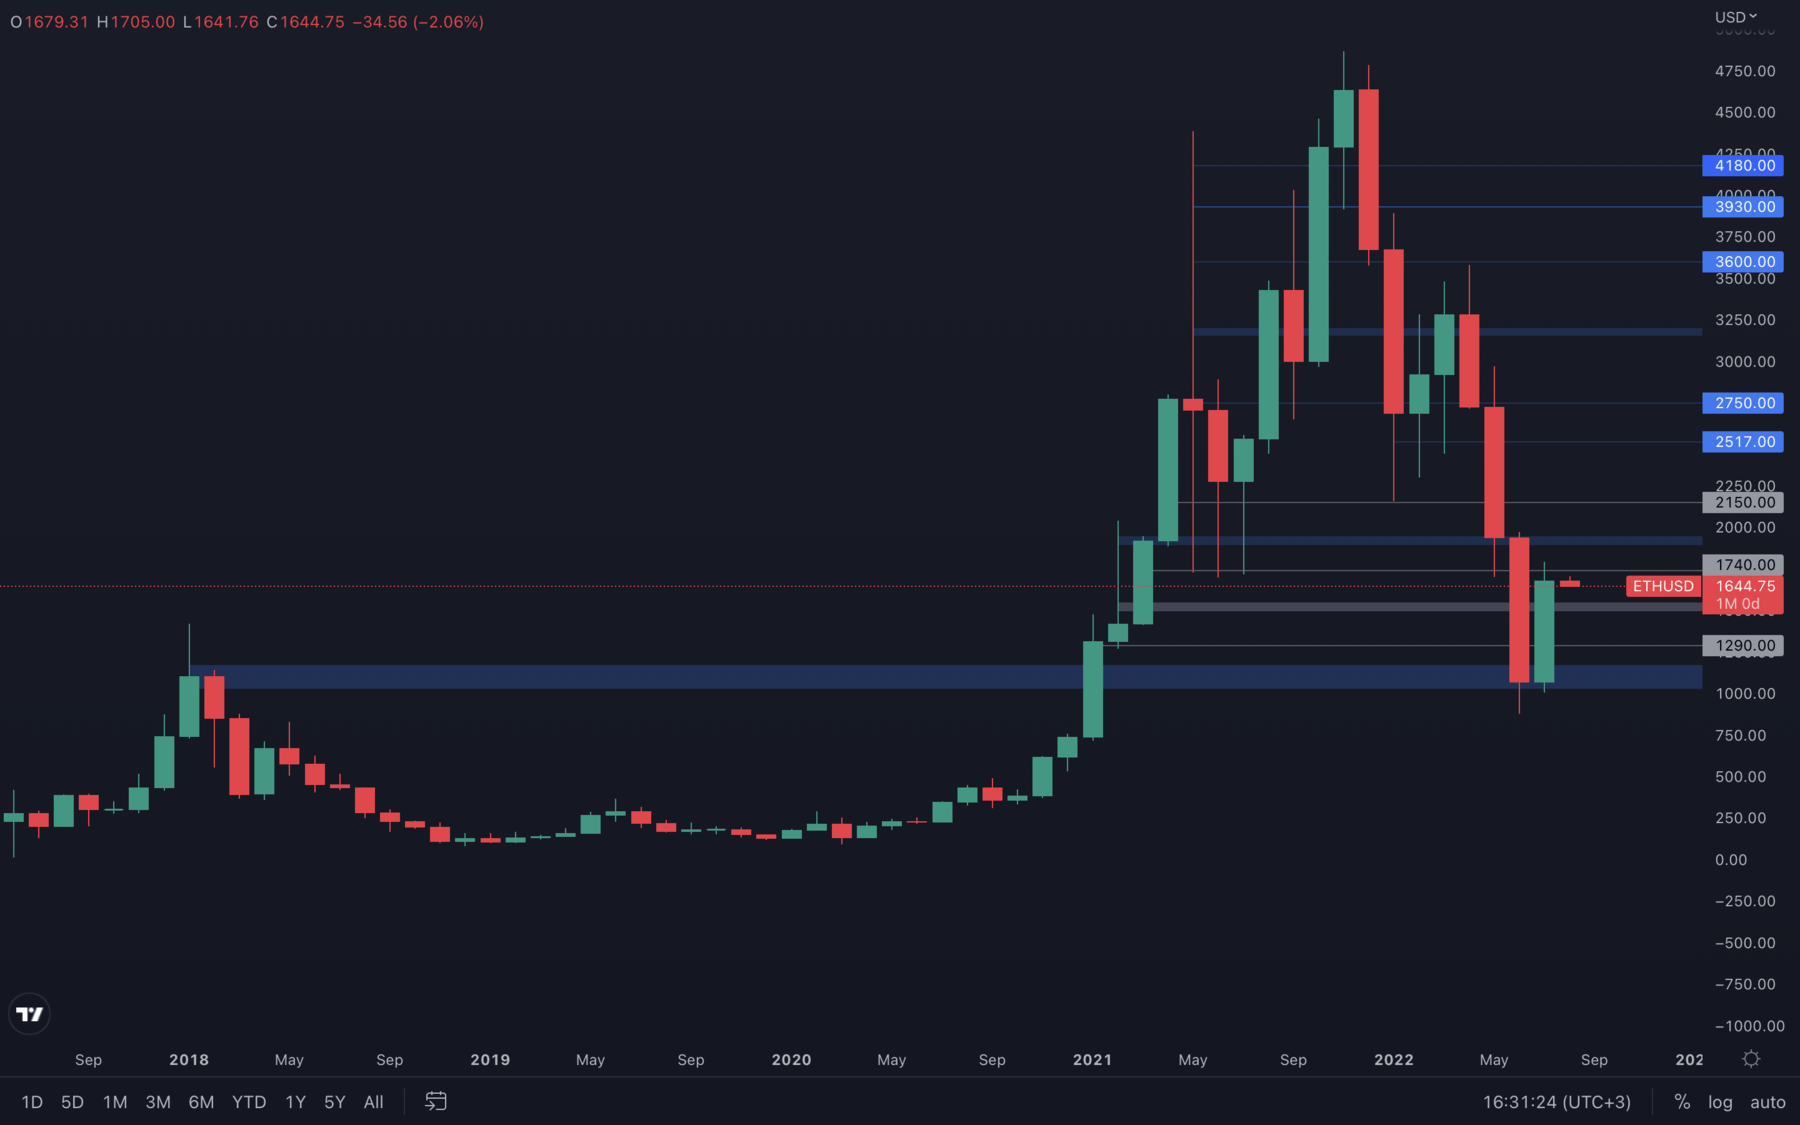
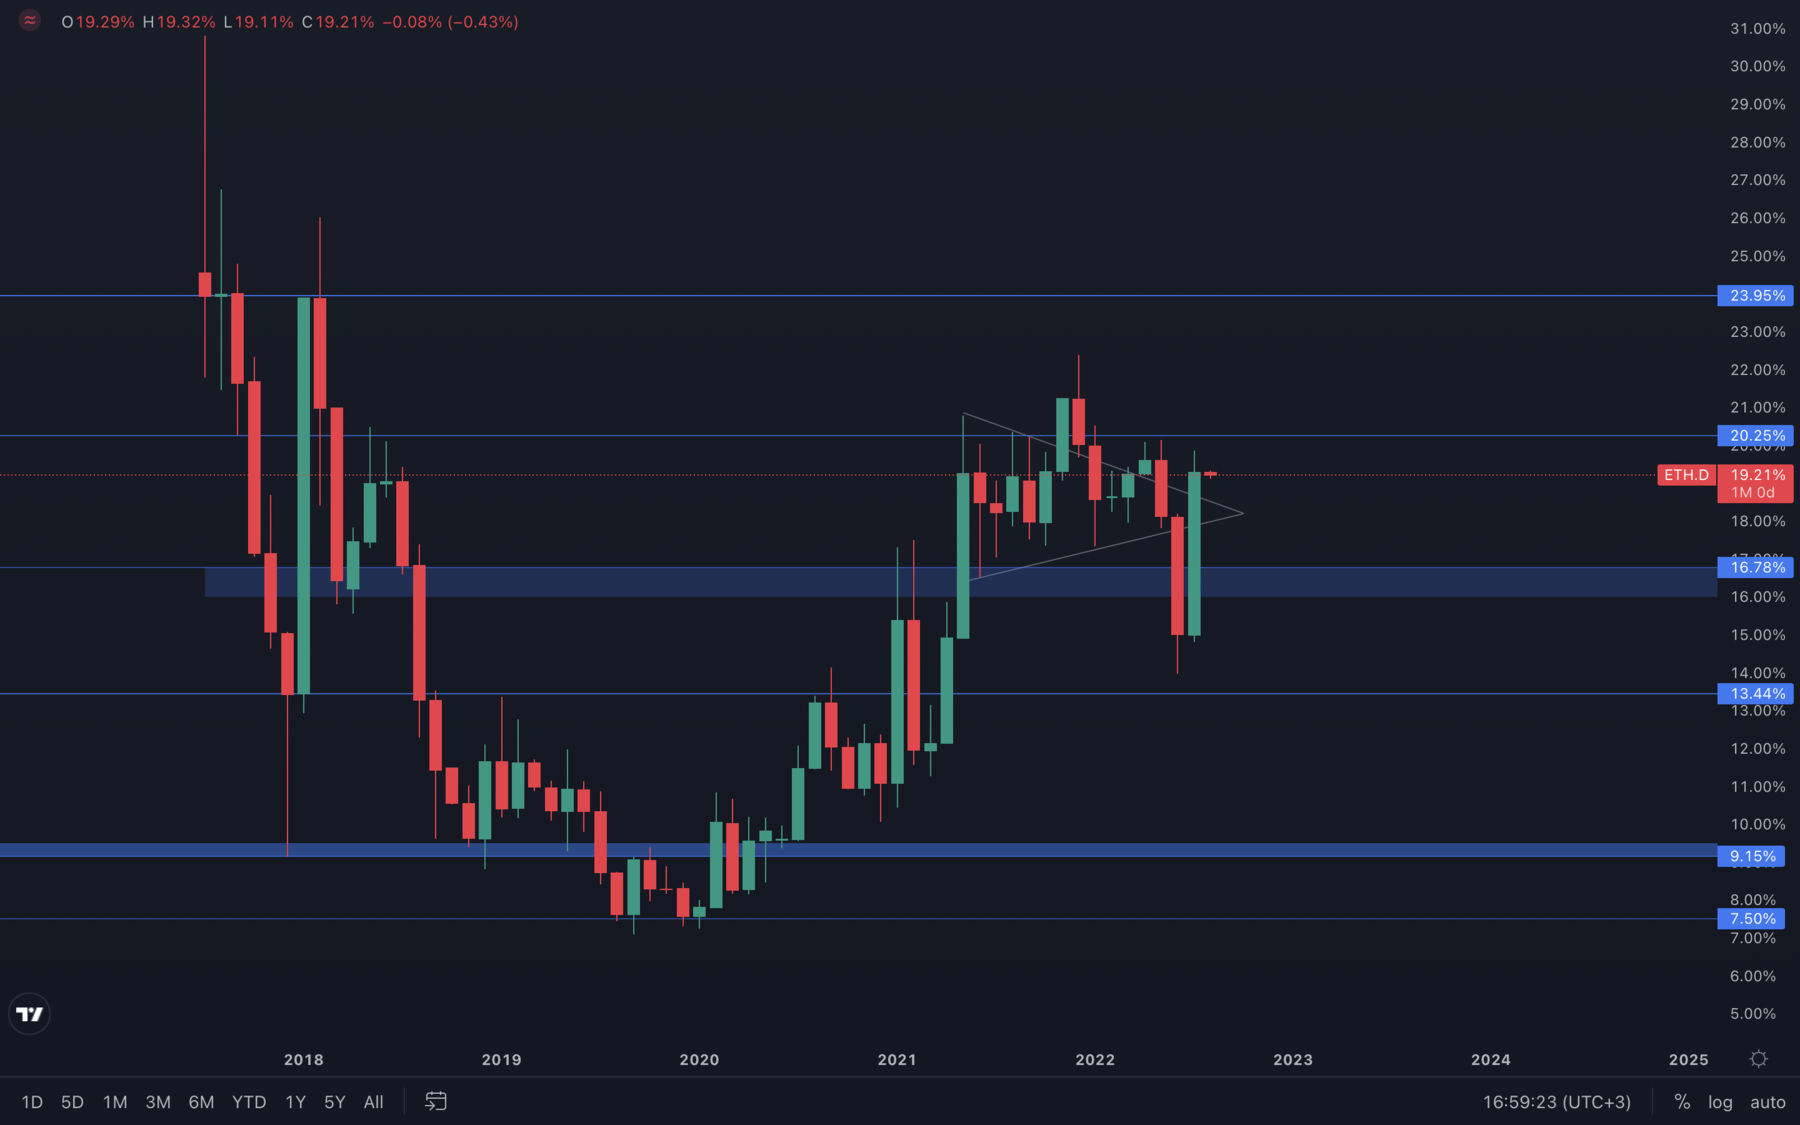
Ether has had quite a ride in July, rising over 50% right from its 2018 all-time high. We’ve also seen a bullish engulfing candle on the ETH Dominance chart, which might suggest that Ether will continue to outperform Bitcoin in the coming months. There is still risk involved, however, as Ether closed July just under the $1740 resistance level. This suggests we could also see Ether having difficulty in rising further, but we will continue to keep you updated on a daily basis with all important technical changes.
ETH Dominance
Metric 1 – Addresses
The wallet groups with the smaller amounts of coins are usually emotional to changes in price and hence this is reflected in the risk-on (buy coins) and risk-off (sell coins) of these groups. We, therefore, concentrate on the ‘Addresses with Balances > 1,000 Bitcoin’ and the ‘Addresses with Balances > 1,000 Ether’ as they have been better at predicting the best times to risk-on and risk-off.
Ether – Addresses with Balance > 0.01 Ether
Ether – Addresses with Balance > 1 Ether
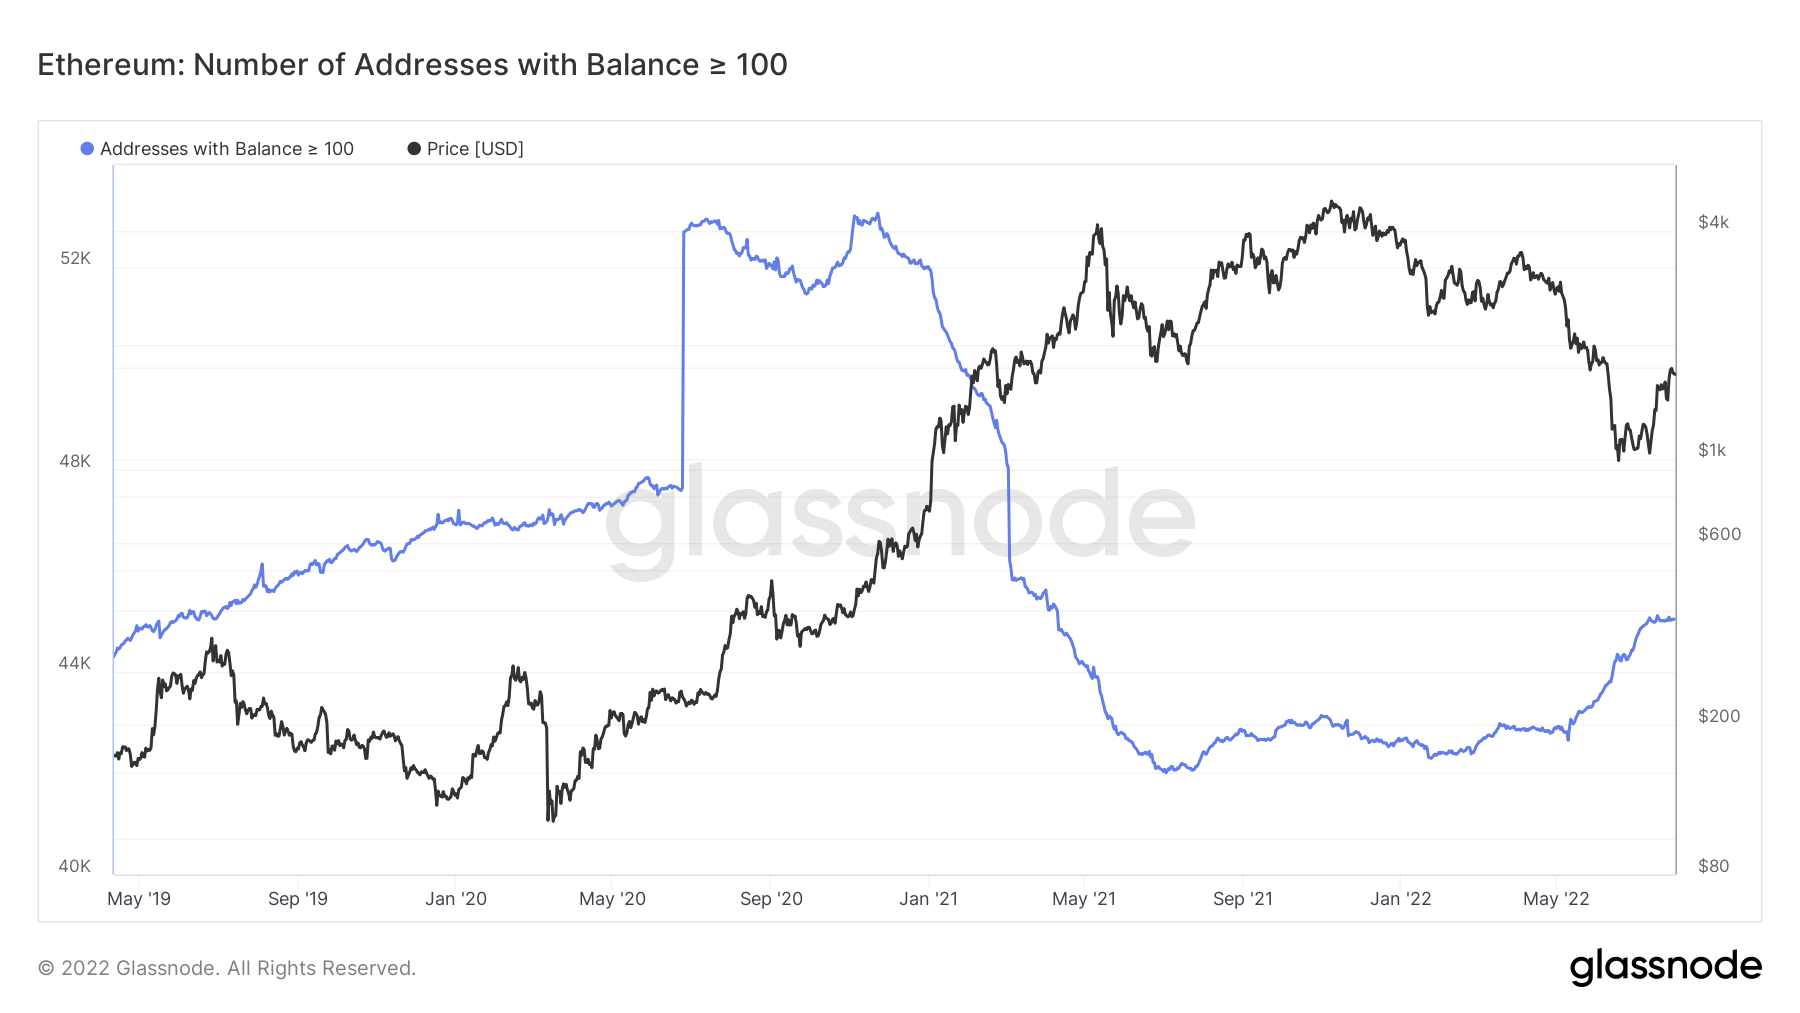
Ether – Addresses with Balance > 100 Ether
Ether – Addresses with Balance > 1,000 Ether
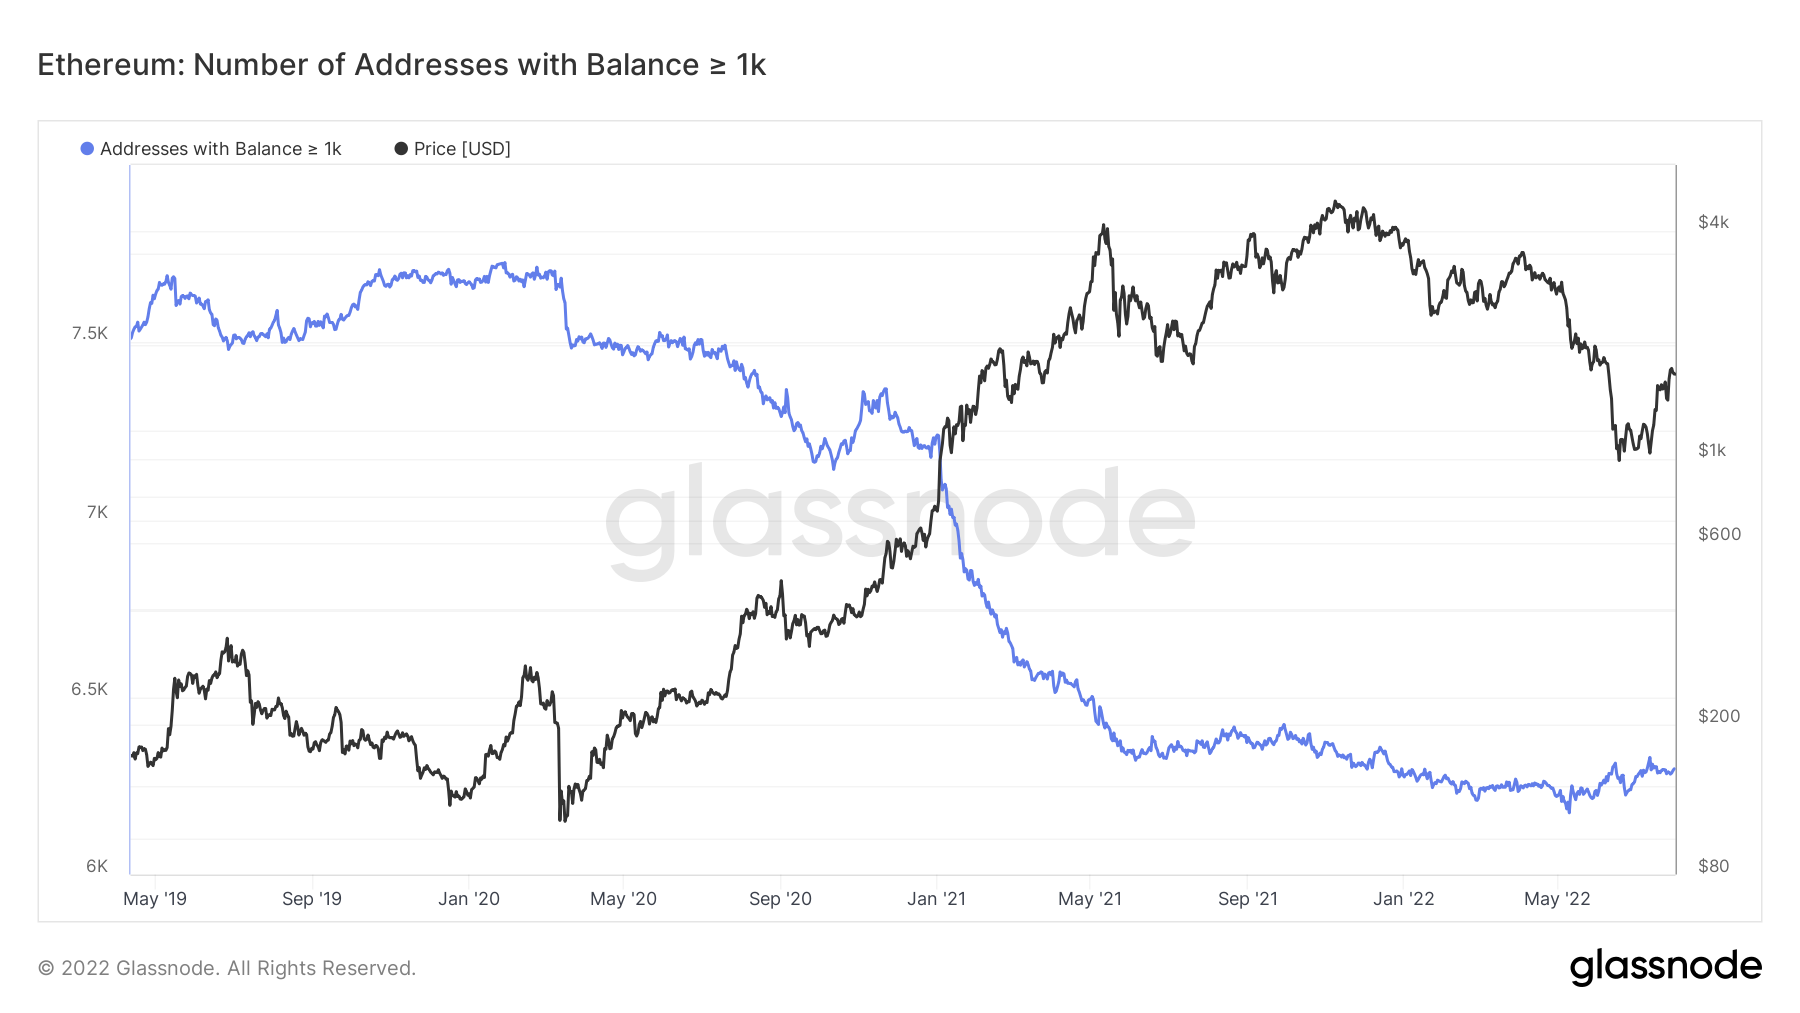
If we look at these cohorts but for Ether, we can see that the ‘Addresses with Balance > 1,000 Ether’ have been slightly better at knowing when to buy and sell coins than the ‘Addresses with Balance > 10,000 Ether’ cohort. The 1,000 Ether cohort has been risk-off for well over a year and a half, and haven’t really increased their exposure yet.
Ether – Addresses with Balance > 10,000 Ether
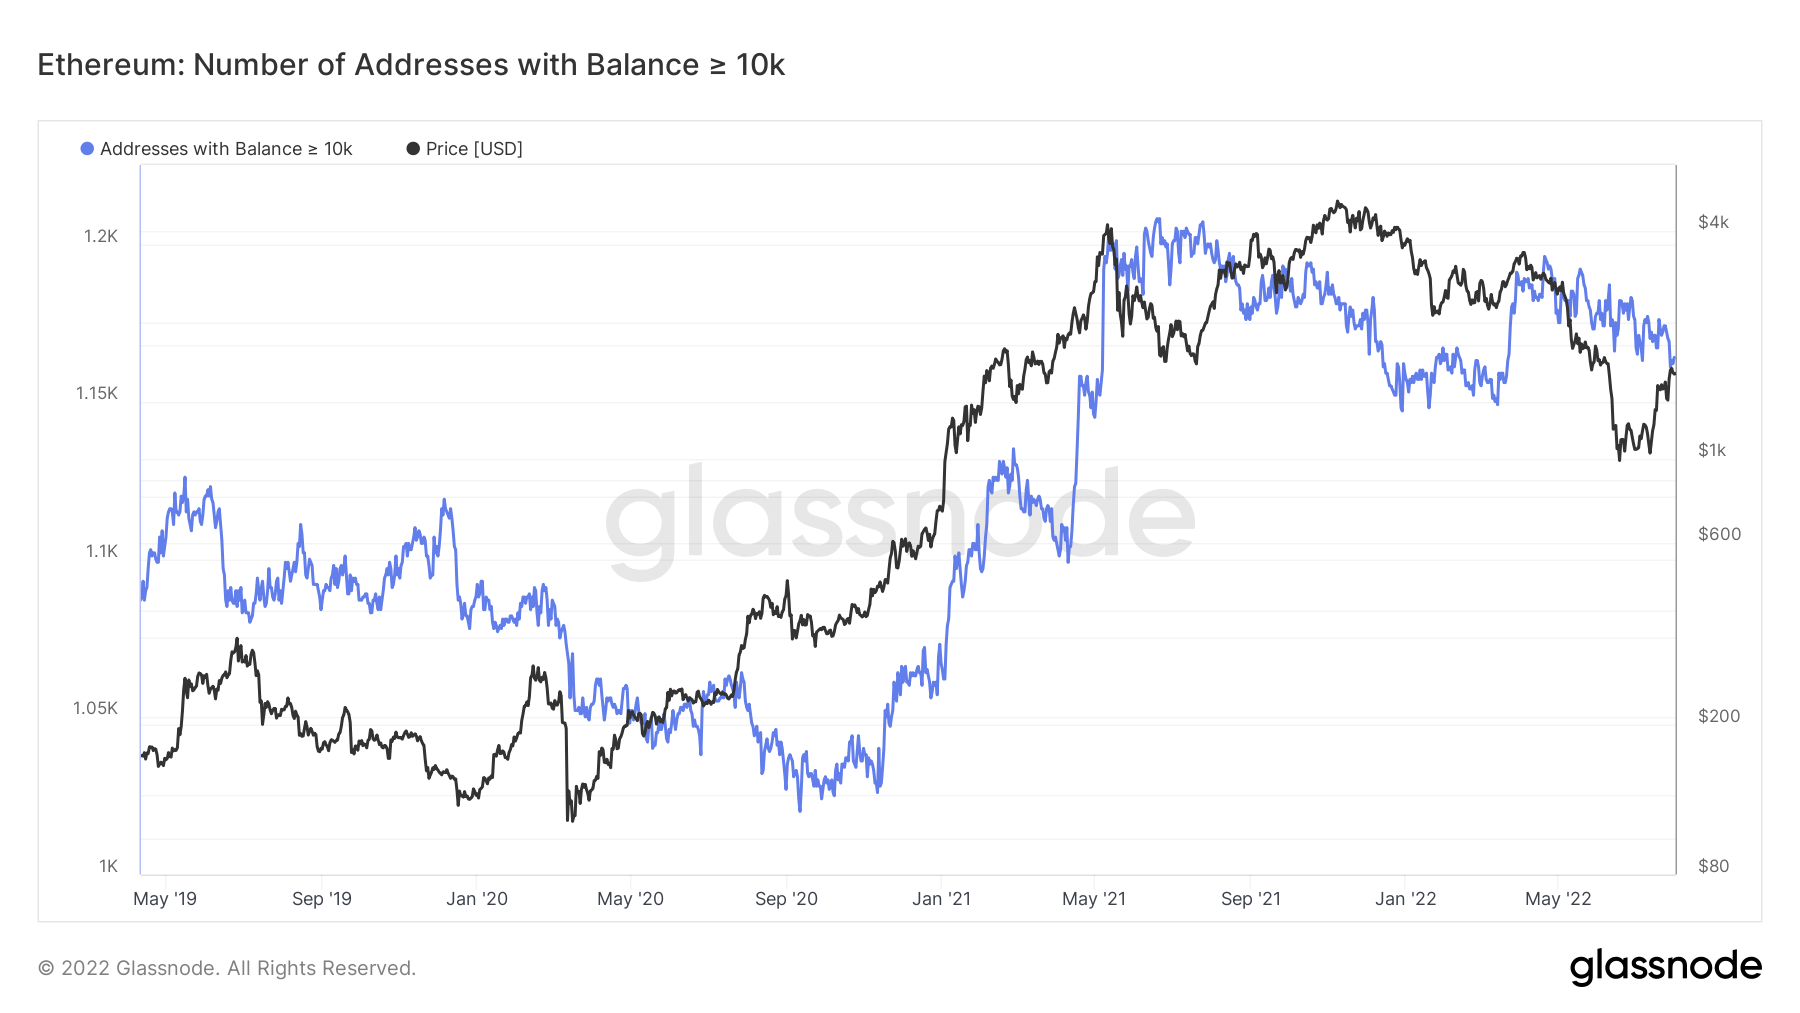
The ‘Addresses with Balance > 10,000 Ether’ have not de-risked that much over the past year but have begun to recently as prices have come down much further than many would have anticipated. It also looks as if they are selling into this slight increase in prices that we have seen over the past few weeks, an indication that this rally may struggle to get more meaningful momentum.
DOT
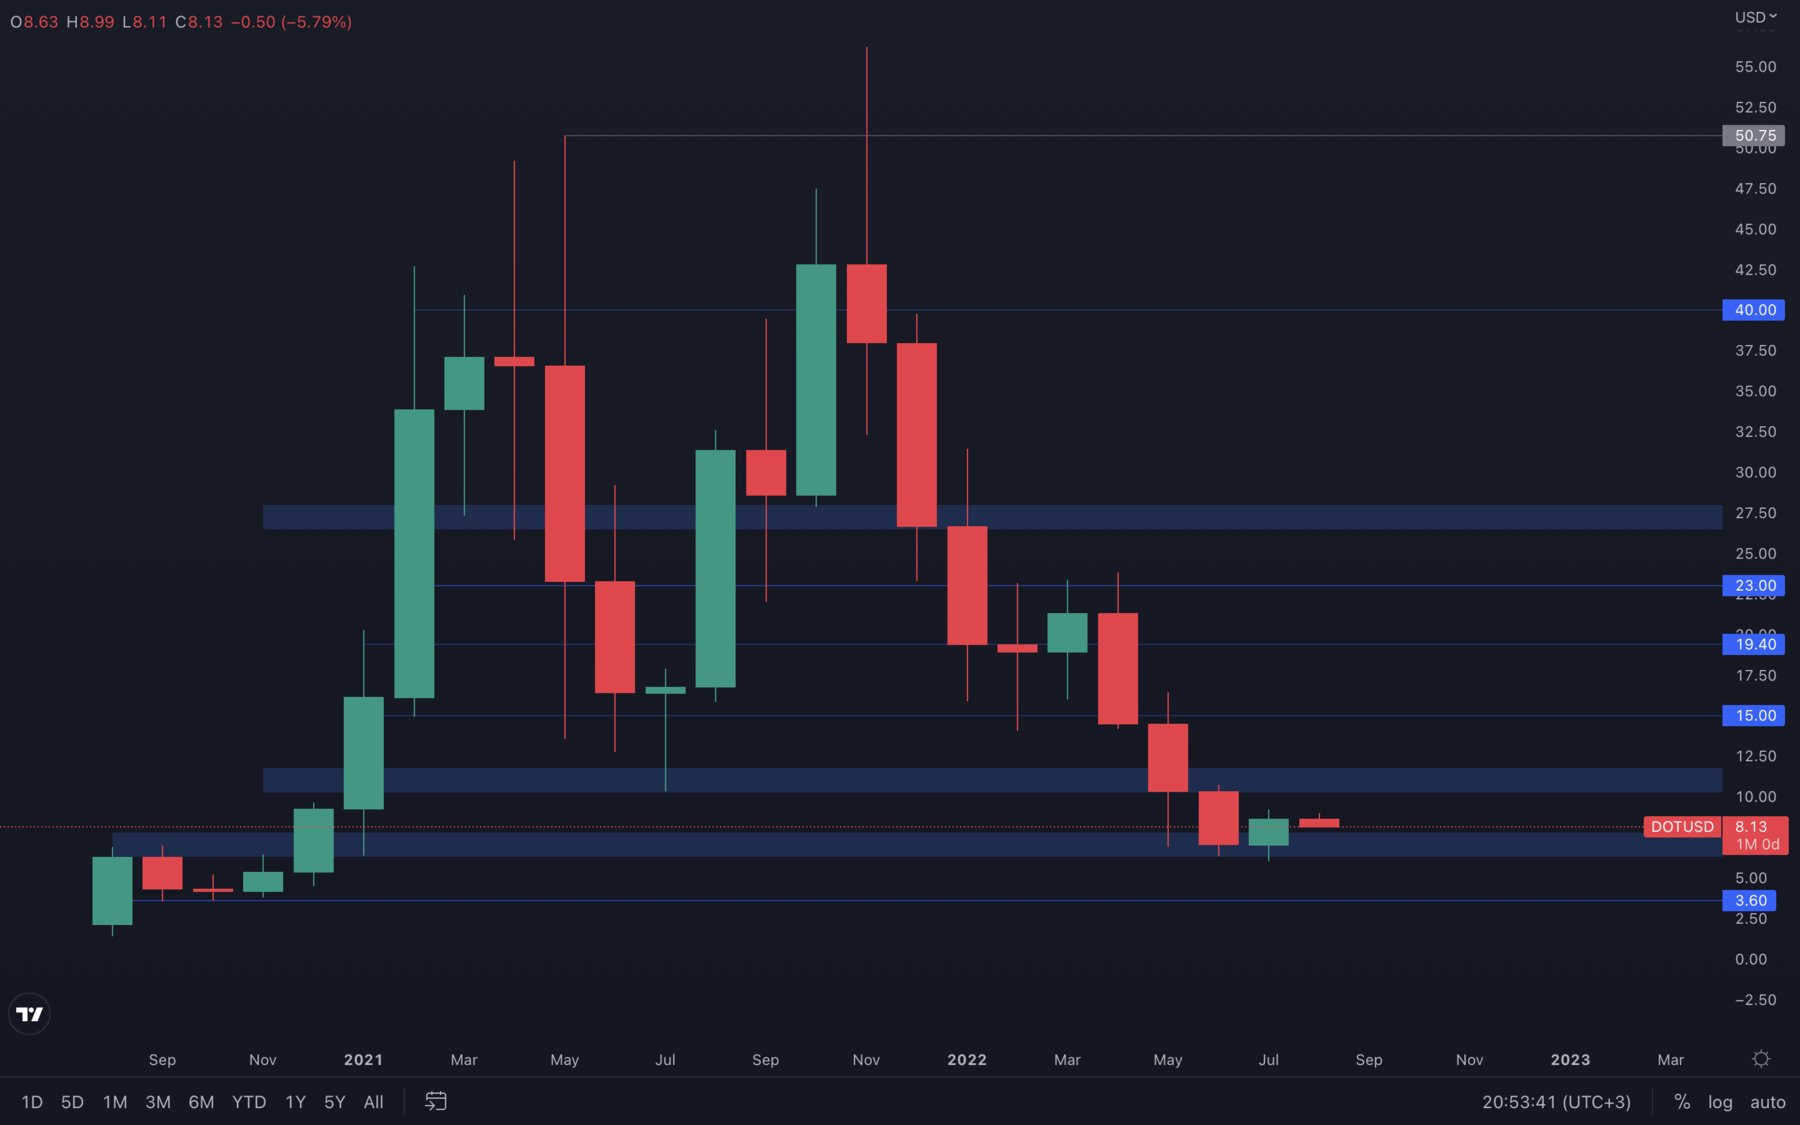 DOT managed to close July just above its $6.30 - $7.75 resistance area, which has now been flipped into support. Holding these levels on the weekly timeframe is crucial for further upside towards $10 and above, which is what we will be watching throughout August. For now, holding $7.75 on the weekly timeframe is the ideal scenario for further upside.
SNX
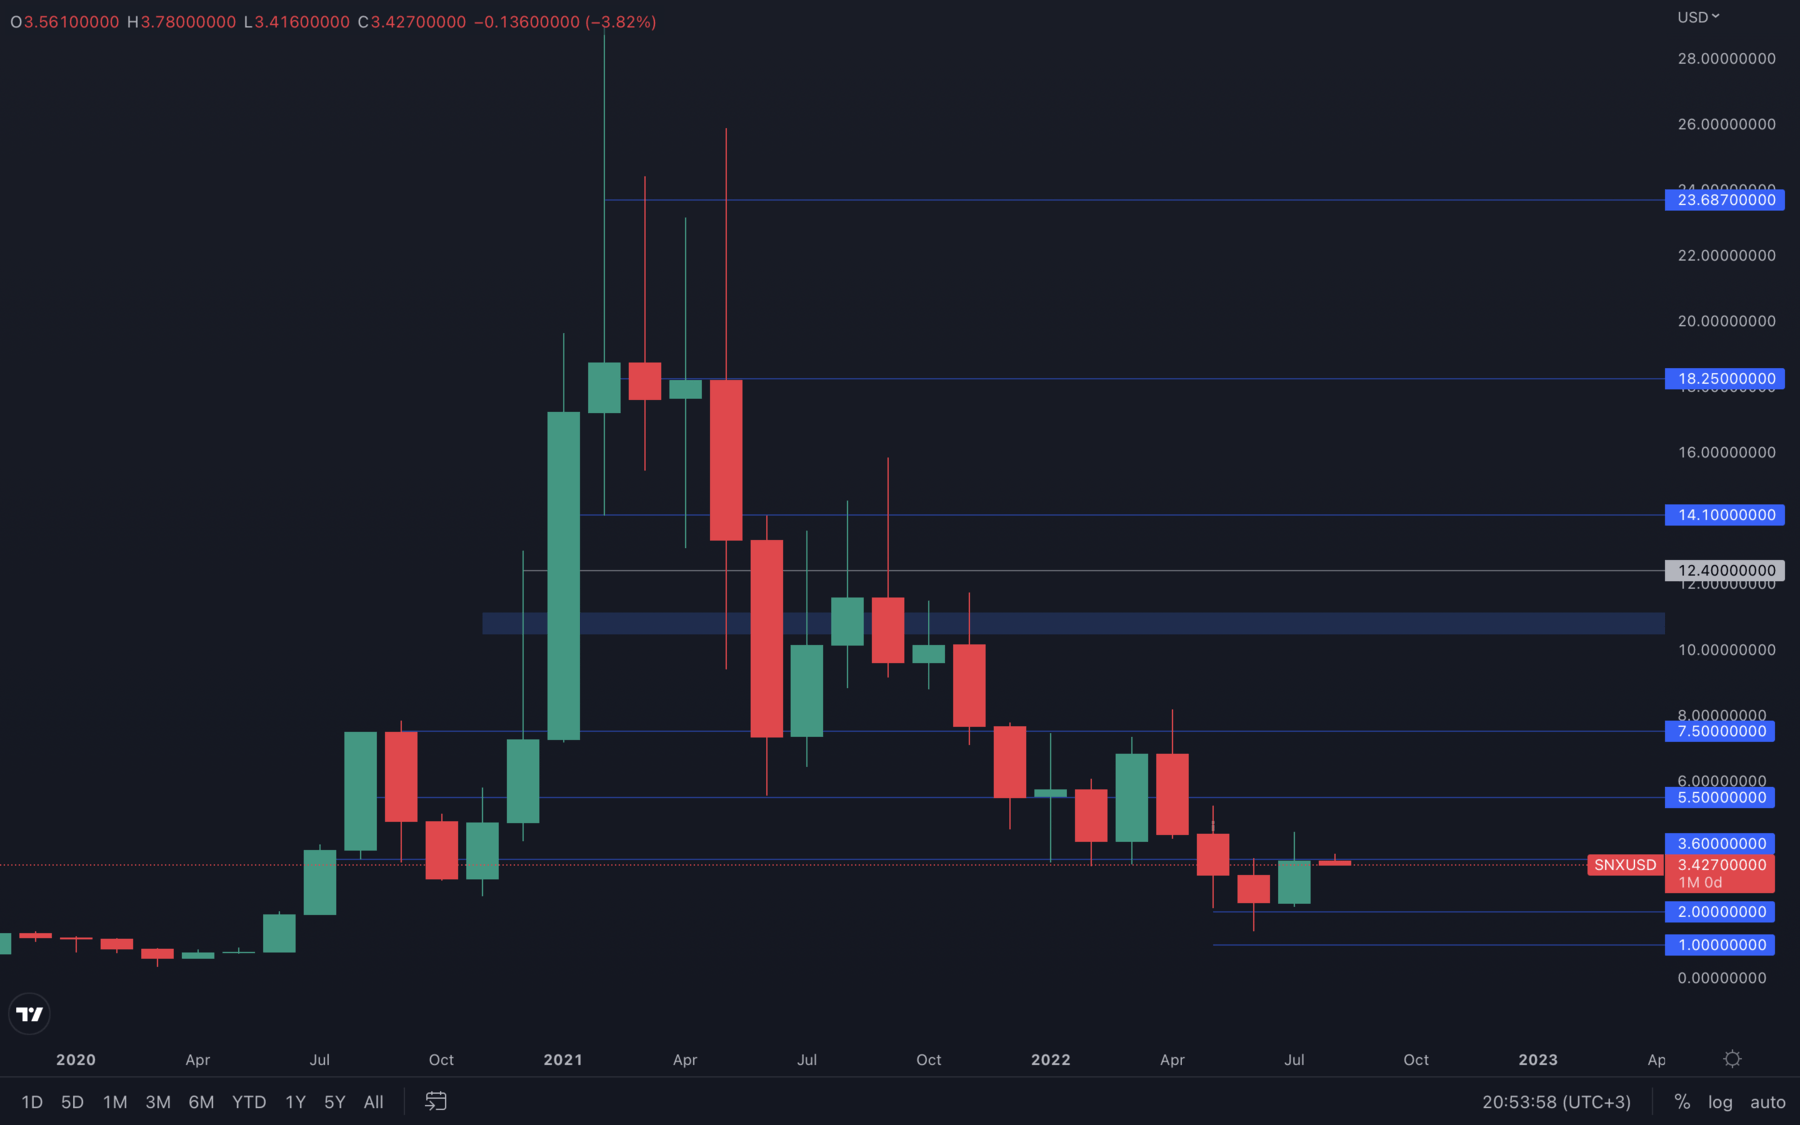 Quite a complicated situation for SNX - last month, SNX formed a bullish engulfing candle. A bullish engulfing candle on the monthly timeframe is as powerful as it can get. However, the candle closed just below SNX's $3.60 resistance level. This can cause some difficulty as sellers can easily outperform buyers. For that reason, it's best to wait for a weekly closure above $3.60 to confirm further upside, otherwise, SNX remains at risk of going lower.
A weekly Doji candle has also been printed last week, with large wicks that indicate volatility is at its highest. This candle has also formed just below the $3.60 resistance level, so at least for now, SNX might experience decreased buying pressure and head lower before any bullish momentum can occur.
RUNE
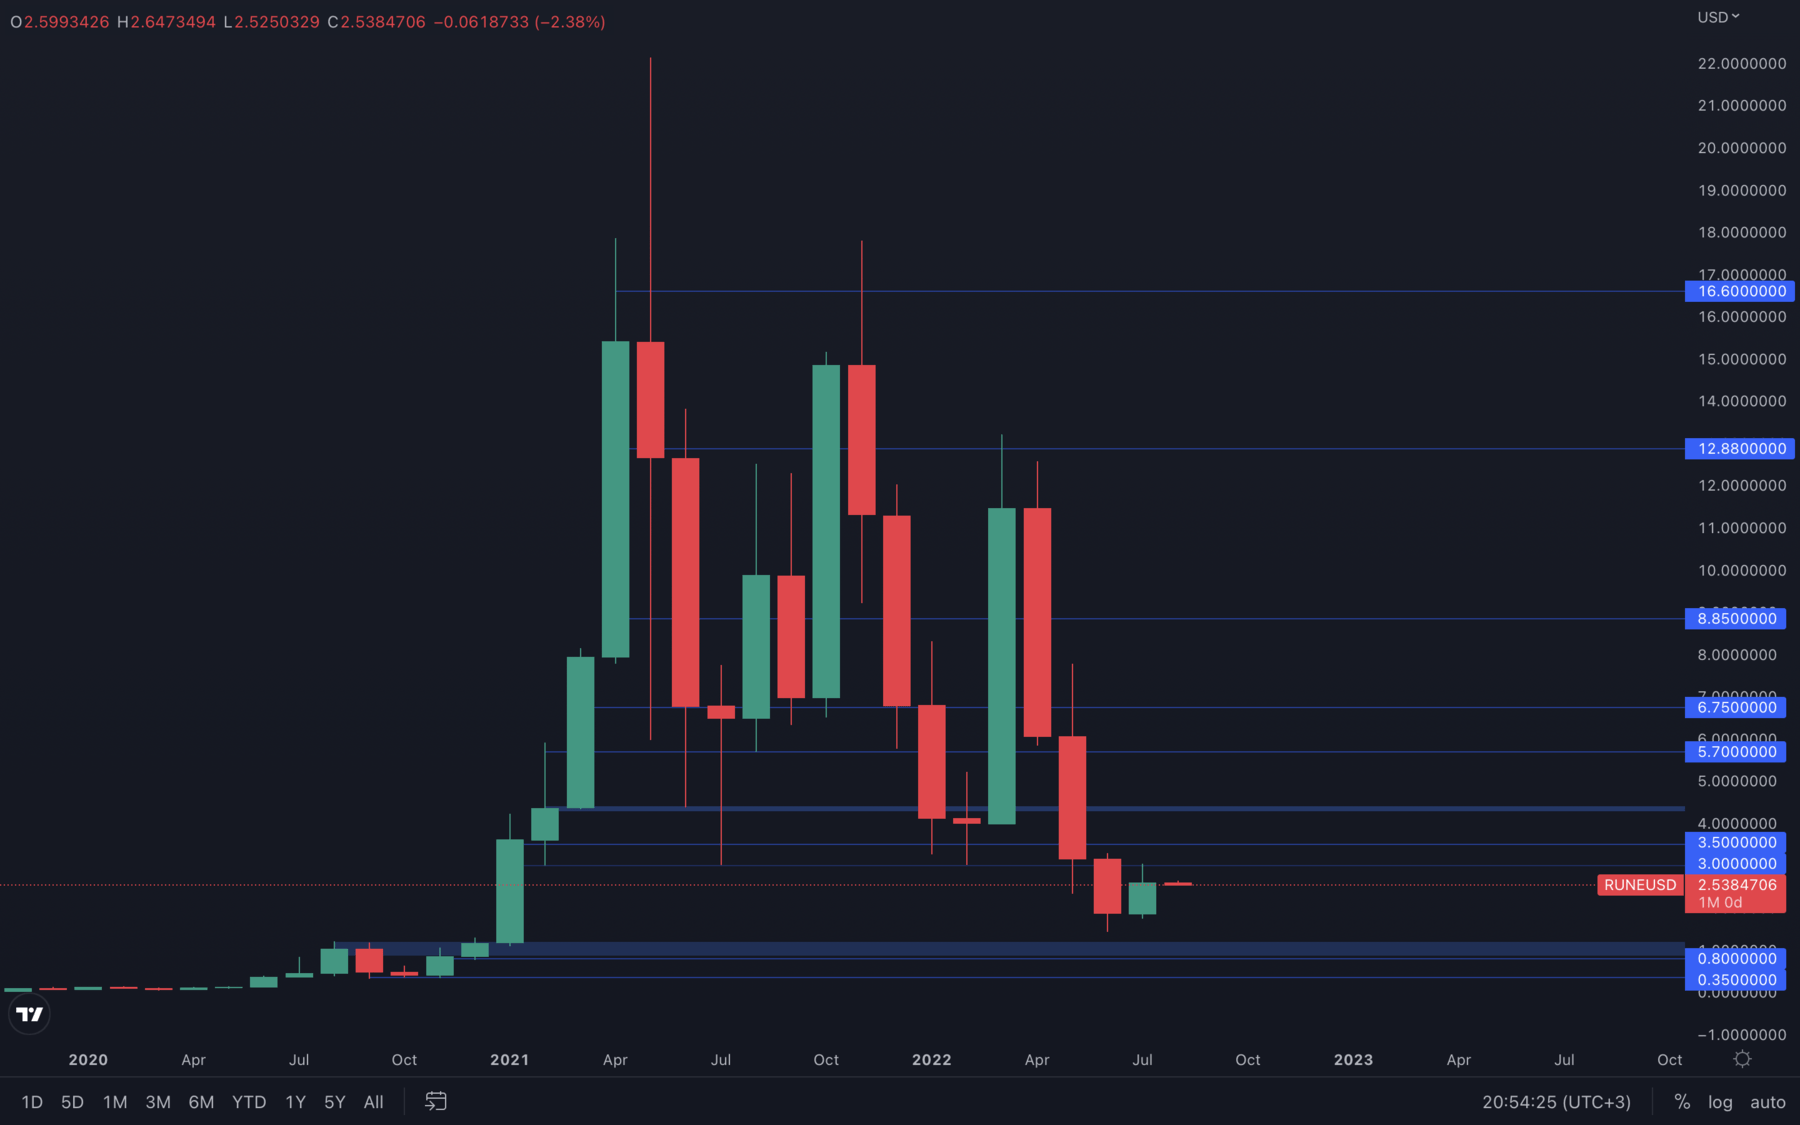 Unlike other assets in the list, RUNE closed bearish last week in what seems to be a topping pattern. The price of RUNE tested its $3 resistance level multiple times in the last 14 days and was unable to break above it, suggesting there is not enough buying pressure to push prices higher. This puts RUNE at risk, especially if the majors experience downside movement as well, as the majors highly influence RUNE's price action.
SOL
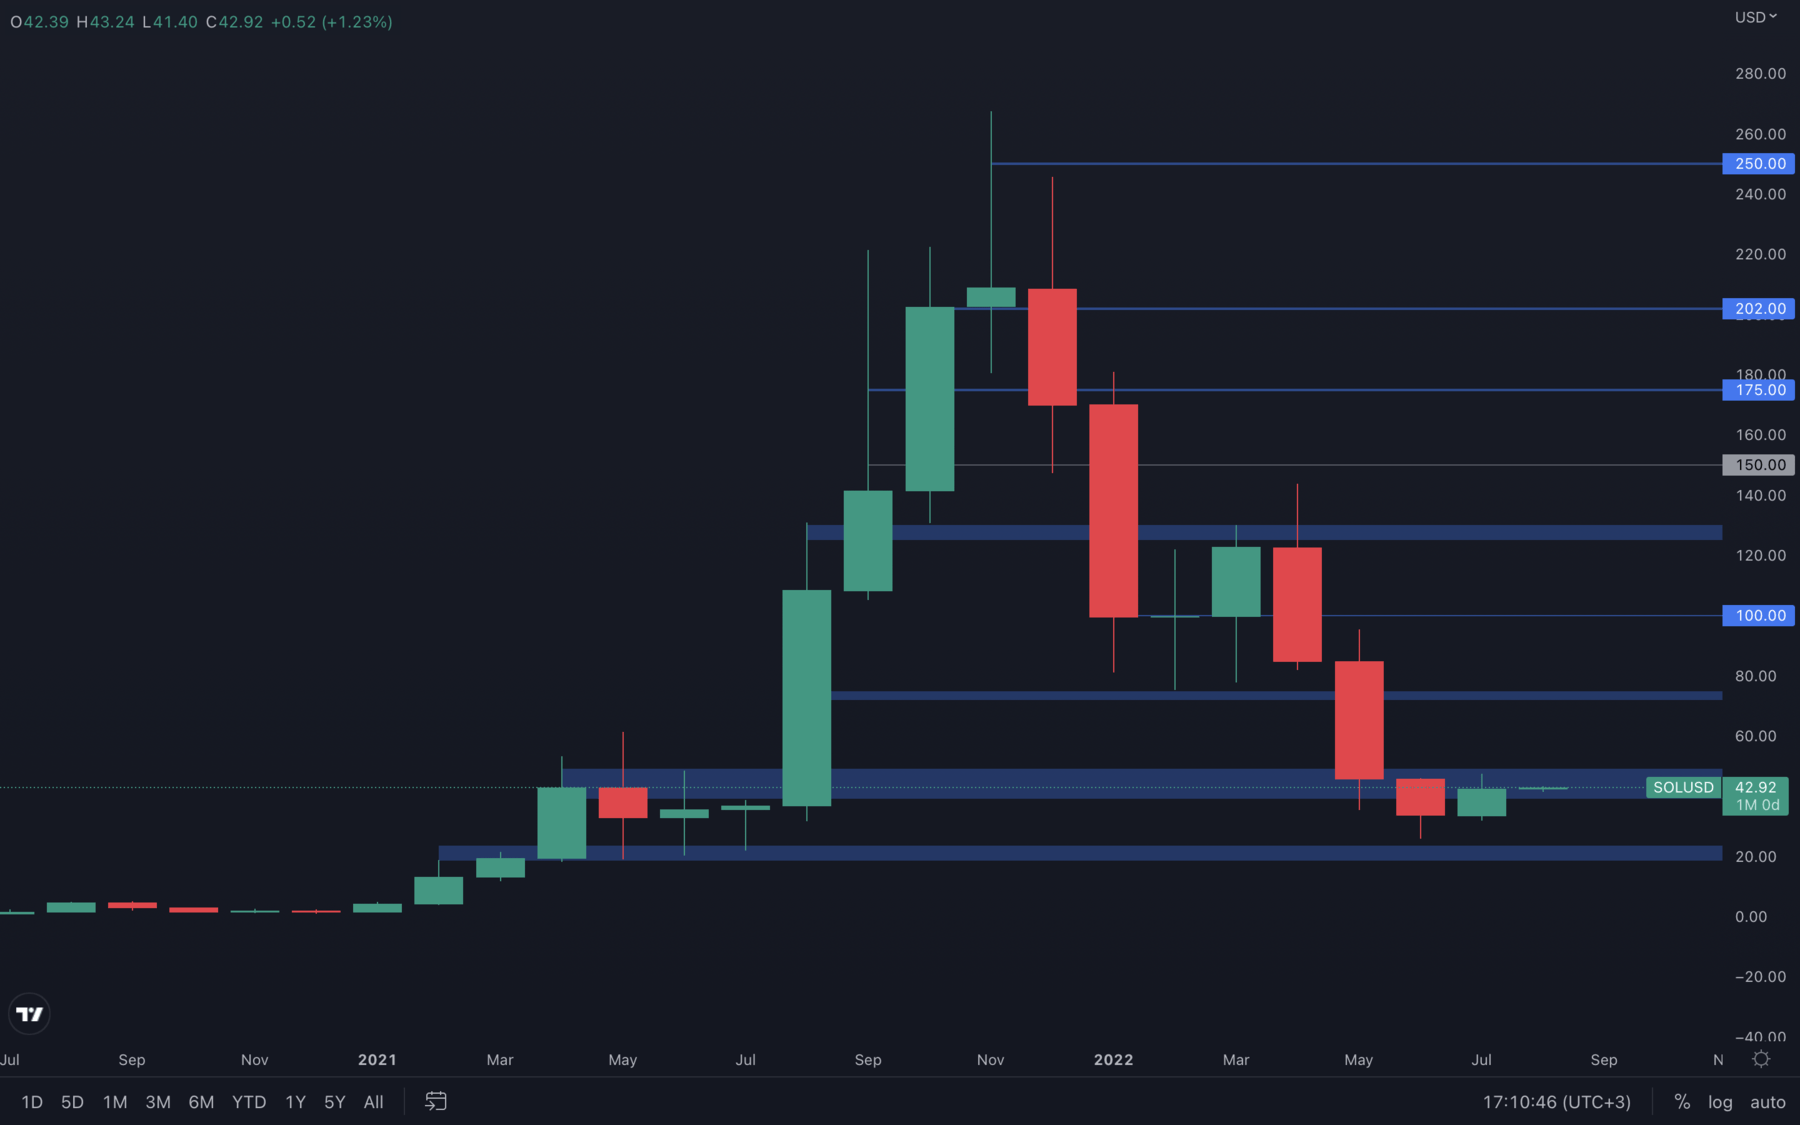
A bit of an indecisive situation for SOL, but we do know that all altcoins are influenced by the majors, which suggests SOL will continue to do the same. Because the majors have shown signs of strength after testing their 2017, respectively 2018 all-time highs, chances are we will continue to see either ranging or upside movements in August which can also bring SOL’s price towards $50 and higher.
In the coming days, it's important for SOL to hold its price above $40, as a loss of this level can potentially lead to a double top pattern forming on the daily timeframe. A weekly loss of $40 will also register a bearish engulfing candle on the weekly timeframe, which is also not what we would be looking for when sticking with a bullish bias for August.
SRM
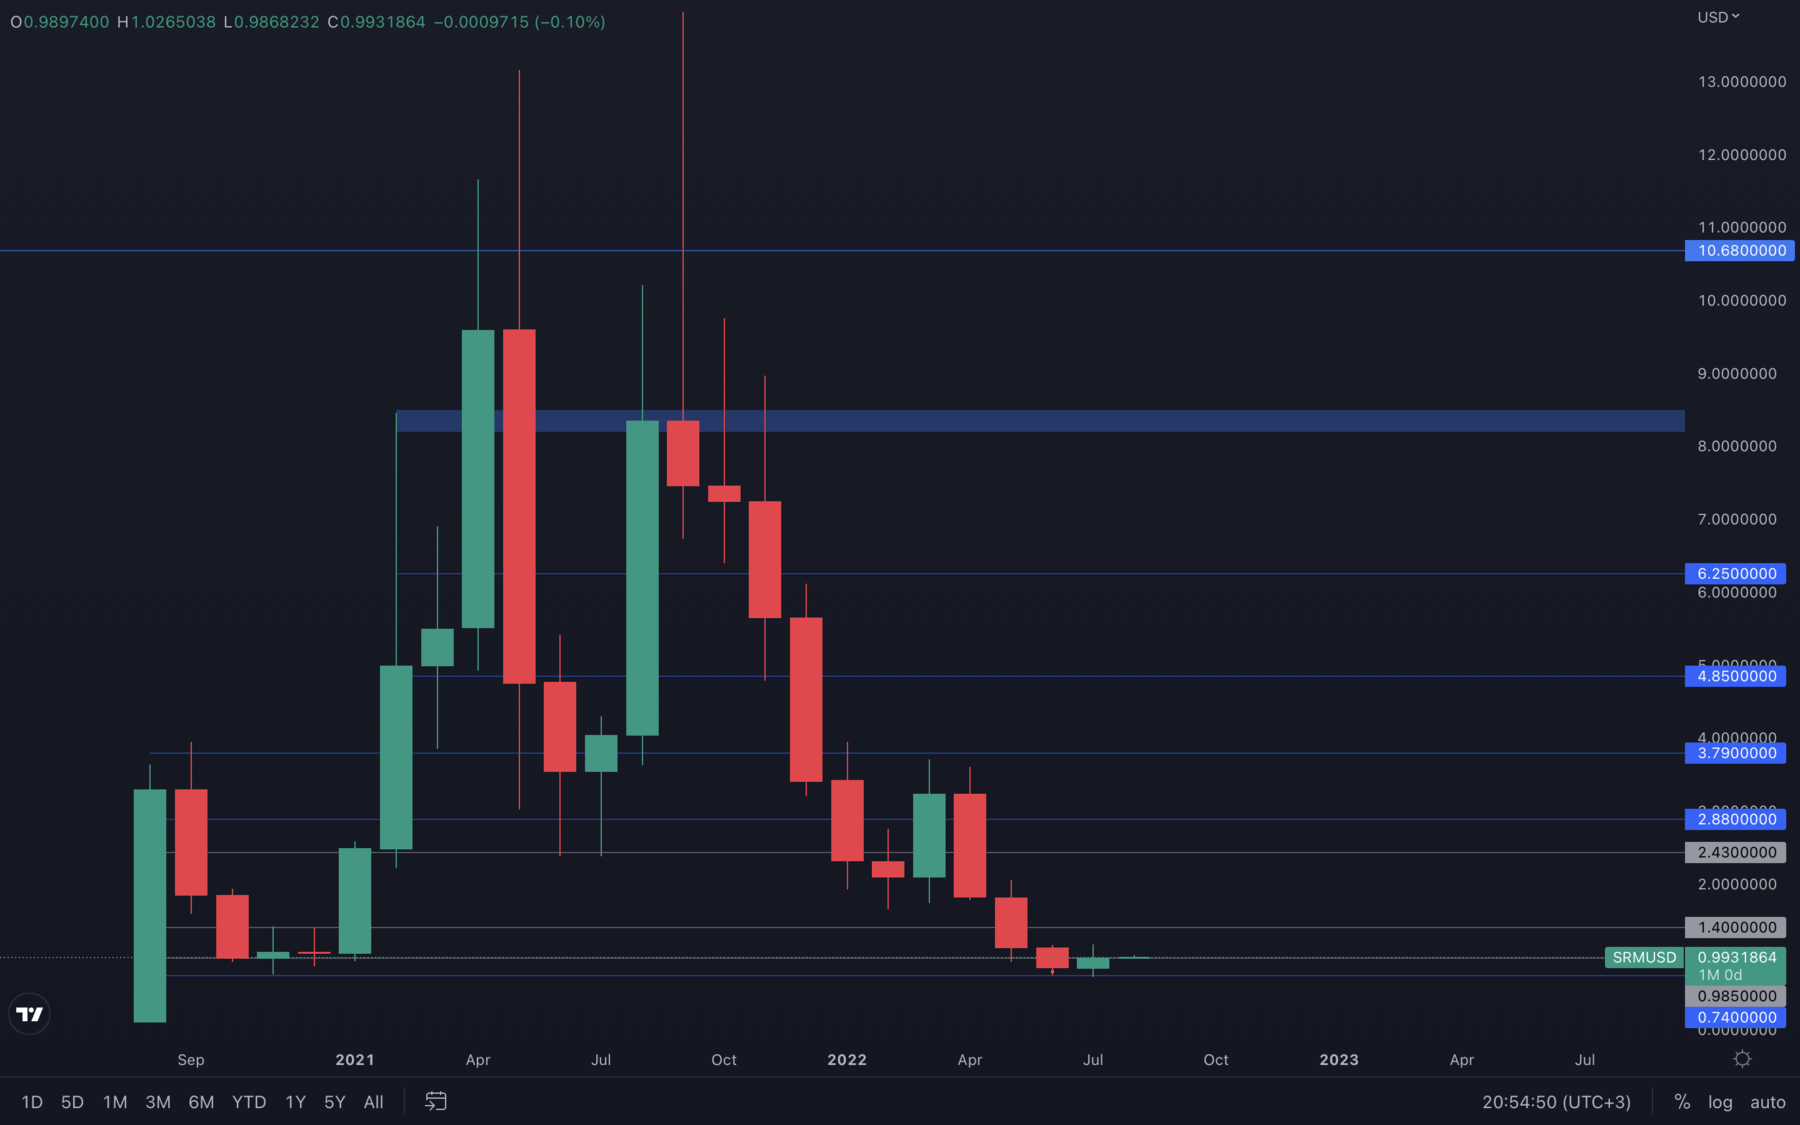 After perfectly bouncing off from its $0.74 support level, SRM reached its $1 psychological & technical level in no time but was unable to hold it for much time. At the time of writing, SRM is battling with this level and it seems like it could be lost this week, as there is also a potential lower high forming on the daily timeframe. We will keep a close eye on SRM in the coming days and offer our daily updates as usual, so you always remain one step ahead.
FTT
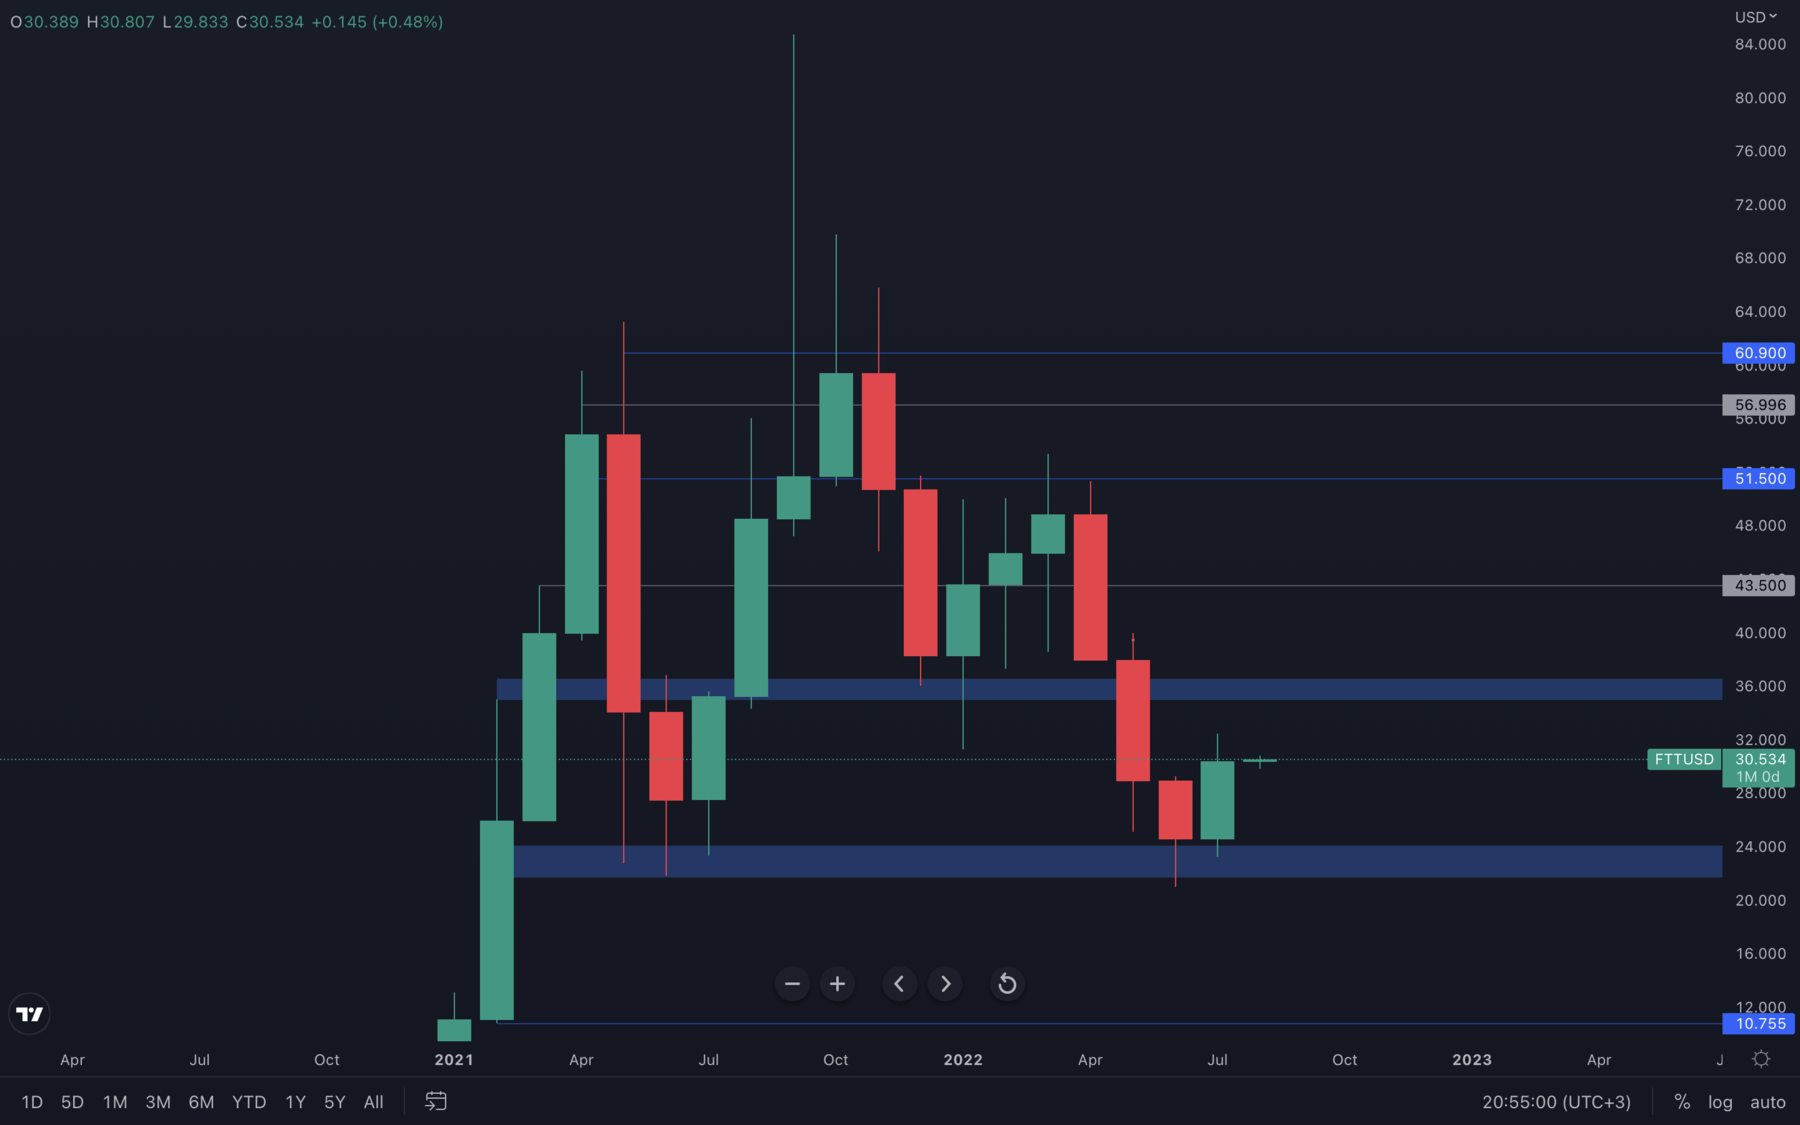 Incredible performance from FTT in July - strength has been shown at the $21.5 - $24 support area and FTT managed to close its monthly candle right in the middle of the $36 - $24 range. Not only that, but FTT also registered a bullish engulfing candle on the monthly timeframe.
To simplify the situation, FTT is now on a path toward $36, until lower timeframes show signs of exhaustion, which we will identify as soon as they happen.
MINA
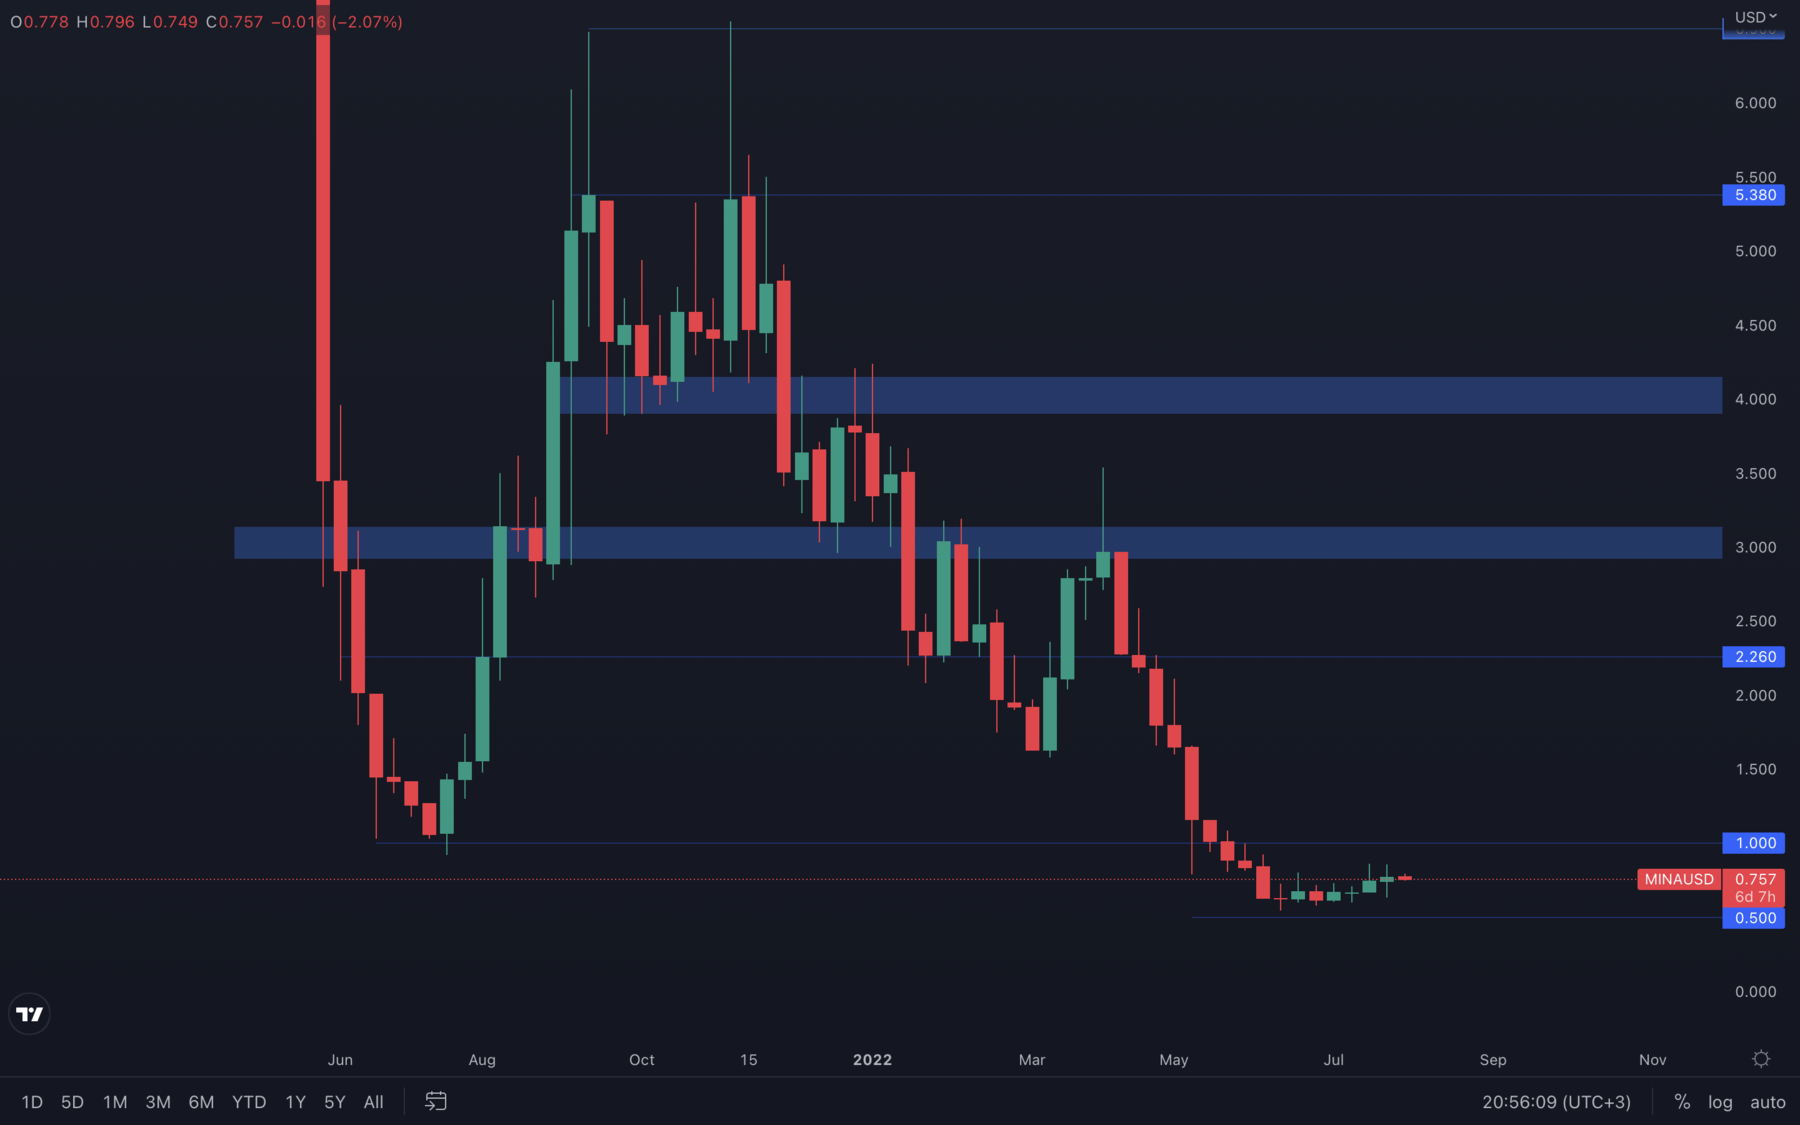 (Weekly chart was used)
This is the perfect example of "I don't know what I'm doing" - MINA has been ranging for multiple weeks, closing indecisive candles on a weekly basis. In retrospect, there isn't enough data to even confirm where MINA is headed next, but only that it will continue to range between $1 and $0.5. A break from either $1 or $0.5 will confirm where MINA is headed next, but until then, the current price action provides incredible trading opportunities for all market participants.
(Weekly chart was used)
This is the perfect example of "I don't know what I'm doing" - MINA has been ranging for multiple weeks, closing indecisive candles on a weekly basis. In retrospect, there isn't enough data to even confirm where MINA is headed next, but only that it will continue to range between $1 and $0.5. A break from either $1 or $0.5 will confirm where MINA is headed next, but until then, the current price action provides incredible trading opportunities for all market participants.
DYDX
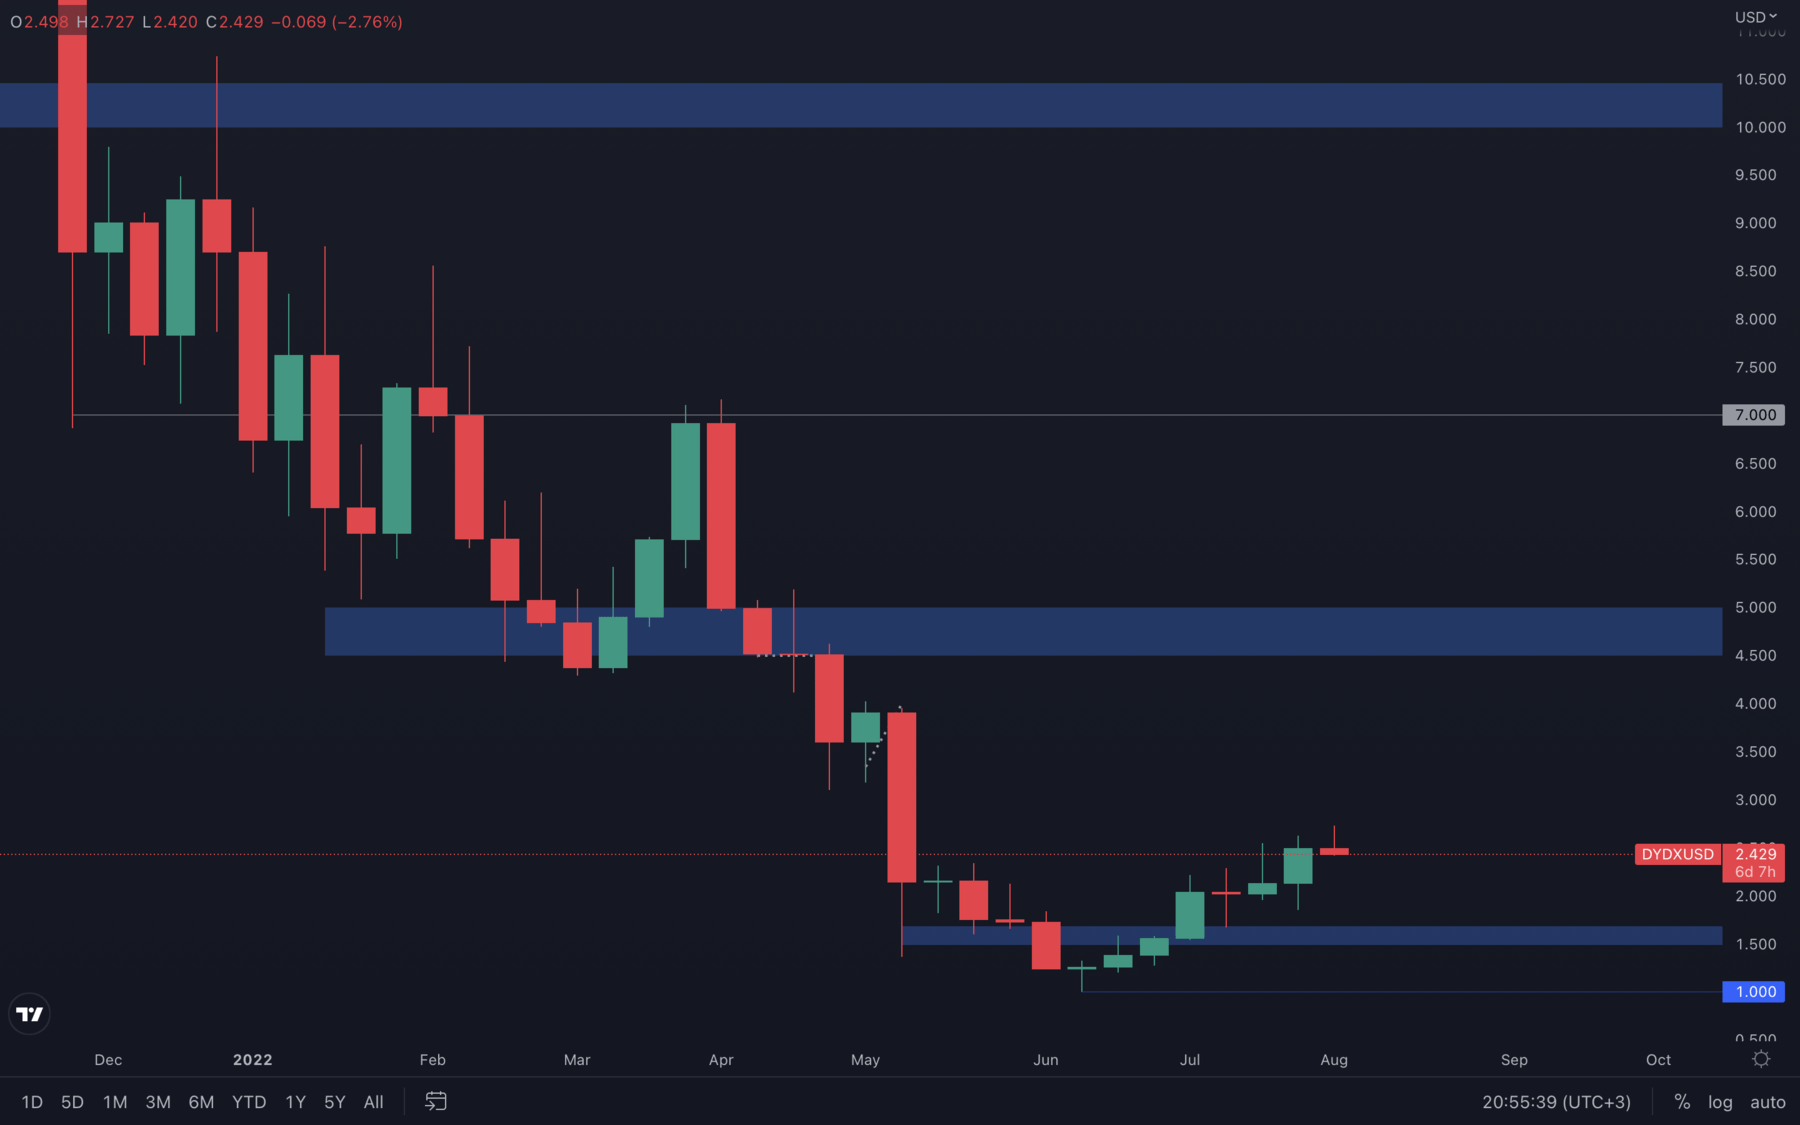
(Weekly chart was used)
dYdX has been on a rampage for weeks and became one of the outperformers in our asset list 😈. This, however, comes with the risk of bullish exhaustion - at some point, dYdX will have to cool off and head towards a higher low, most likely around the $1.5 - $1.6 support area as we haven't experienced an actual retest that's worth mentioning. We believe this will happen in August, as dYdX has already risen over 145% from its $1 level.
Knowing how to react to multiple scenarios is always important - assuming dYdX will continue to rise, it's wise to interpret psychological levels such as $2.5, $3, $3.5, and so on as key resistance levels. For now, dYdX is experiencing selling pressure after reaching its $2.5 level, so this has become a local resistance level that needs to be broken (weekly closure above it) in order to confirm further upside.
Summary
All-in-all if we look at the biggest wallet cohorts, they’re still not risking-on (buying). This cohort will also be known to not chase prices higher, especially if we have some significant resistance above us between $23,455 and $24,855, it is unlikely they will add at the current price levels and at least wait for a pullback. It’ll then be important to assess if a pullback is added by these wallet cohorts. Lastly, the Hash Ribbon indicates that a miner capitulation is underway but has perhaps to really get going. This suggests that we may see lower prices before we really get a macro bottom and then a recovery.On another note, it will quite difficult for the majors to break above their closest resistance levels, as we are now experiencing a bit of selling pressure as we head into the first week of August. However, we remain quite confident that $26,000 will be tested this month, but also that any actual movement above it will be cut short due to lack of conviction and even volume in the markets.
Recommended from Cryptonary


