Save 23% ($351) & Get a Free 1-1 Call with our Team ⏰ : 0d 2h 59m 43s

Disclaimer: Not financial nor investment advice. You are responsible for any capital-related decisions you make, and only you are accountable for the results.
Summary for May ’22
- Total Market Cap – -22.67%
- Altcoins Market Cap – -28.13%
Macro
With 2022 being centered on the economical state of the world and with the FED aggressively trying to combat inflation, it's safe to assume this year will be slow and boring for the crypto market, but absolutely necessary. Hyperinflation has been crypto's #1 friend throughout 2020-2021 and is the reason why we've reached such high price levels. With that missing now, market participants, mostly retail, are not interested in entering the market anymore, which will result in a stagnating state for the rest of the year, but it will also prepare us for an even bigger rally in the future.TLDR
- In prior bear markets, Bitcoin's price has always retested the realised cost basis. This currently stands at $24,000 to $26,000.
- The odds of a $1T test for the total market cap are now increased after a monthly closure under $1.35T.
- Over the past months, the number of Bitcoin wallets holding over 1000 Bitcoins has been decreasing.
- A potential short-term rise should be expected, but the overall market sentiment remains the same.
- The MVRV Z-Score suggests that Ether is approaching its green 'buy zone' - historically, it serves as a great time to buy Ether.
Total Market Cap
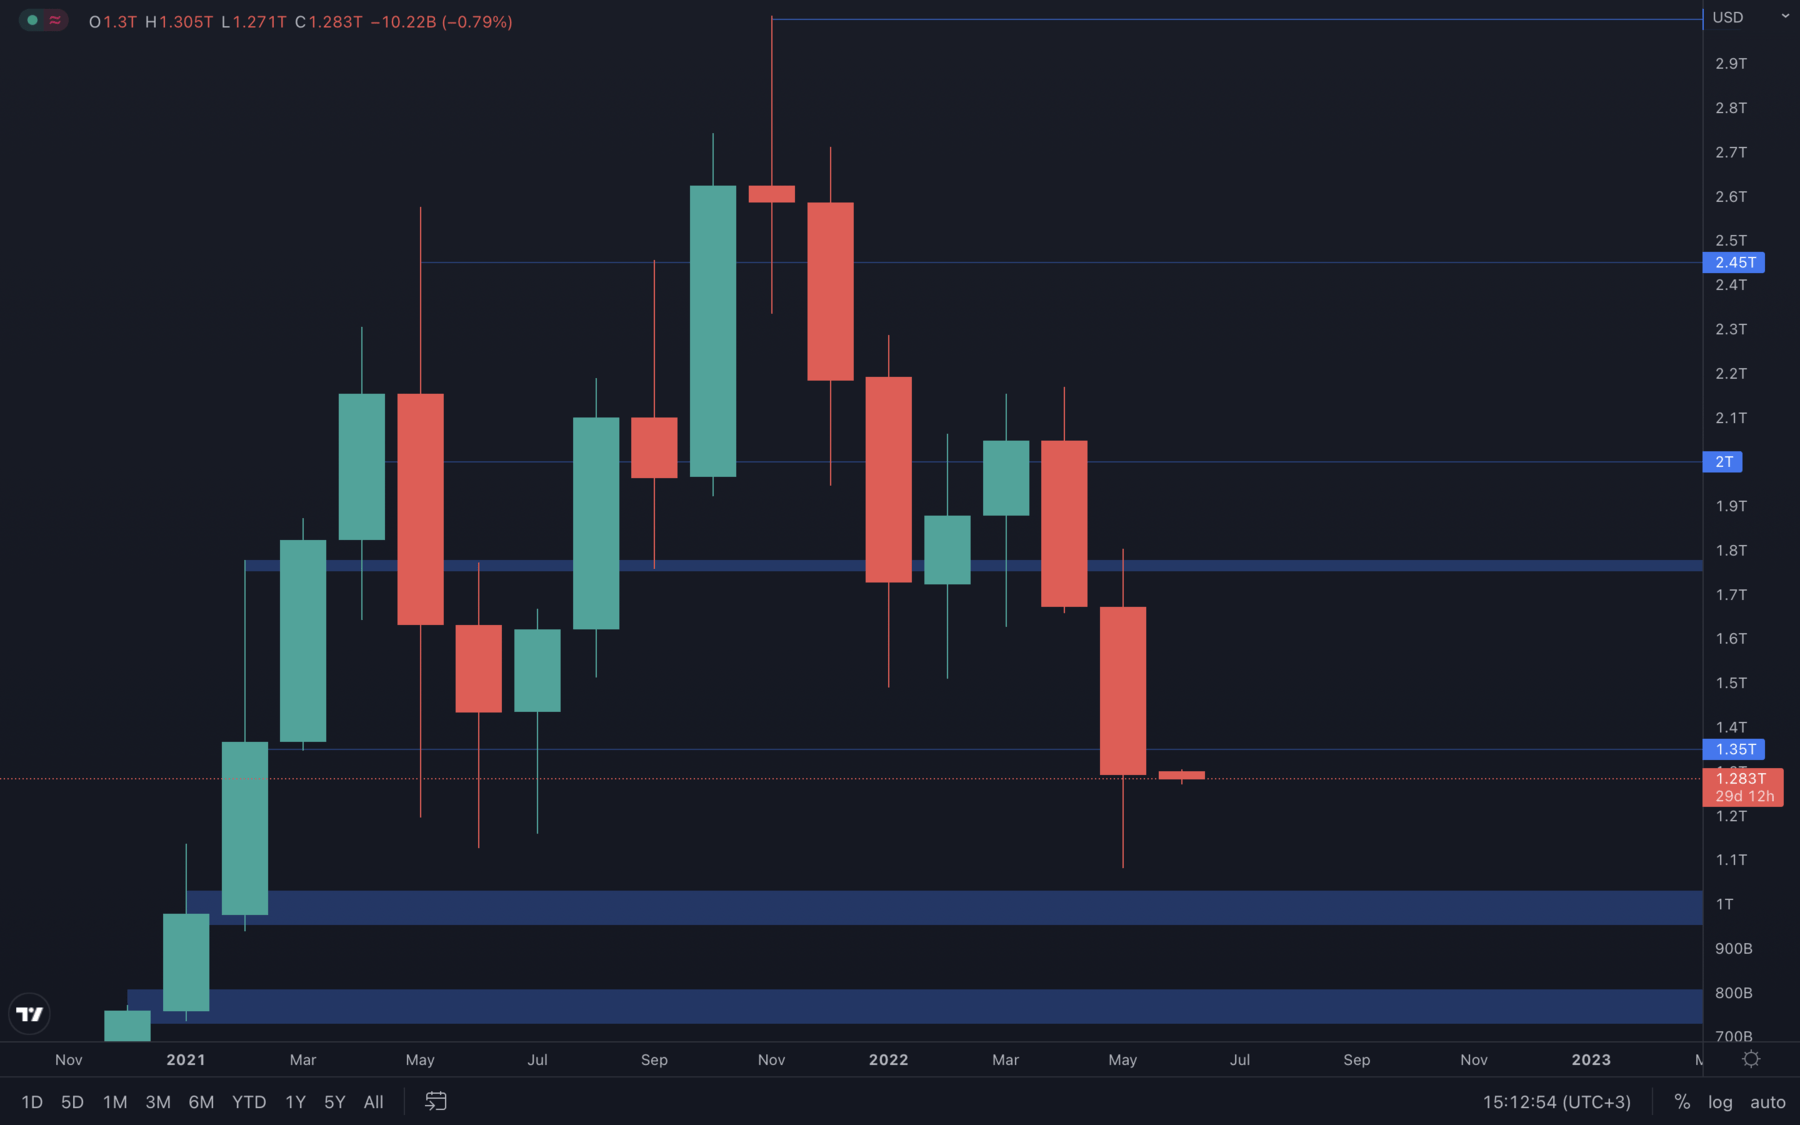
May has been quite an aggressive month for the crypto market. We've seen the total market cap go as low as $1.08T, a level we haven't tested since February 2021. A monthly closure under $1.35T puts the crypto market on a path to the $1T psychological and technical support level, but we might be looking at an early month rise first, as most assets are already at crucial support levels and the S&P 500 Index can also be seen rising significantly. Overall, June will most likely also close bearish, as there is not enough buying pressure to sustain moves higher.
Altcoins Market Cap
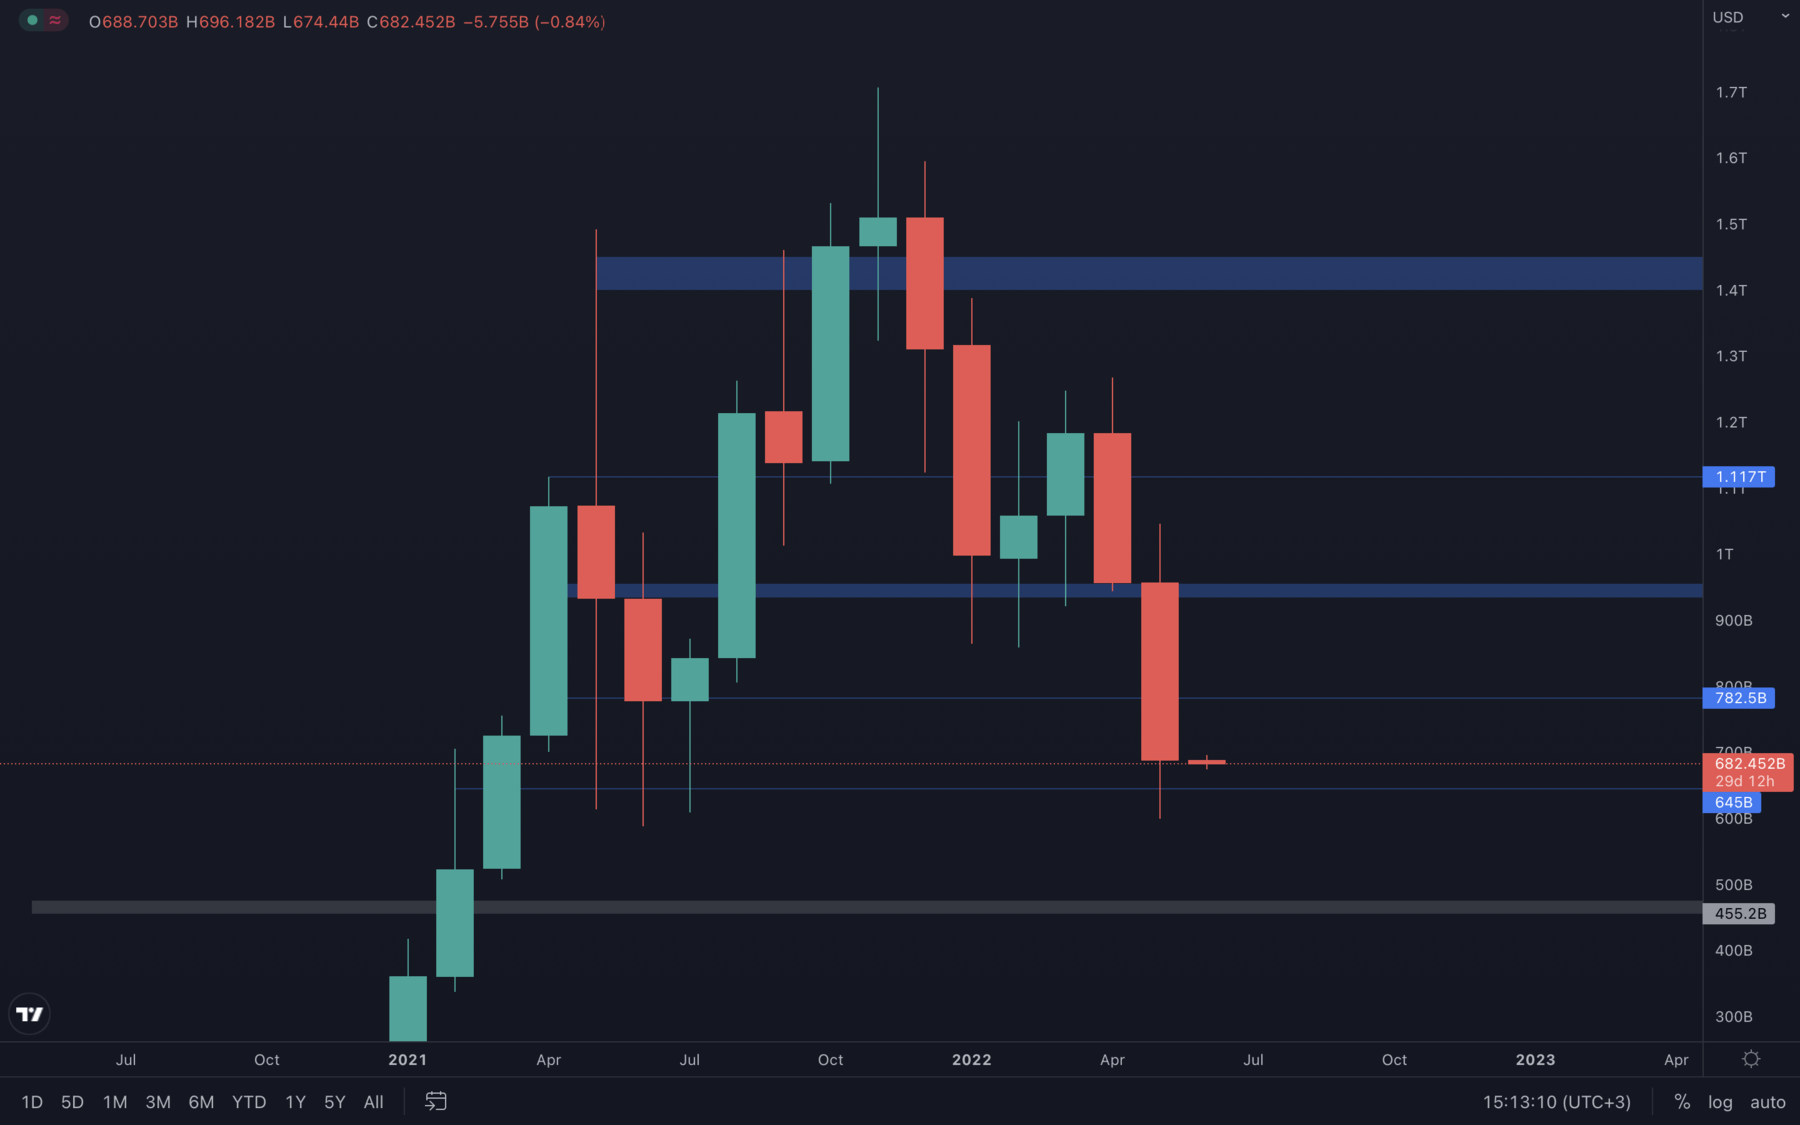 The altcoins market cap suffered an even bigger loss in May, with Bitcoin's dominance rising by 9%. With that said, the altcoins market cap still closed above its $645B support level, which indicates that we are indeed looking at a possible rise in early June. A weekly closure under $645B will suggest further downside and a possible $500B - $450B support test.
Bitcoin - Technical & On-Chain Analysis
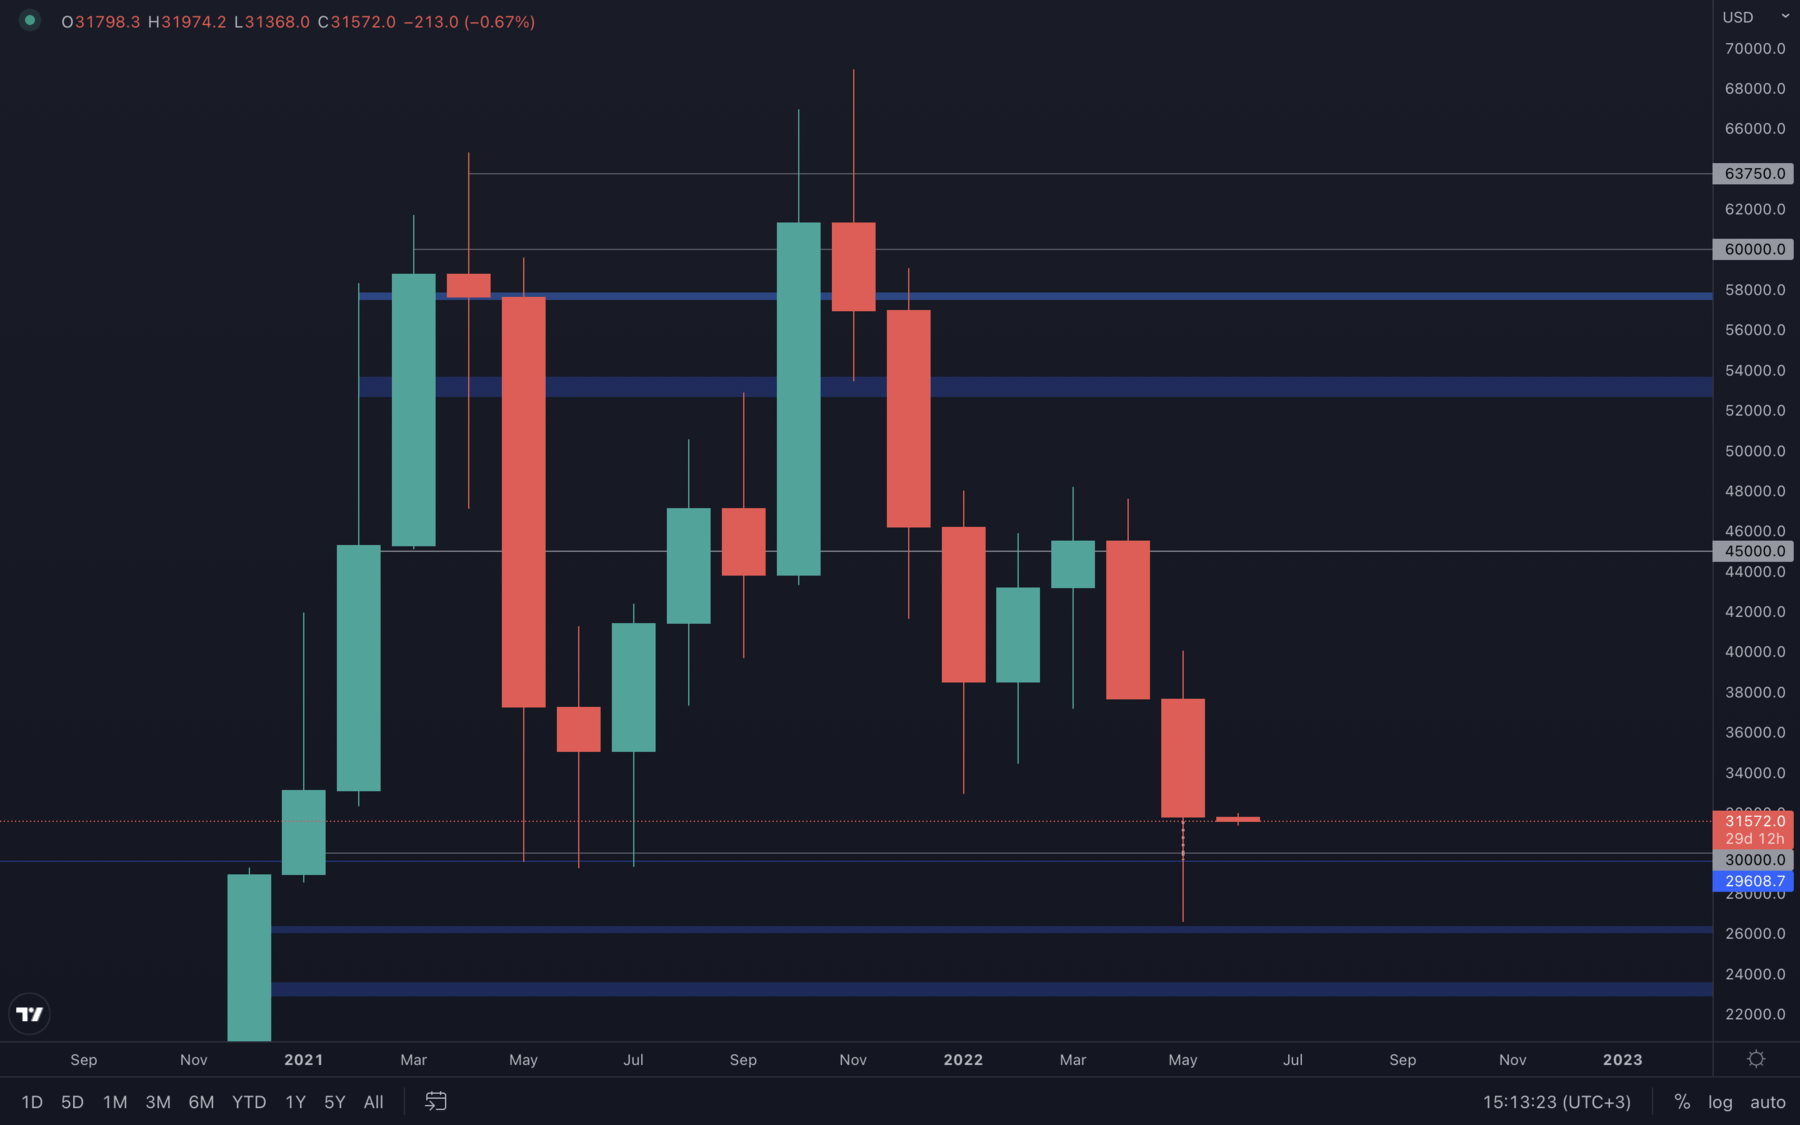 For Bitcoin, May has been a fast-paced month with lots of unexpected price movements. Even though we've seen BTC come down to as low as $26.700, May still closed above $30.000, which suggests that until we have a monthly closure under $30.000, we cannot expect further downside. This can also be determined by a weekly closure under $30.000, as it still serves as a high timeframe.
A monthly market structure change can now be finally confirmed, as the drop to $26.700 formed a lower low. We now have a confirmed bearish market structure on the monthly timeframe, which, in other terms, can be described as a bear market. These are times when the transfer of wealth occurs, from the impatient to the patient.
As always, caution at extreme levels is advised - we're no strangers to the crypto market volatility and we should always treat it as it should be treated.
Metric 1 – Exchange Net Position Change
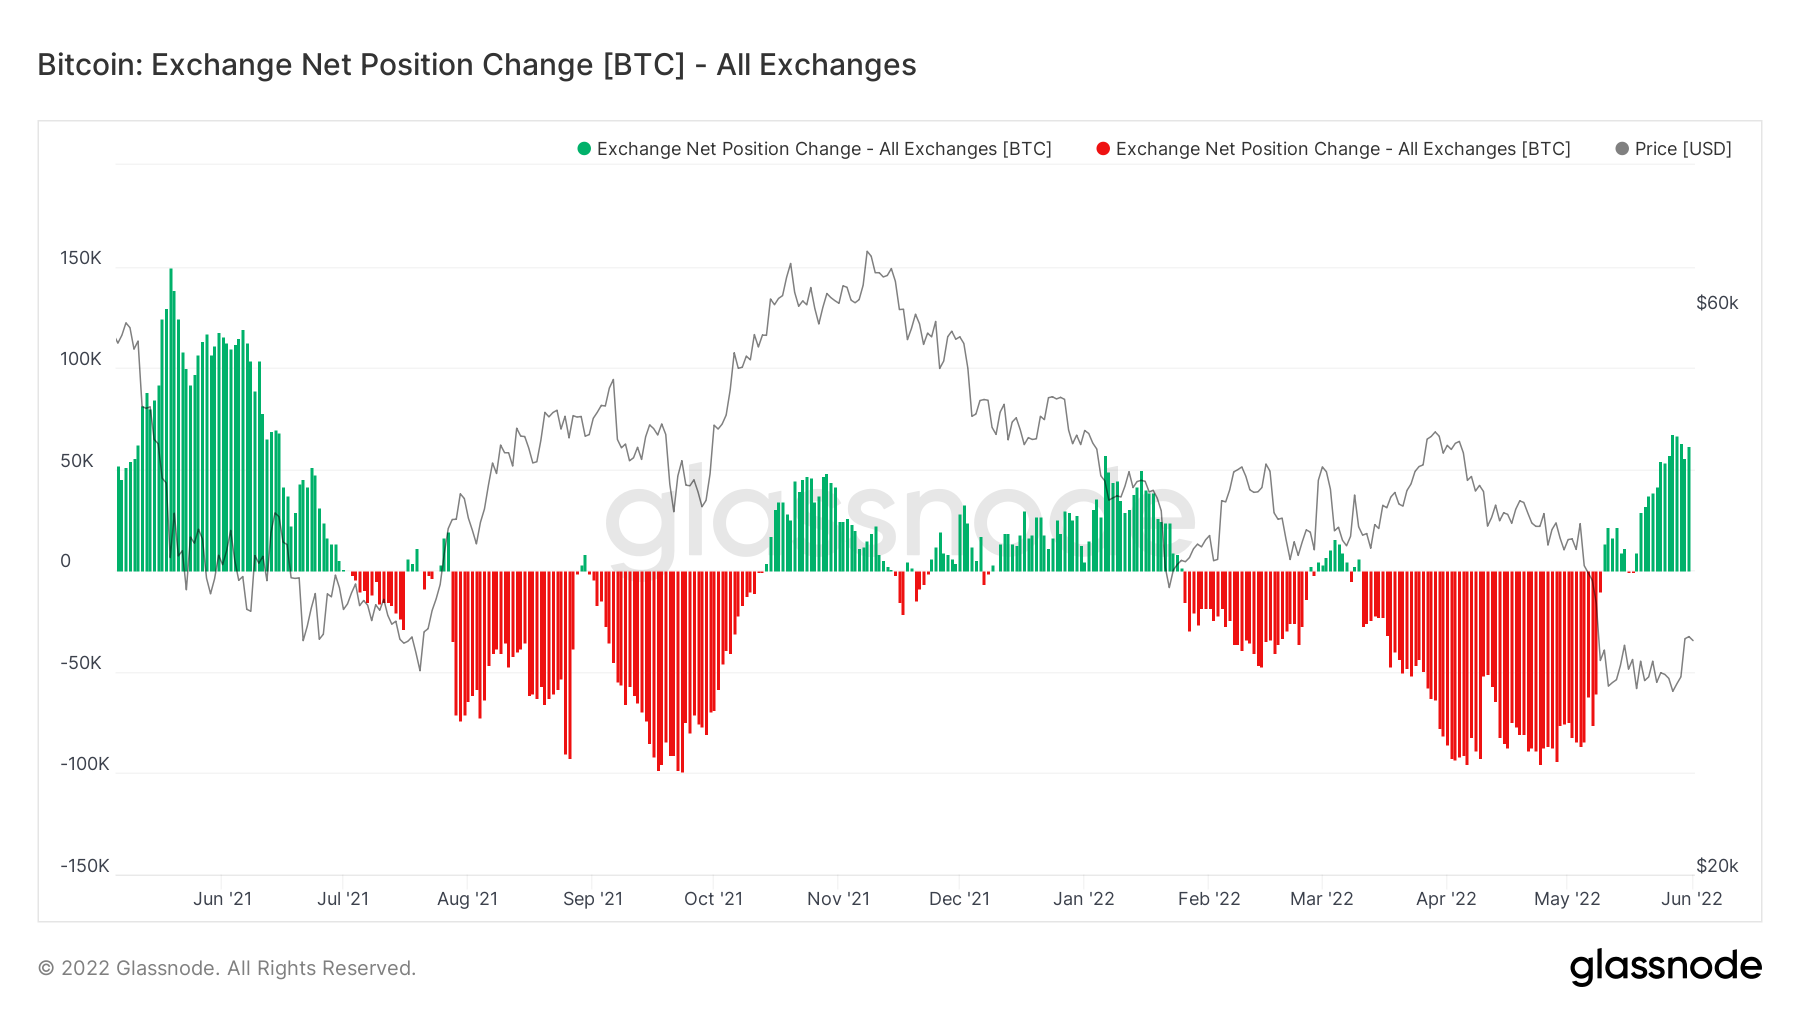
The Exchange Net Position Change shows that over the last month, there has been a change in sentiment from investors. We saw accumulation throughout April and into May, however, in the last 7-10 days, investors have sold large portions of supply which has resulted in significant green spikes on the Exchange Net Position Change.
Bitcoin – Exchange Net Position Change
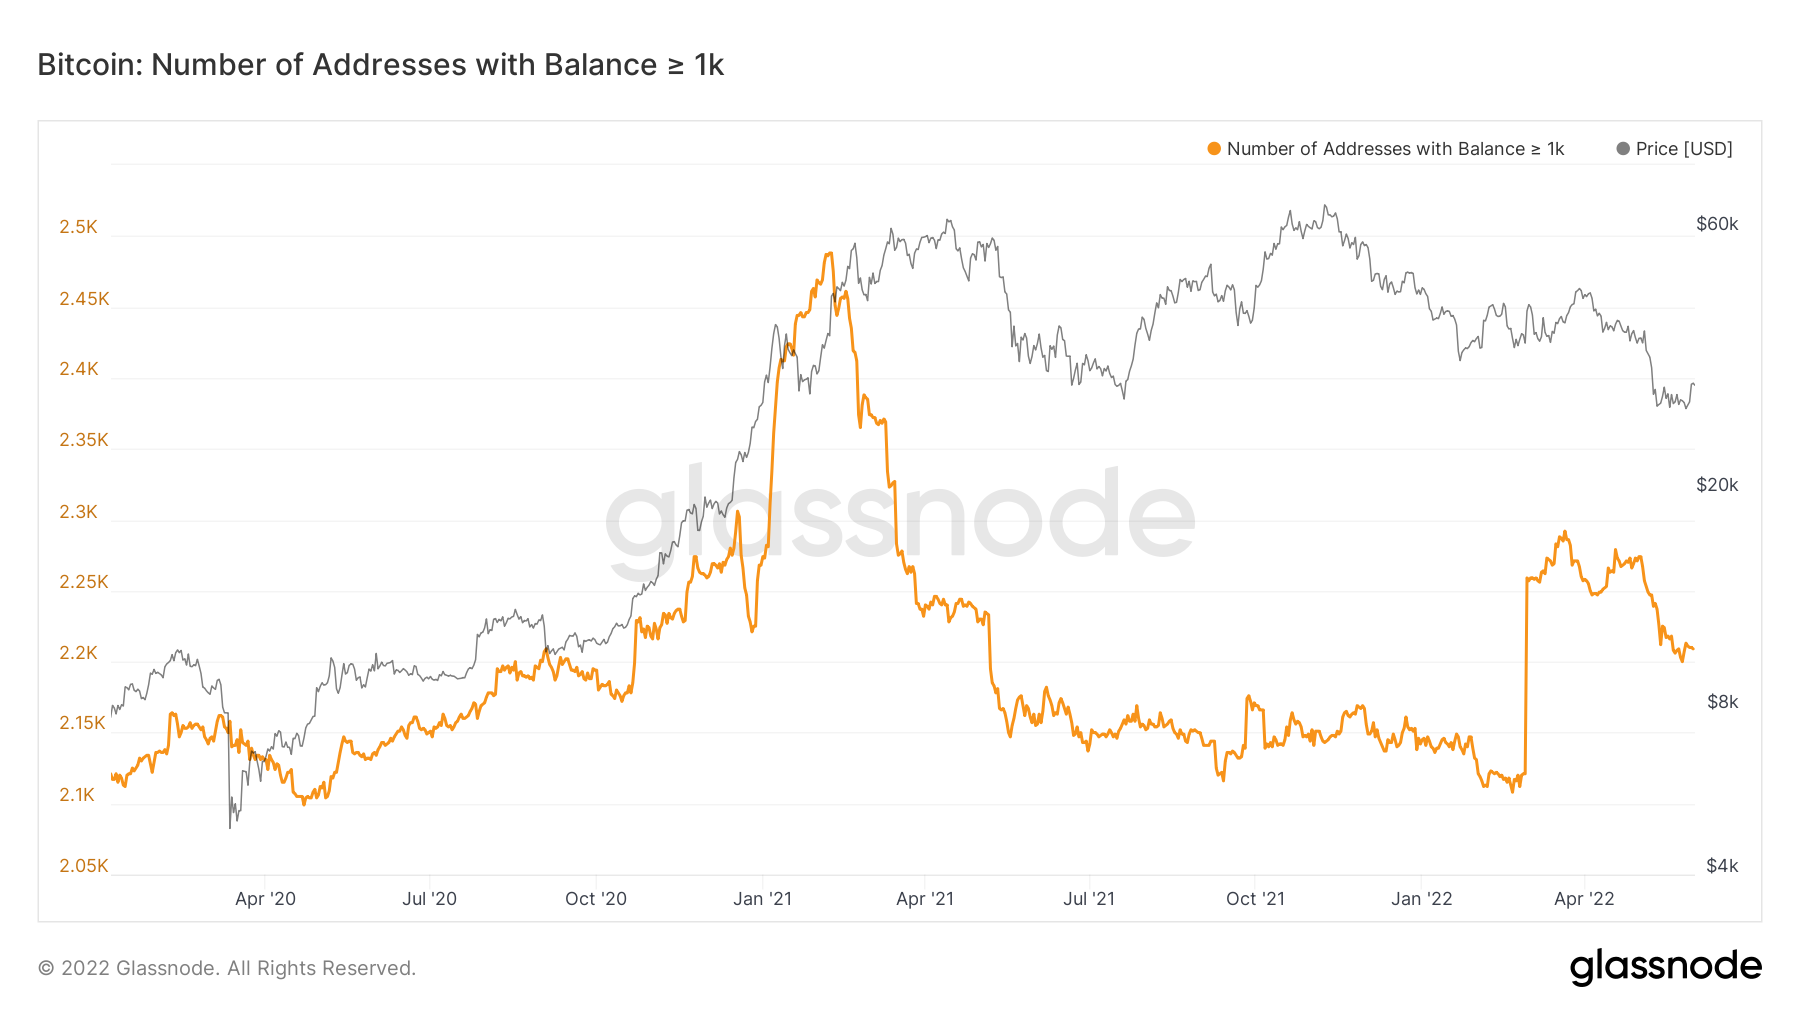
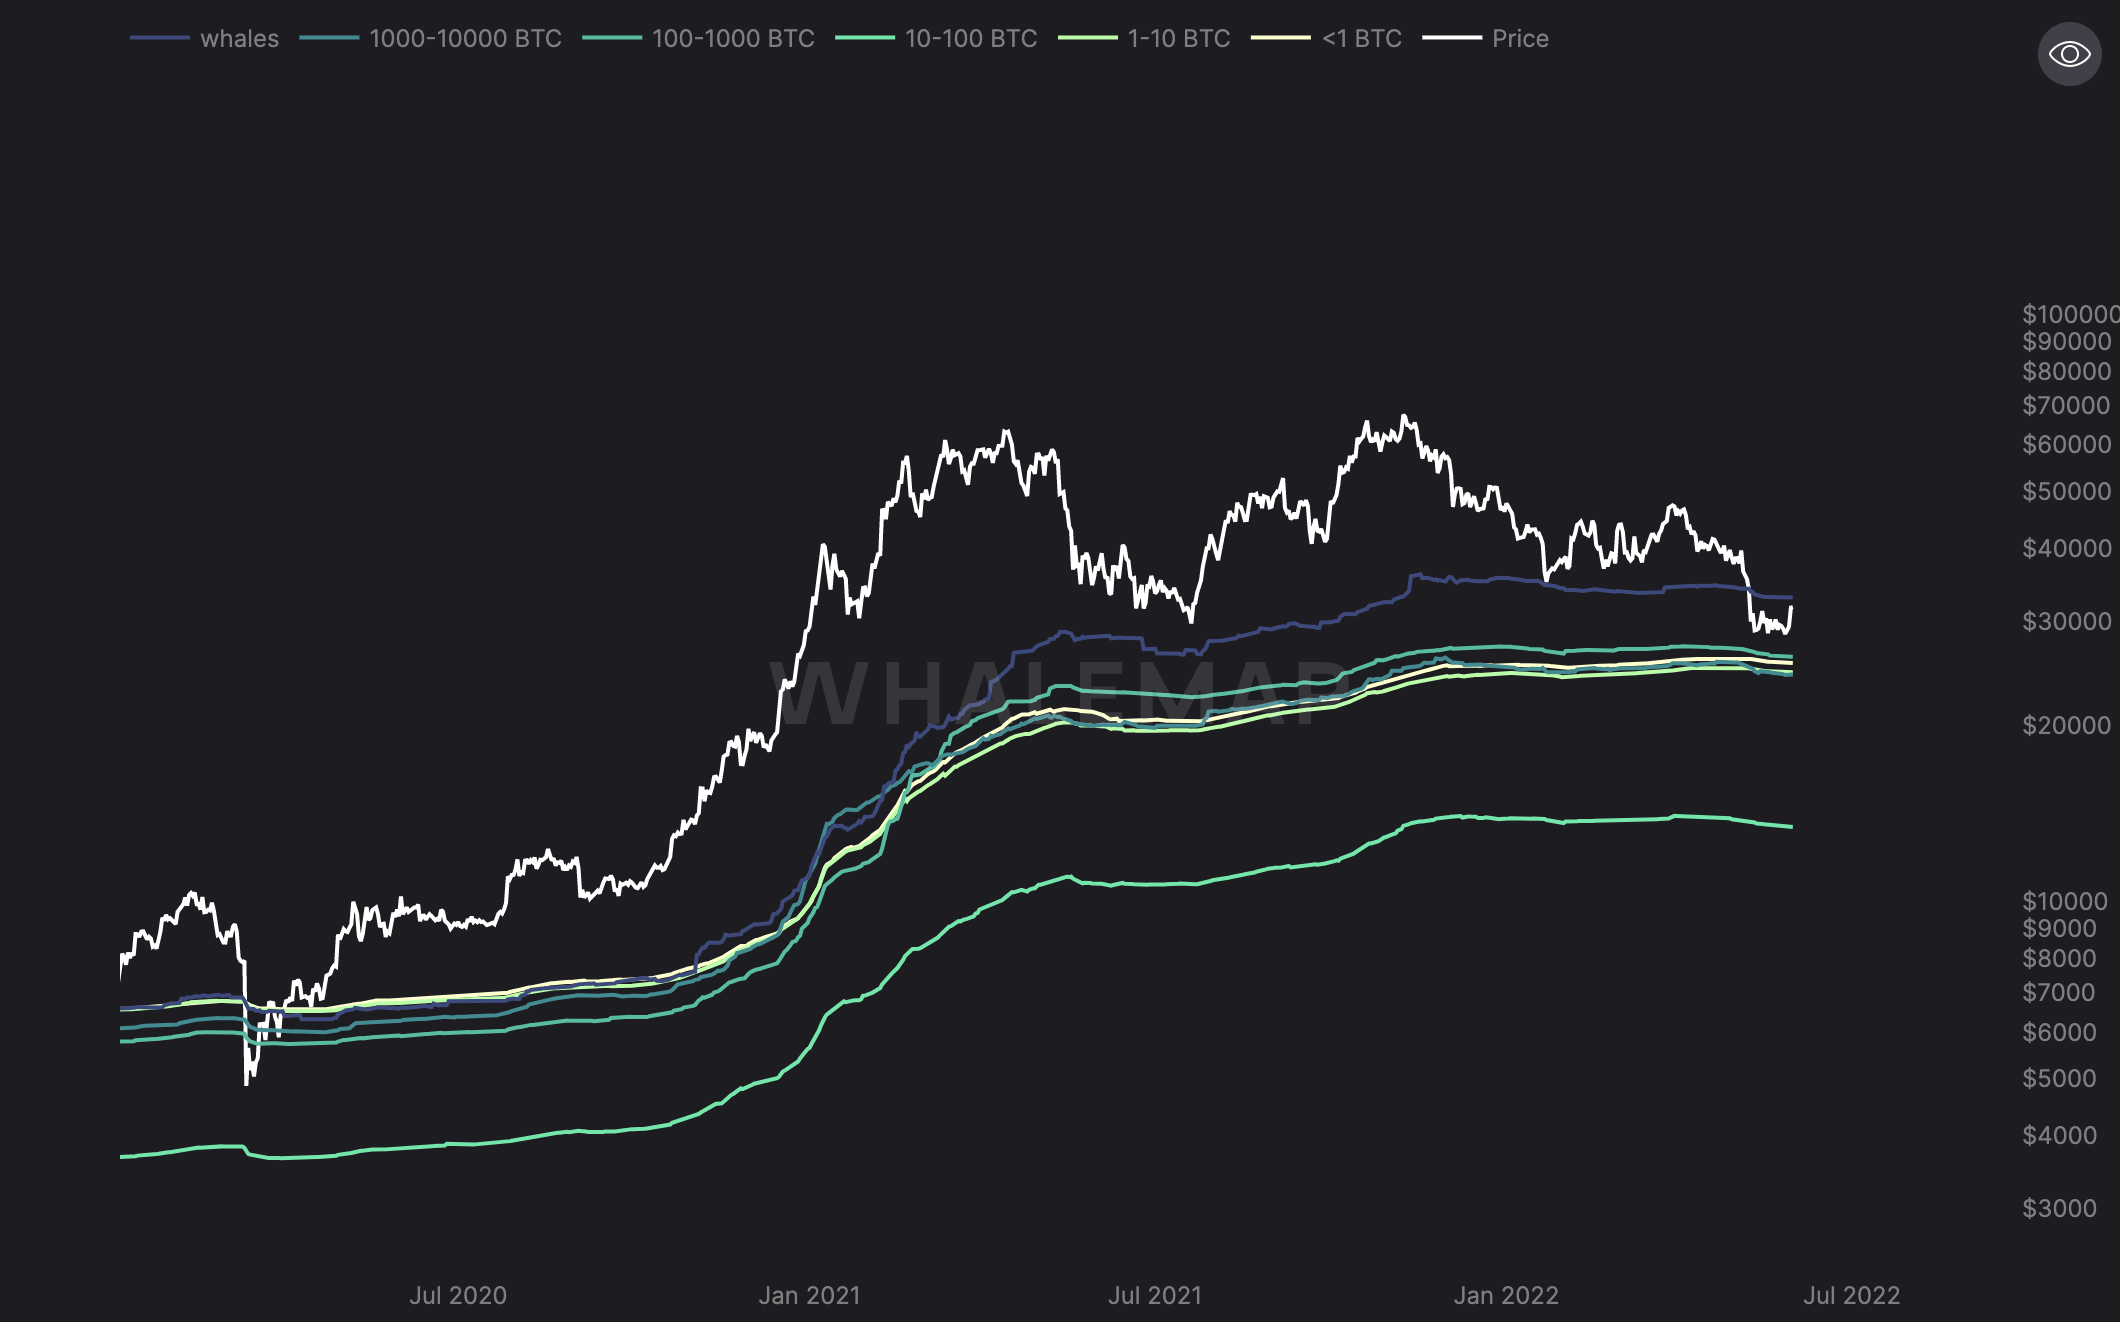
 Metric 2 – Wallet Balances > 1,000 Bitcoin
Historically, the most profitable wallet cohort is the wallet addresses with a balance > 1,000 Bitcoin. We can see over the past months that the number of wallets in this cohort have been decreasing in size. This suggests that this wallet cohort is continually reducing their exposure to Bitcoin, and with the knowledge that they're historically the most profitable cohort, it would be wise to emulate their behaviour. Once this cohort begins increasing their exposure, this would likely be the signal for us to do the same.
Bitcoin – Wallet Balances > 1,000 Bitcoin
 Metric 3 – Realised Price by Addresses
The last metric we will cover is the Realised Price by Address. This visualises the average price at which current unspent Bitcoins belonging to each cohort of addresses were bought. In prior bear markets, Bitcoin price has always retested the realised cost basis. This currently stands at $24,000 to $26,000. Therefore, it may be the case that we visit these levels in this bear market and as investors, we should be prepared for this possibility.
Bitcoin – Realised Price by Addresses
Ether - Technical & On-Chain Analysis
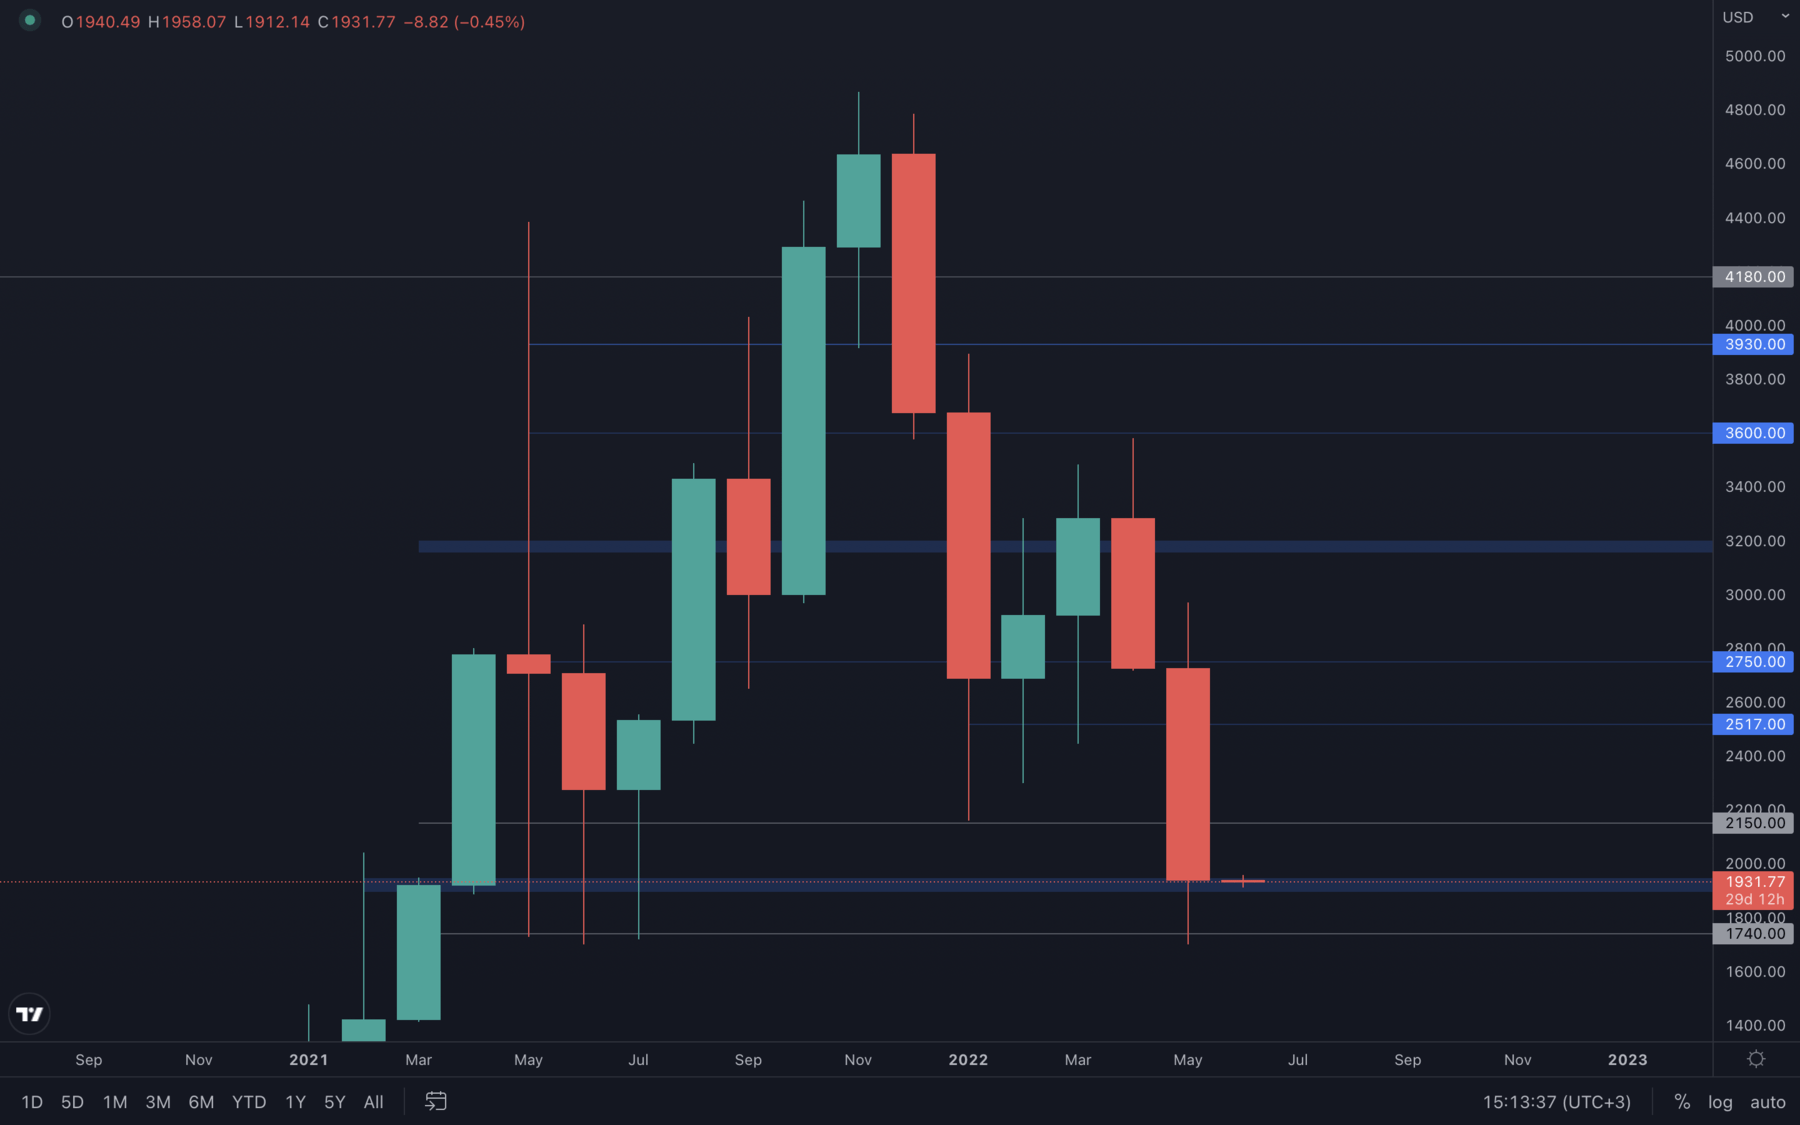 The bearish engulfing April candle really said "prepare yourselves". Following the bearish engulfing candle in April, ETH went as low as $1740, a crucial support level that we've seen act as an important area of interest multiple times in the past. Price then closed above the $1900-$1950 support area, which can suggest that we might see an early June rise for ETH, given how most assets share the same price action with that of BTC.
Overall, ETH's monthly timeframe also shows a confirmed bearish market structure, which will most likely not be reversed for the next few months - expect ranging.
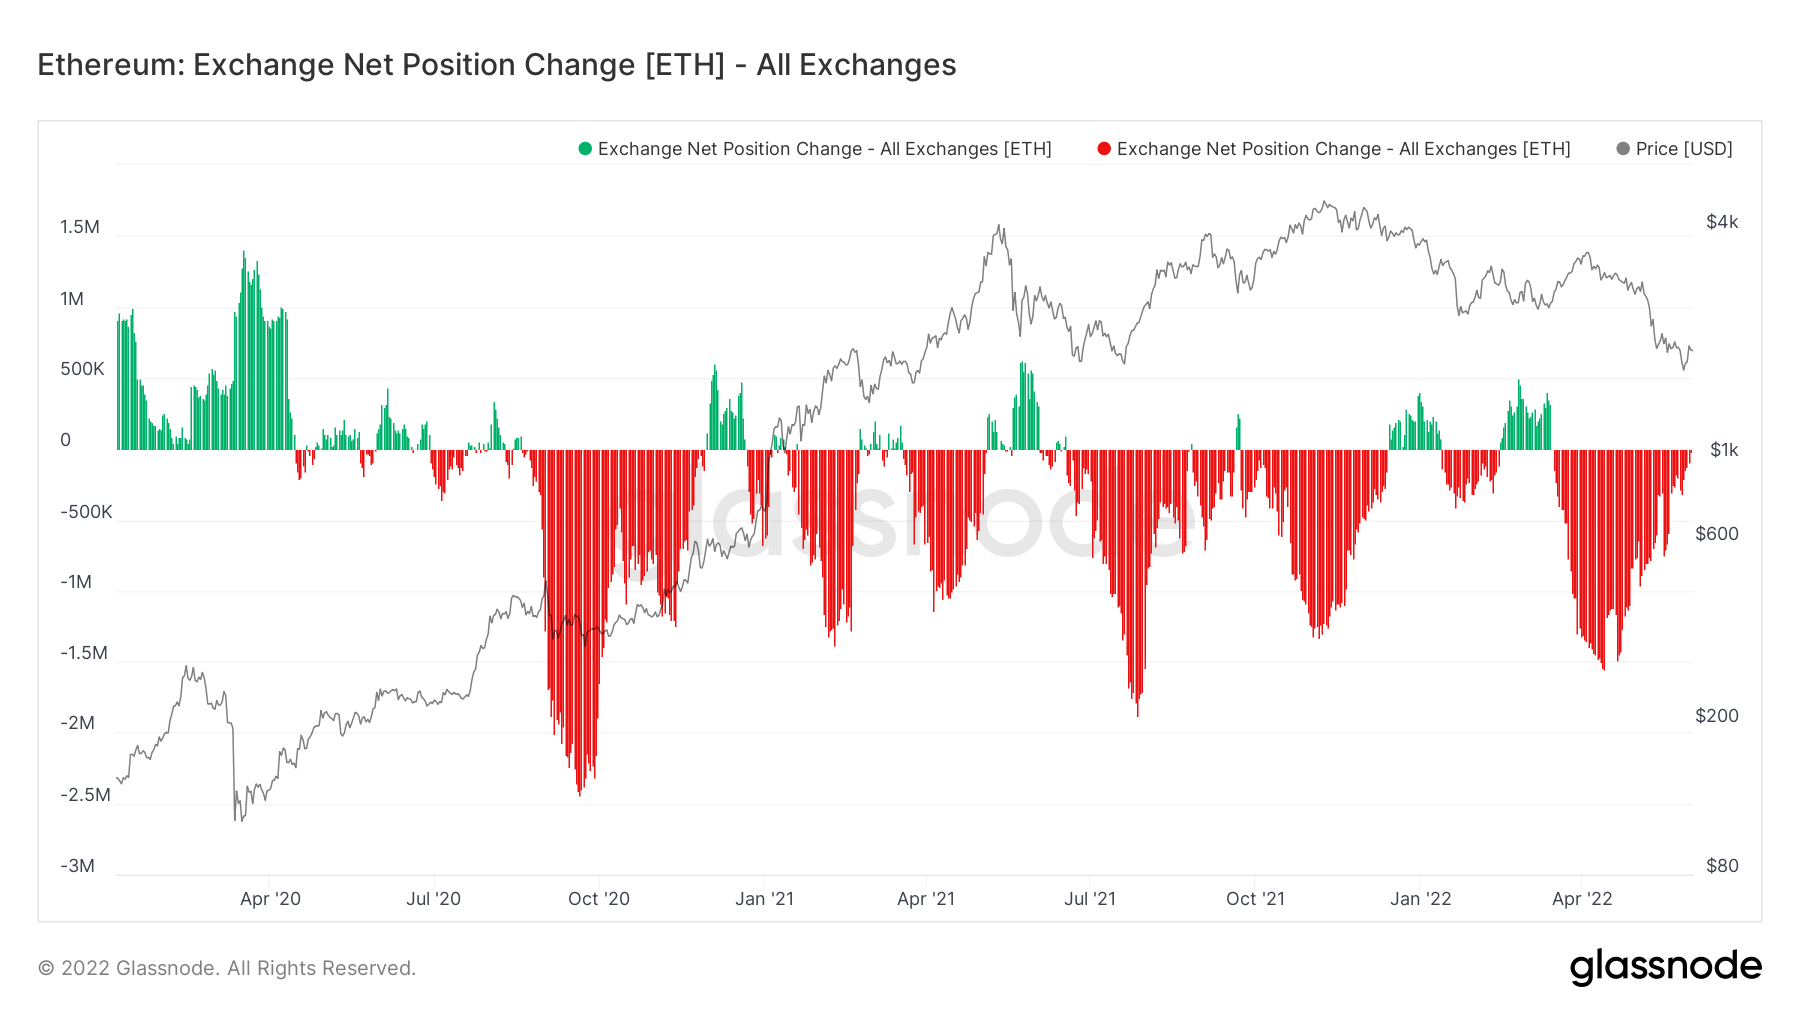
Metric 1 – Exchange Net Position Change
We can see that the Exchange Net Position Change for Ether reflects a different picture from Bitcoin. We can see over the past weeks that there has been accumulation (more Ether leaving Exchanges for cold storage wallets than flowing into Exchanges to be sold). However, in the past few days, this level of accumulation has slowed to almost net neutral (roughly the same amount of coins flowing into Exchanges as flowing out of Exchanges).
Ether – Exchange Net Position Change
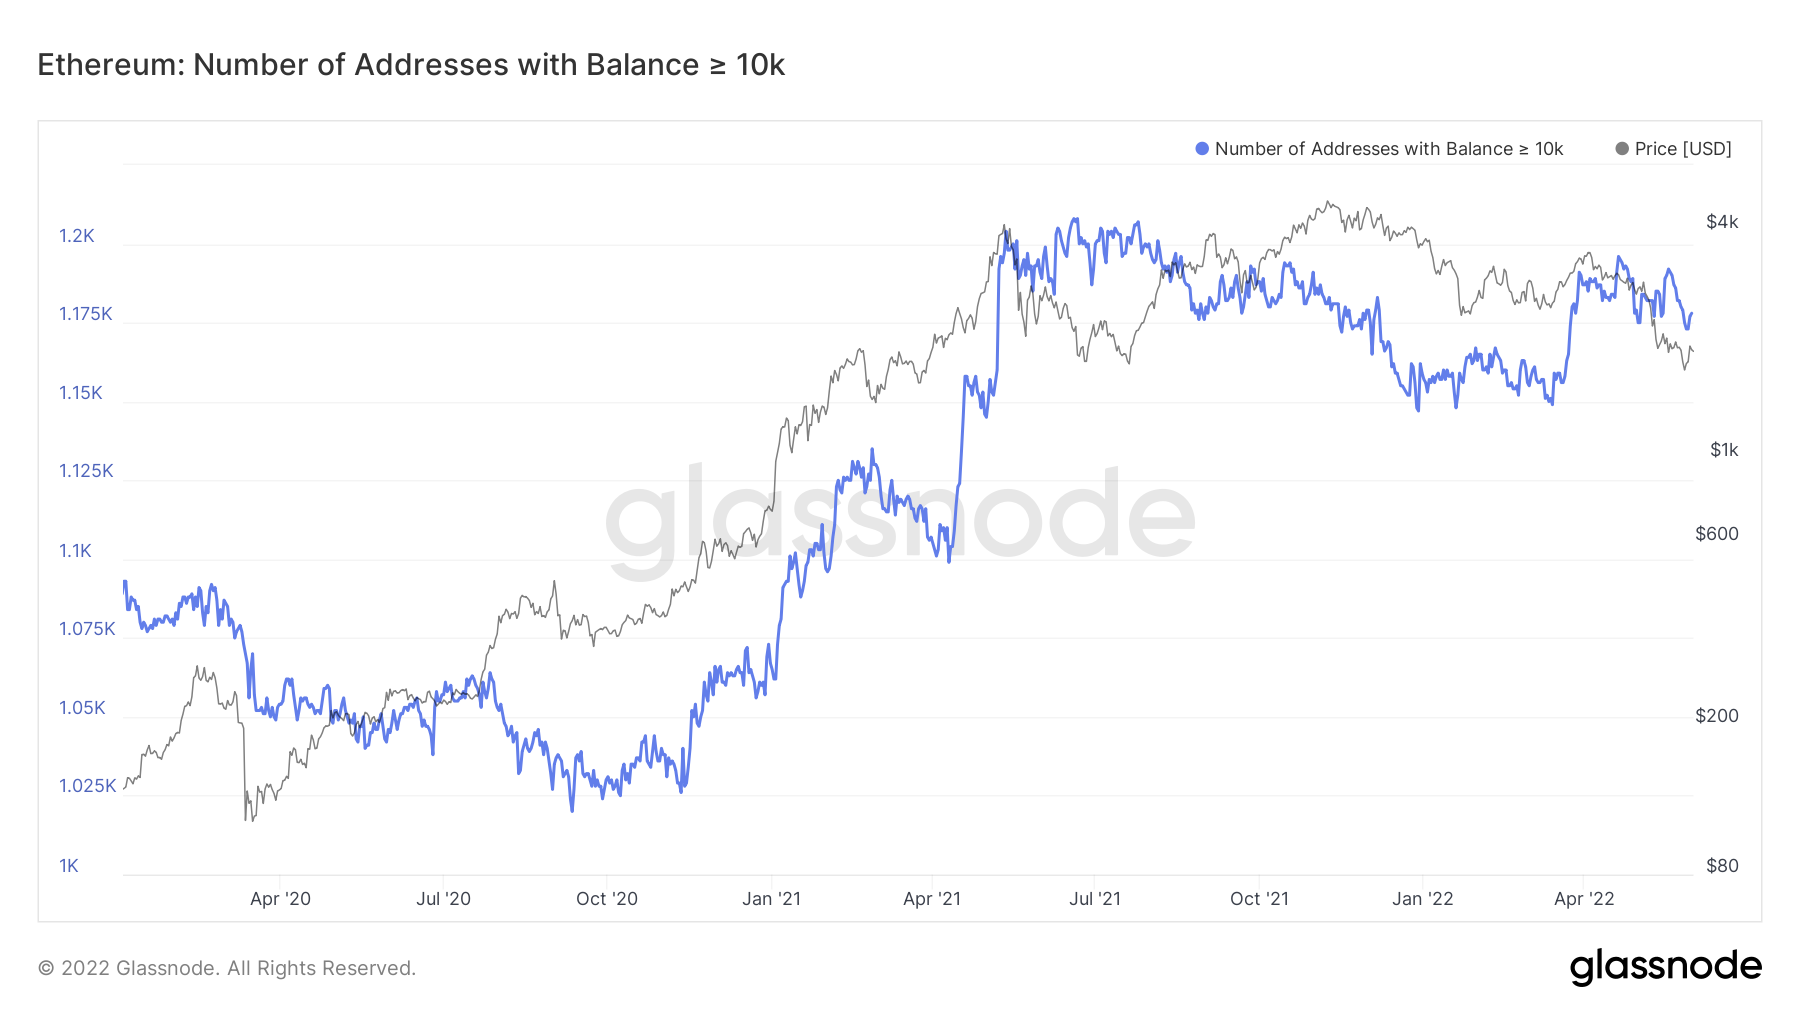
Metric 2 – Wallet Balances > 10,000 Ether
We can see from the Wallet Balances > 10,000 Ether that the number of addresses in this cohort has remained relatively higher. However, the price has continued to fall. This may be due to other wallet cohorts not adding Ether exposure (wallet balances > 100 & 1,000 Ether).
Ether – Wallet Balances > 10,000 Ether
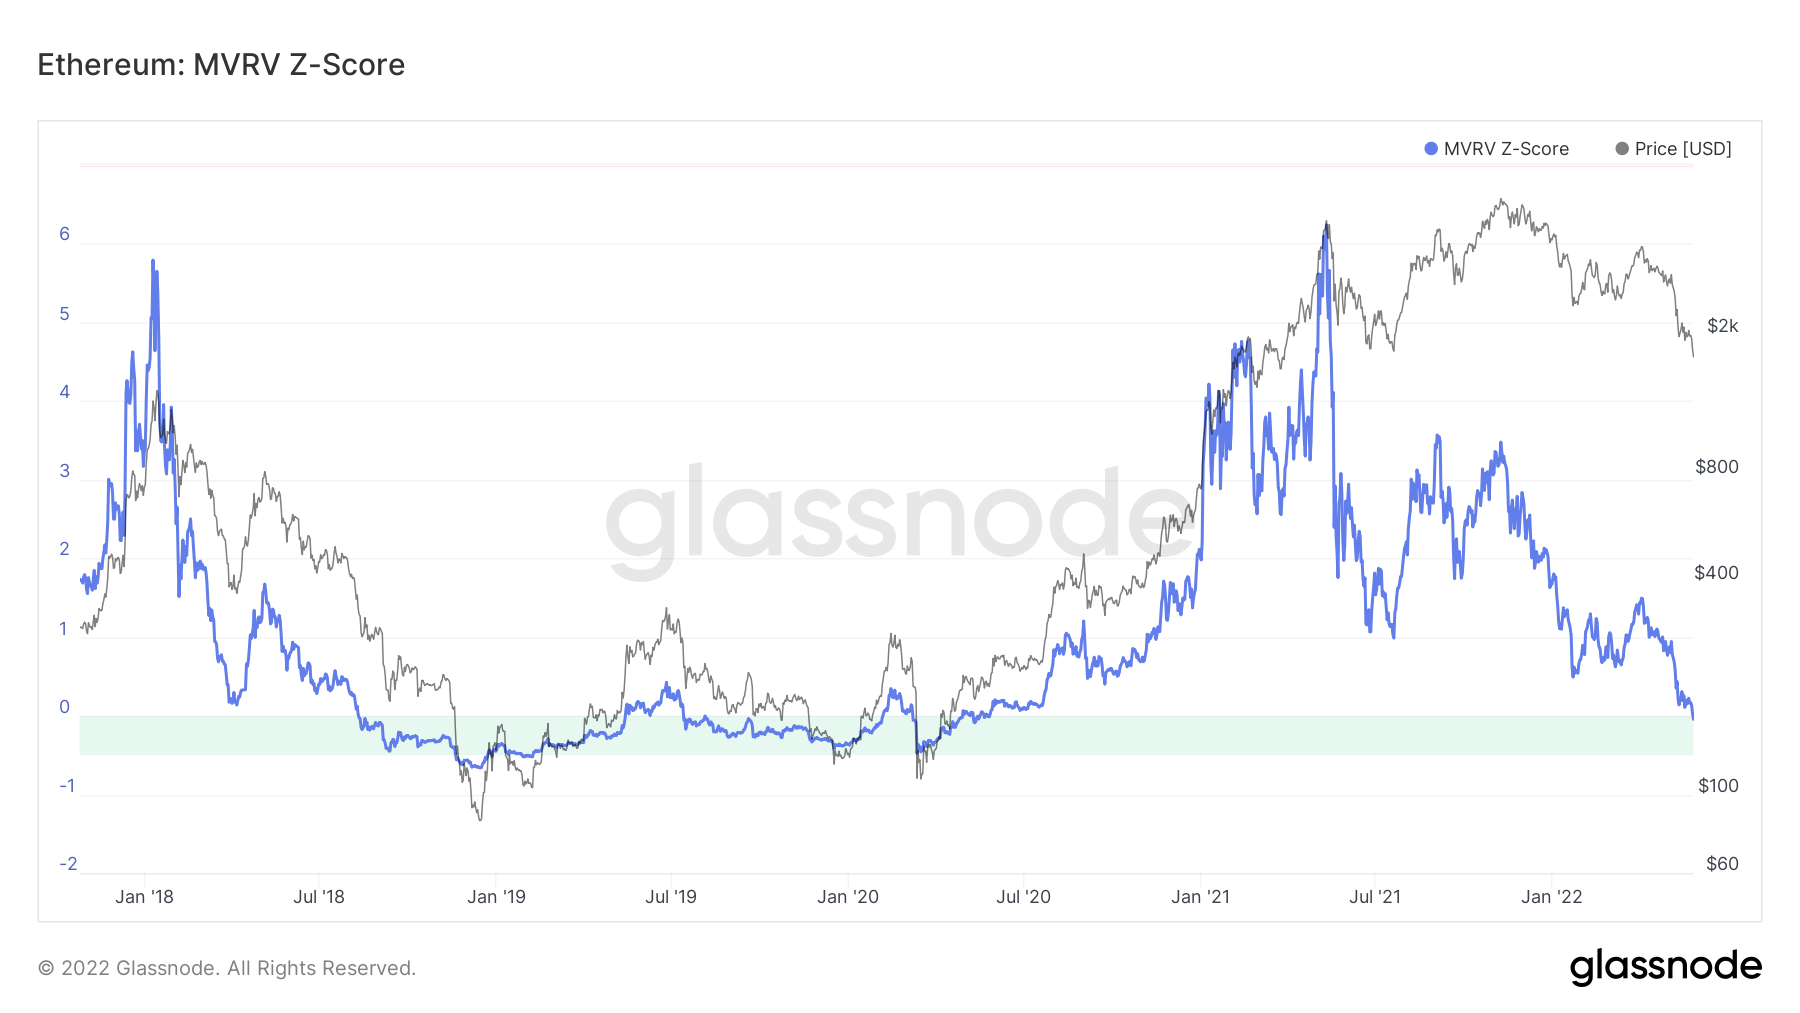
Metric 3 – MVRV Z-Score
The MVRV Z-Score suggests that Ether is approaching its green 'buy zone' which has historically been a great time to buy Ether. However, in prior bear markets, Ether has reached the bottom of this green 'buy zone' and even dipped below it. It may therefore be the case that we wait for a test of the bottom of the zone before we consider buying Ether.
Ether – MVRV Z-Score
DOT
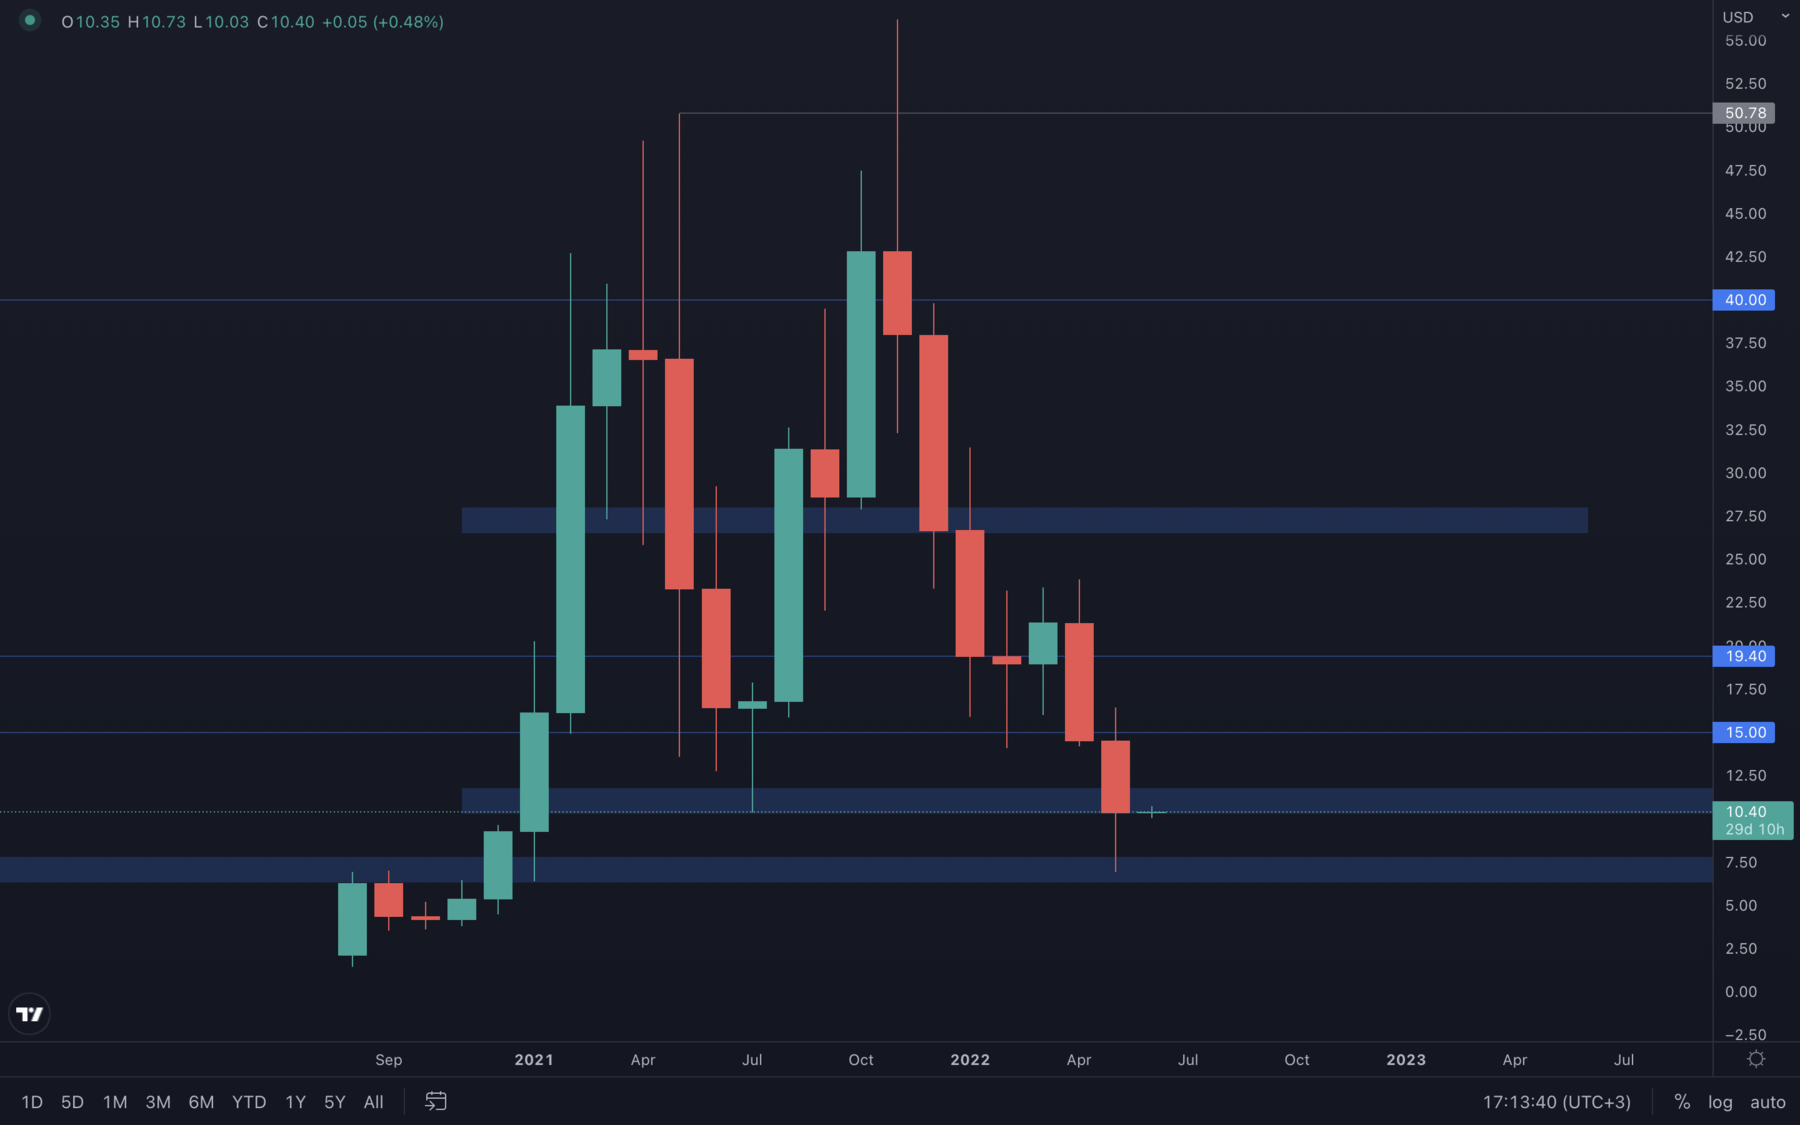 DOT also formed a higher timeframe lower low, by dropping to its $7.5 support level. Due to BTC rising just days before its monthly closure, DOT managed to close above $10, which suggests that, same as most assets, DOT will experience an early June rise. A weekly closure under $10 would put DOT on a path to the $7.5 - $6 support area.
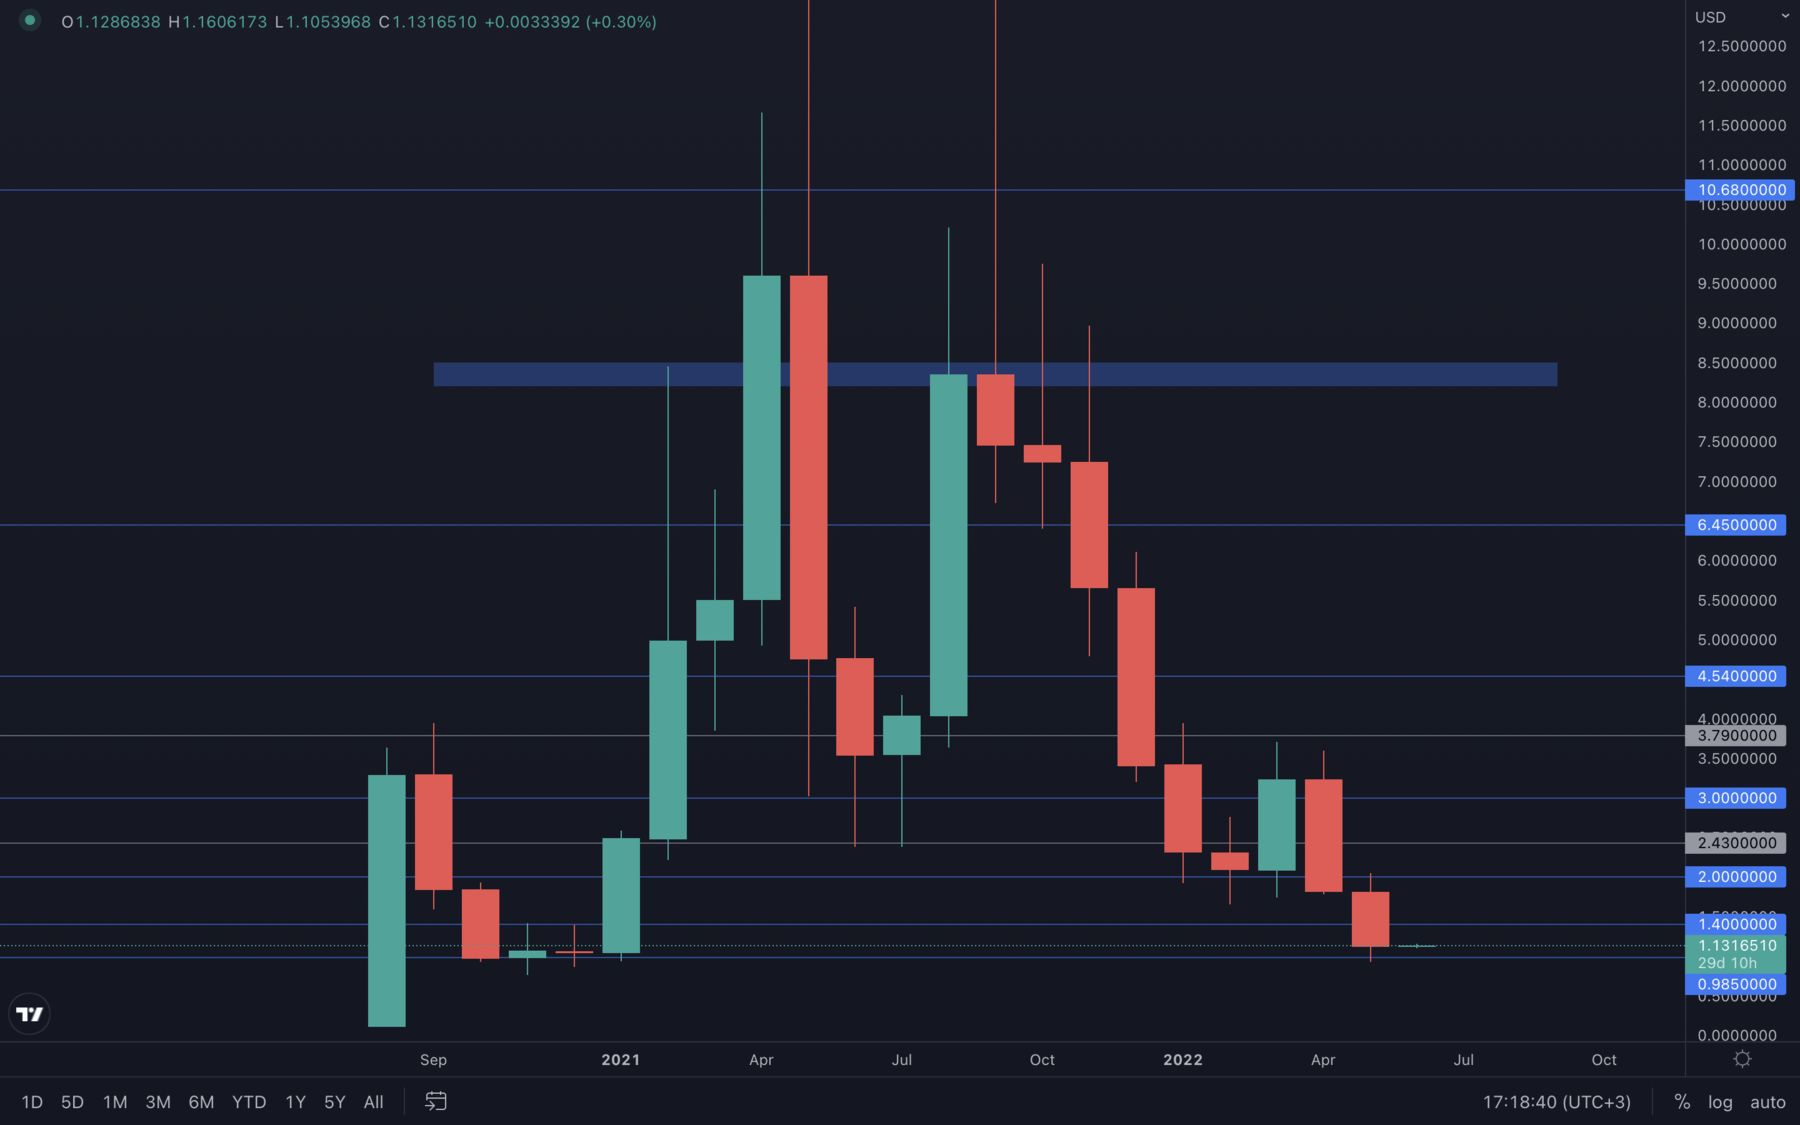
SNX
 SNX tested $2.5 and managed to close above it, but also under its $3.6 resistance level. A weekly closure under $2.5 or above $3.6 will indicate where SNX is going next - until then, further ranging can be expected.
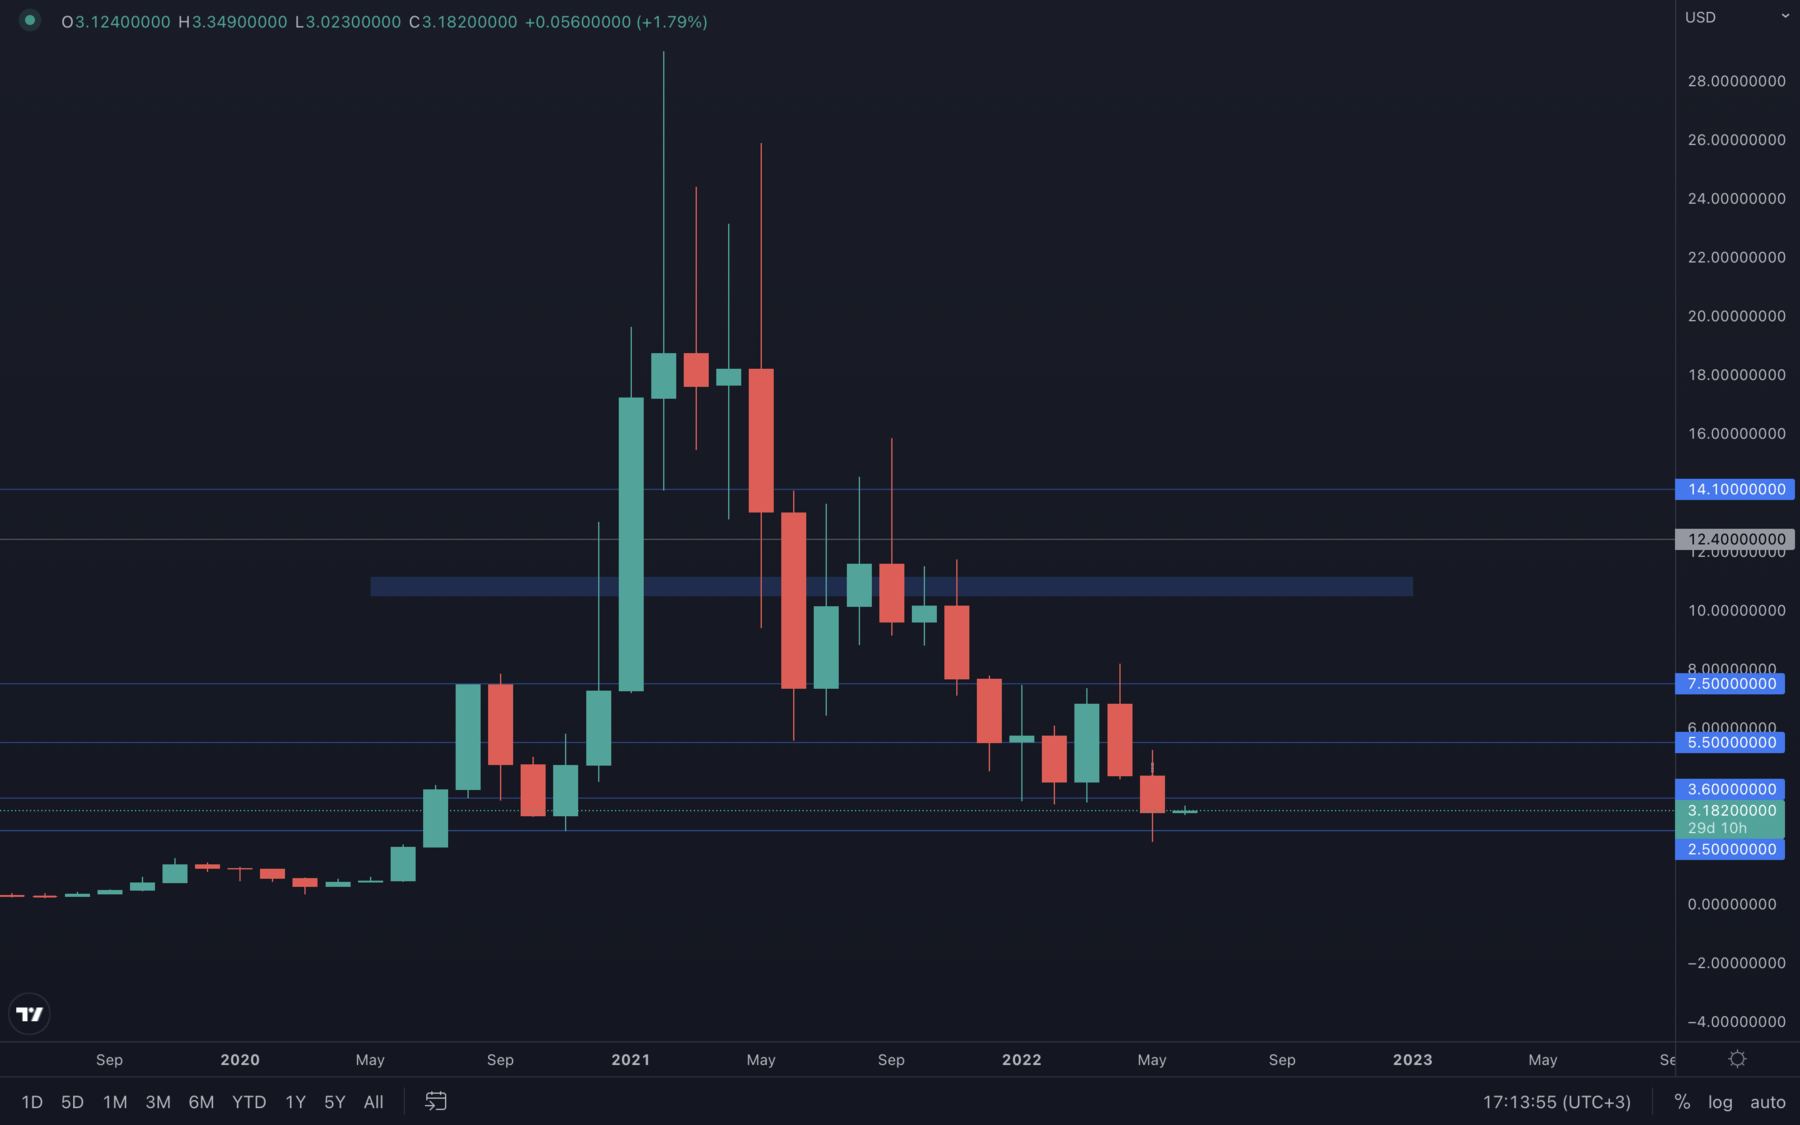
RUNE
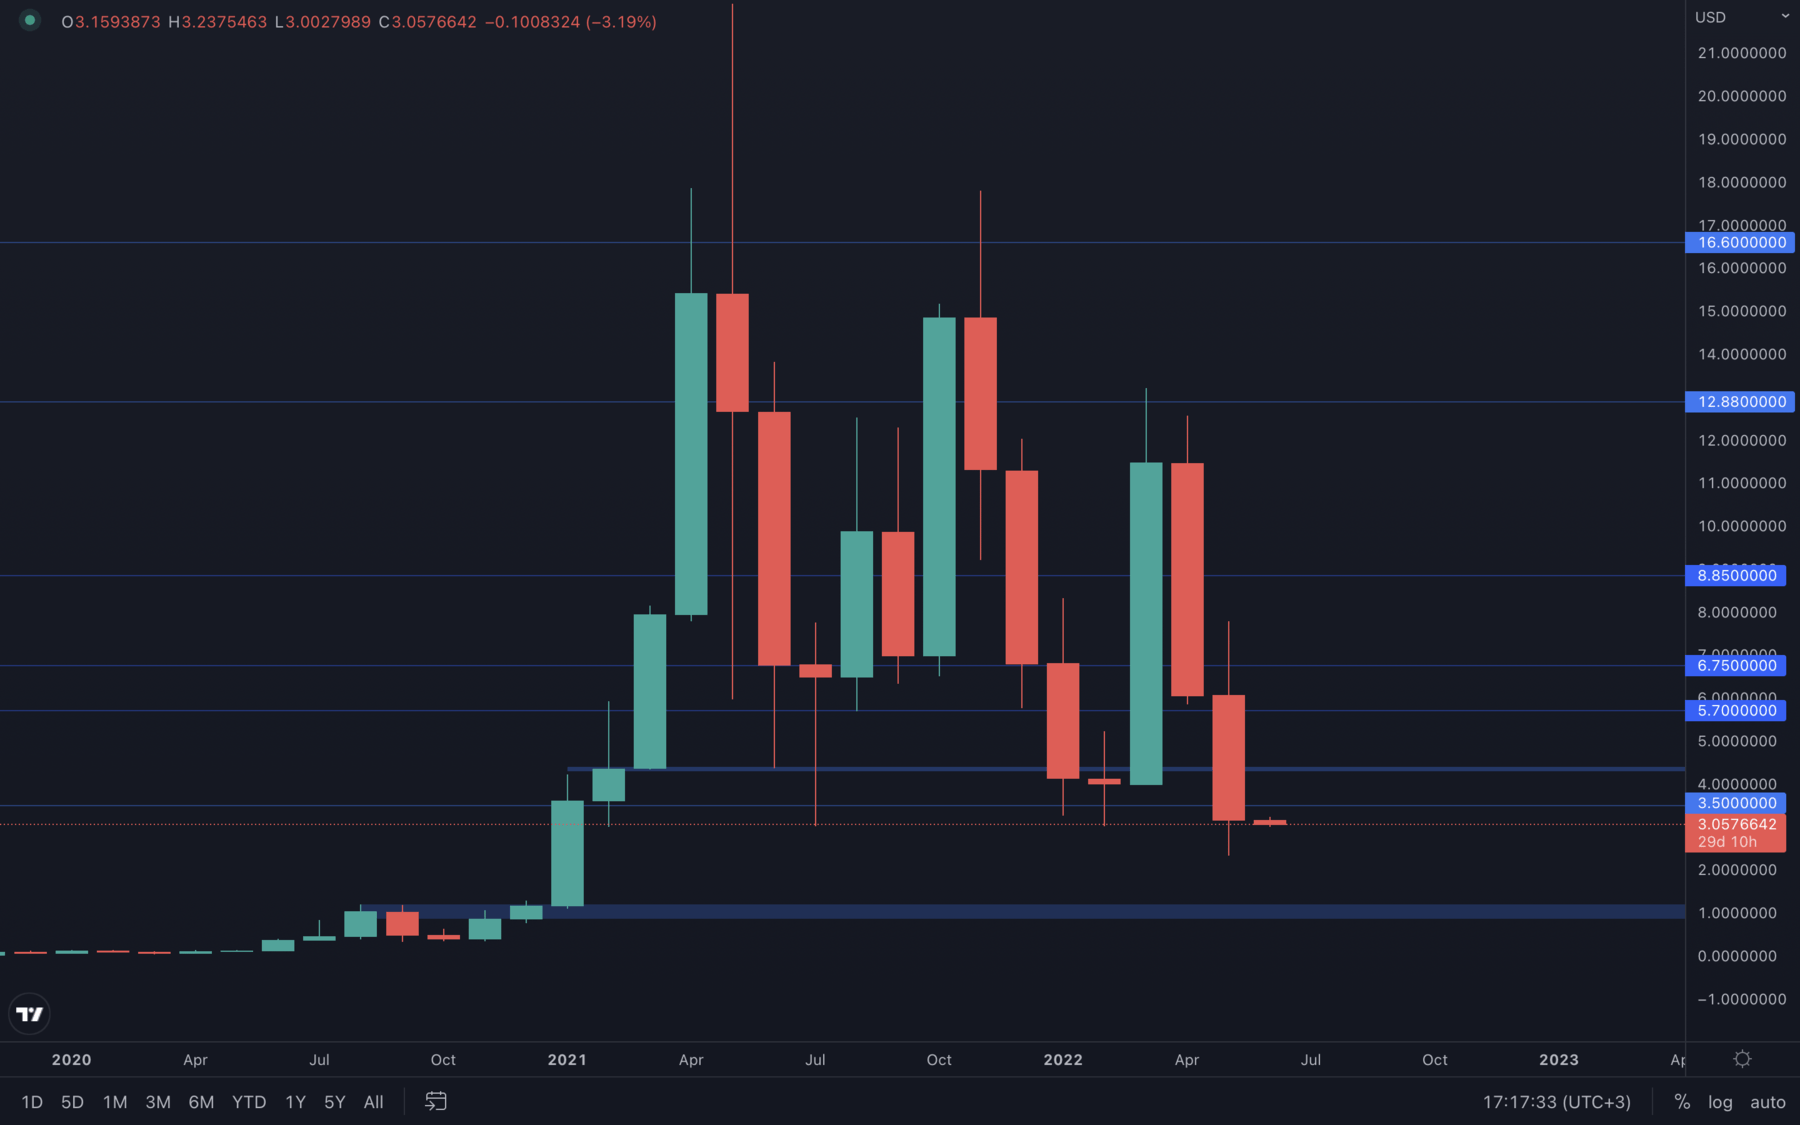 RUNE looks pretty beaten up - the price dropped to January 2021 lows last month and is now under its $3.5 support level. Where RUNE is headed next is uncertain, but a weekly closure above $3.5 will suggest the possibility of a $4.5 resistance test. However, the odds of RUNE testing $1 grow after each drop, as we've seen that RUNE has an even higher volatility level than most assets we usually cover - caution is advised.
SOL
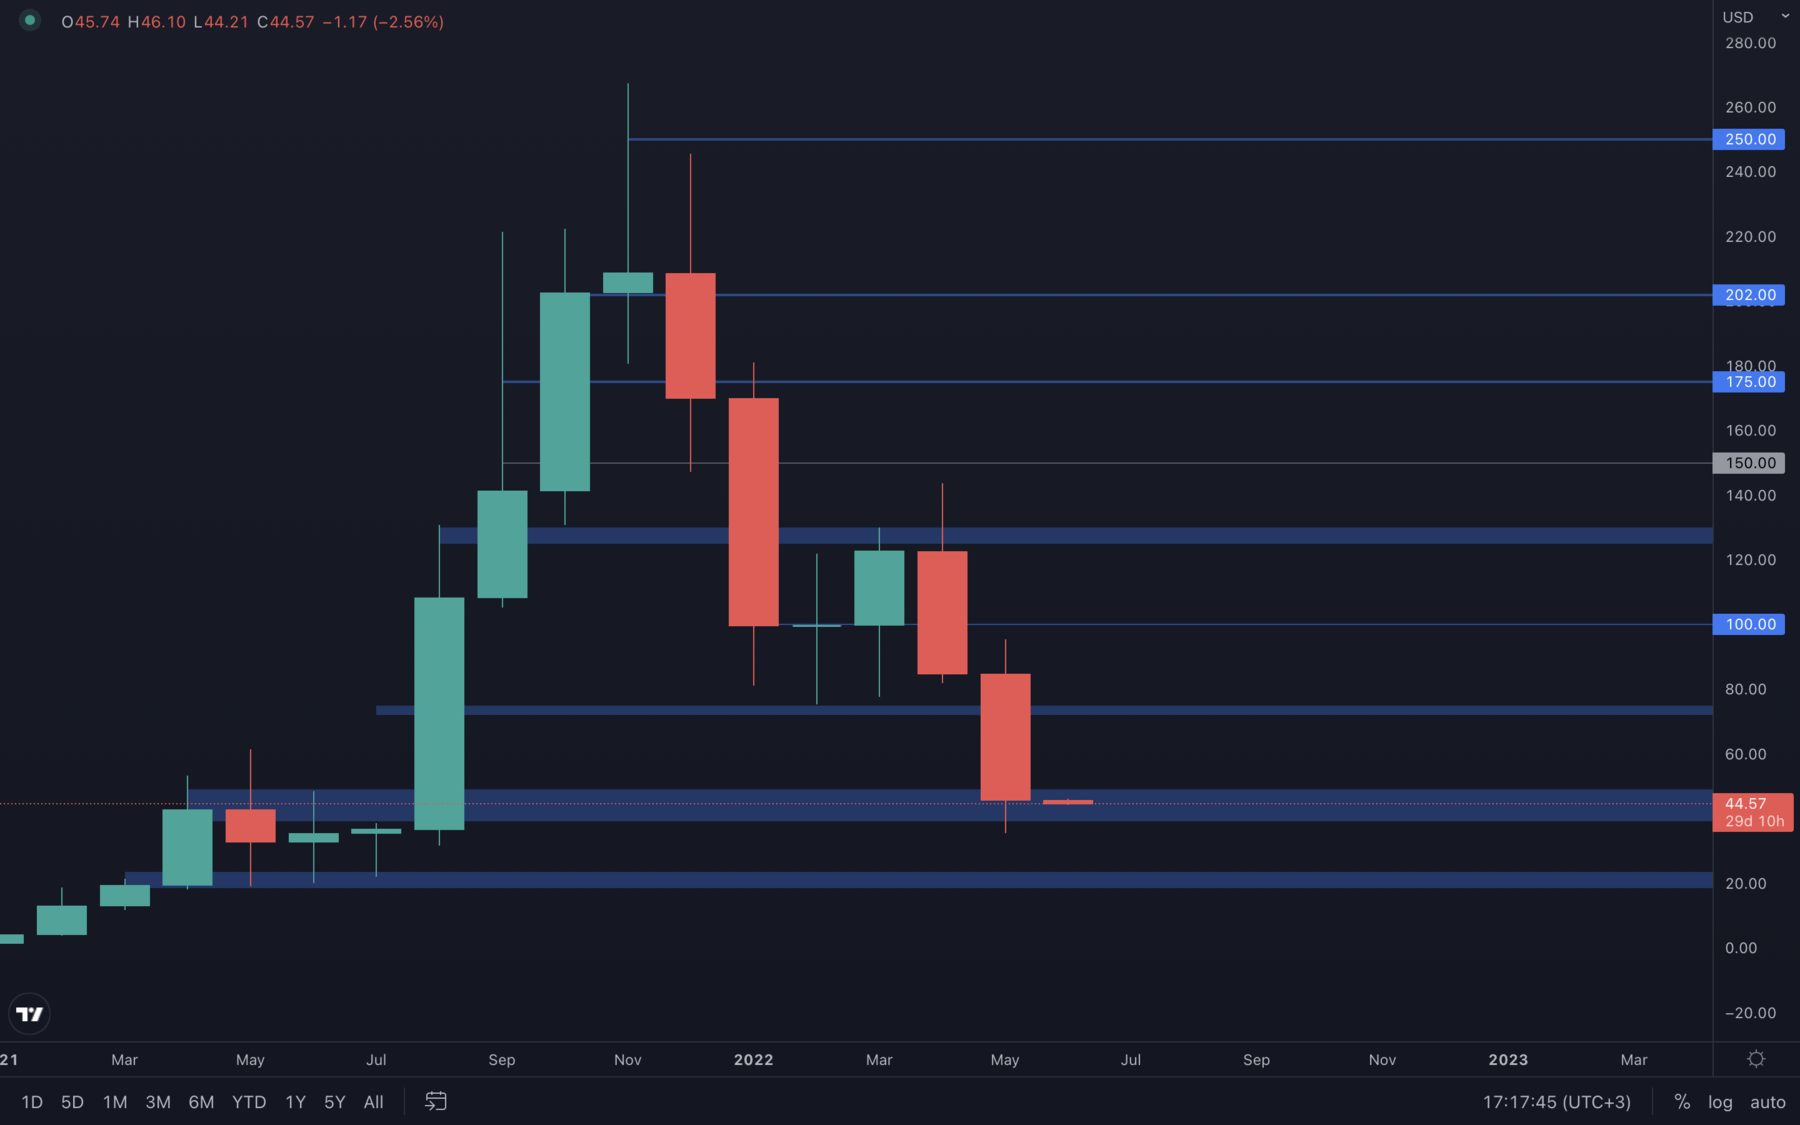 SOL closed May just above the $50 - $40 support area, which means the odds for further upside from here are significantly higher than for further downside. Of course, these odds can be crushed by BTC's price action, so it's best to take all bullish scenarios with a grain of salt, we're still vulnerable to increased selling pressure. A weekly closure under $40 will put SOL on a path to $20 - until then, further upside is expected.
SRM
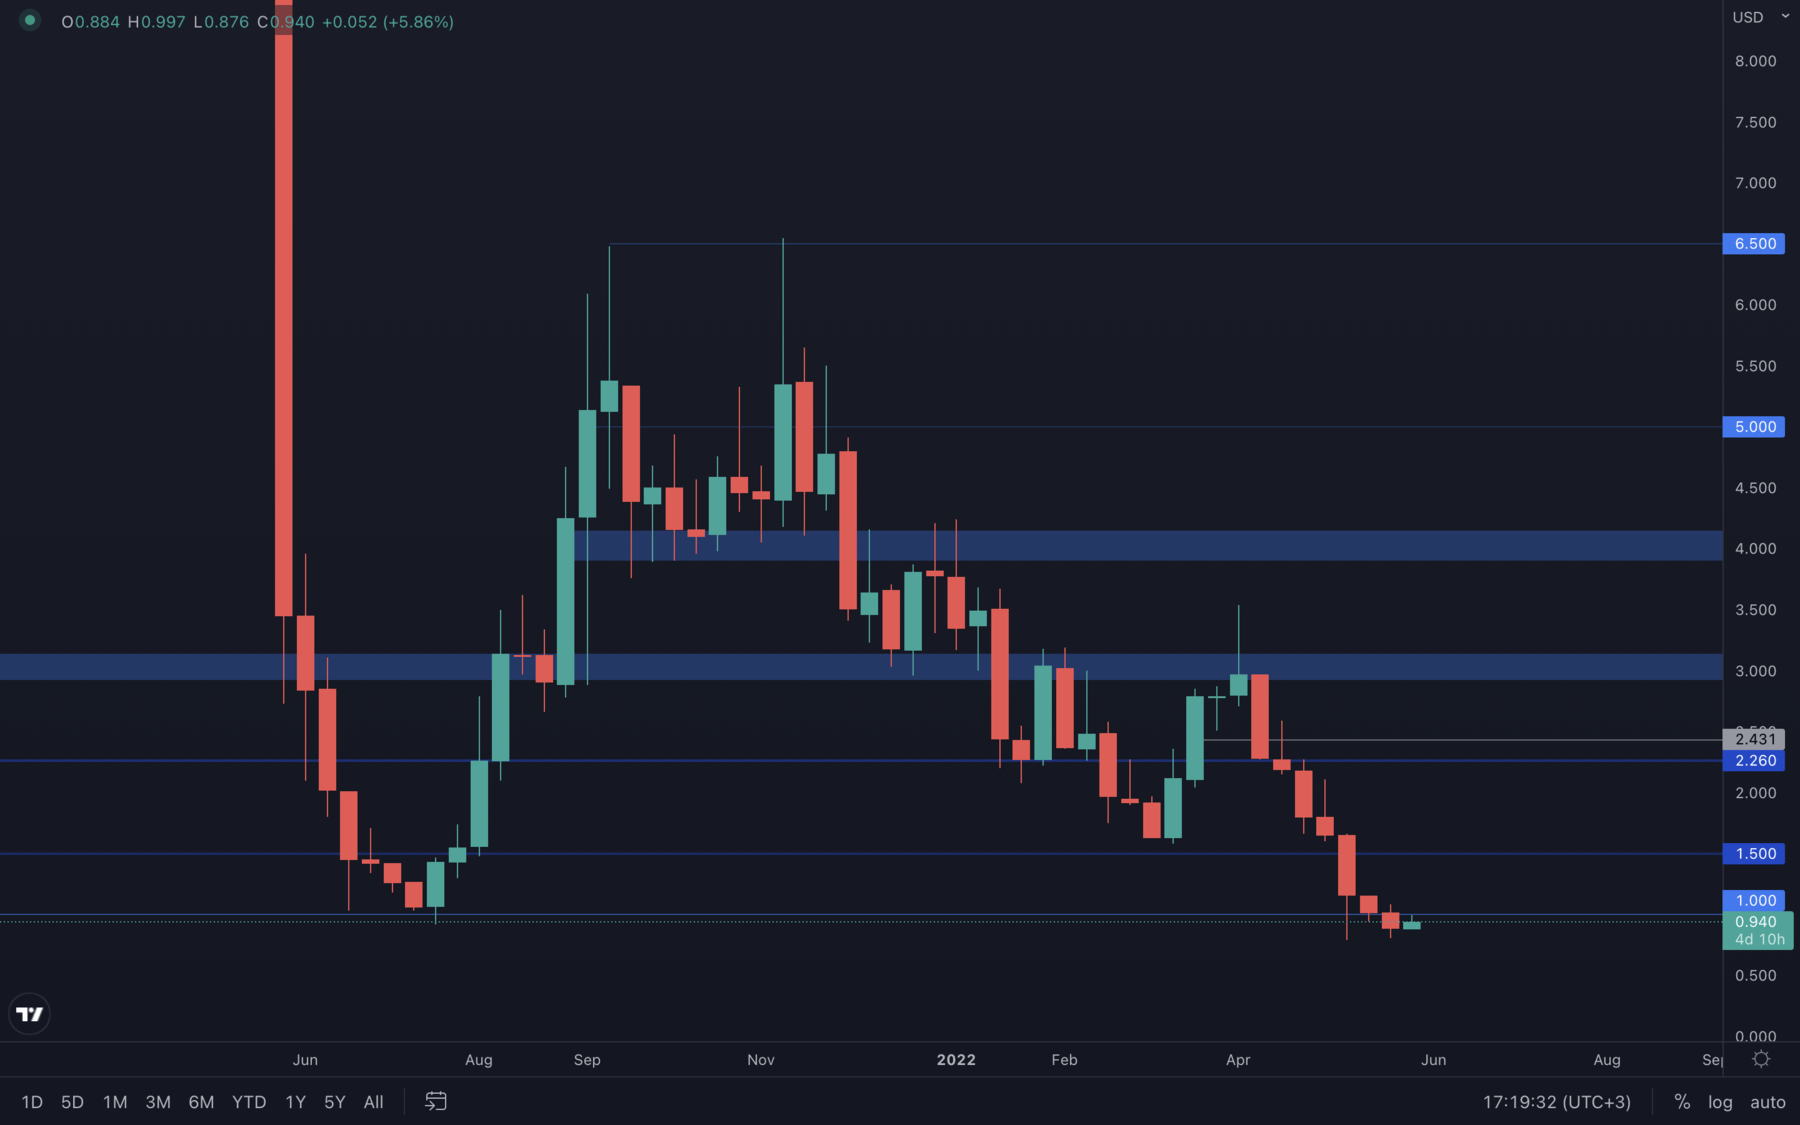
 SRM tested the golden $1 support level, a psychological and technical threshold between all-time lows and further ranging. A weekly loss of $1 would put SRM on a path to lower key psychological levels, such as $0.75, $0.5, $0.4, $0.3, and so on - until then, ranging between $1 and $2 should be expected for June.
FTT
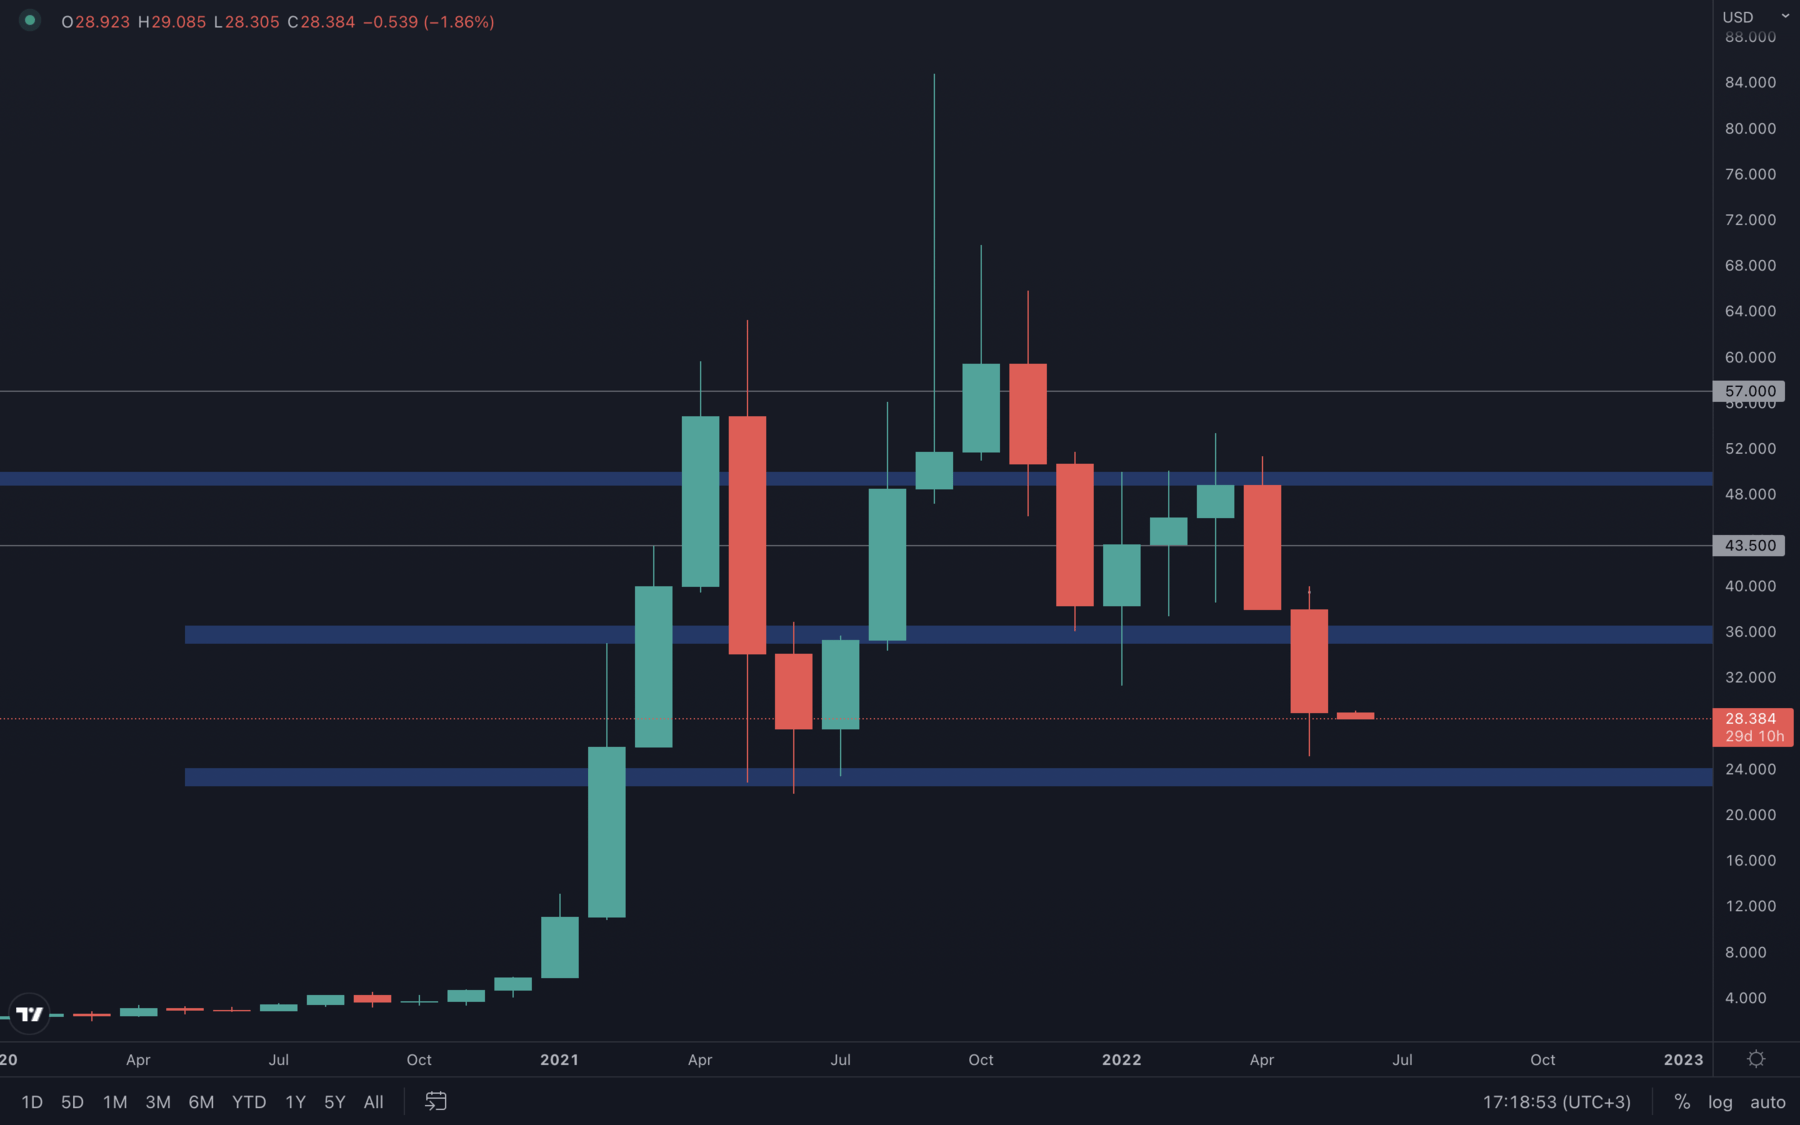 With no significant areas of interest between $36 and $24, FTT finds itself in a "waiting zone". Ranging between $36 and $24 is certain and only a break of either of these levels will indicate where FTT is headed next. Based on the current market conditions, it's likely FTT will test $24 this month.
MINA
 (Weekly chart was used)
MINA recently formed the lowest weekly closure to date, which suggests selling pressure is still at an apex point. Price is just under its $1 psychological and technical level, which is crucial and needs to be reclaimed in order to prevent further downside. We will continue to monitor changes on a daily basis, as usual.
(Weekly chart was used)
MINA recently formed the lowest weekly closure to date, which suggests selling pressure is still at an apex point. Price is just under its $1 psychological and technical level, which is crucial and needs to be reclaimed in order to prevent further downside. We will continue to monitor changes on a daily basis, as usual.
DYDX
(Weekly chart was used)
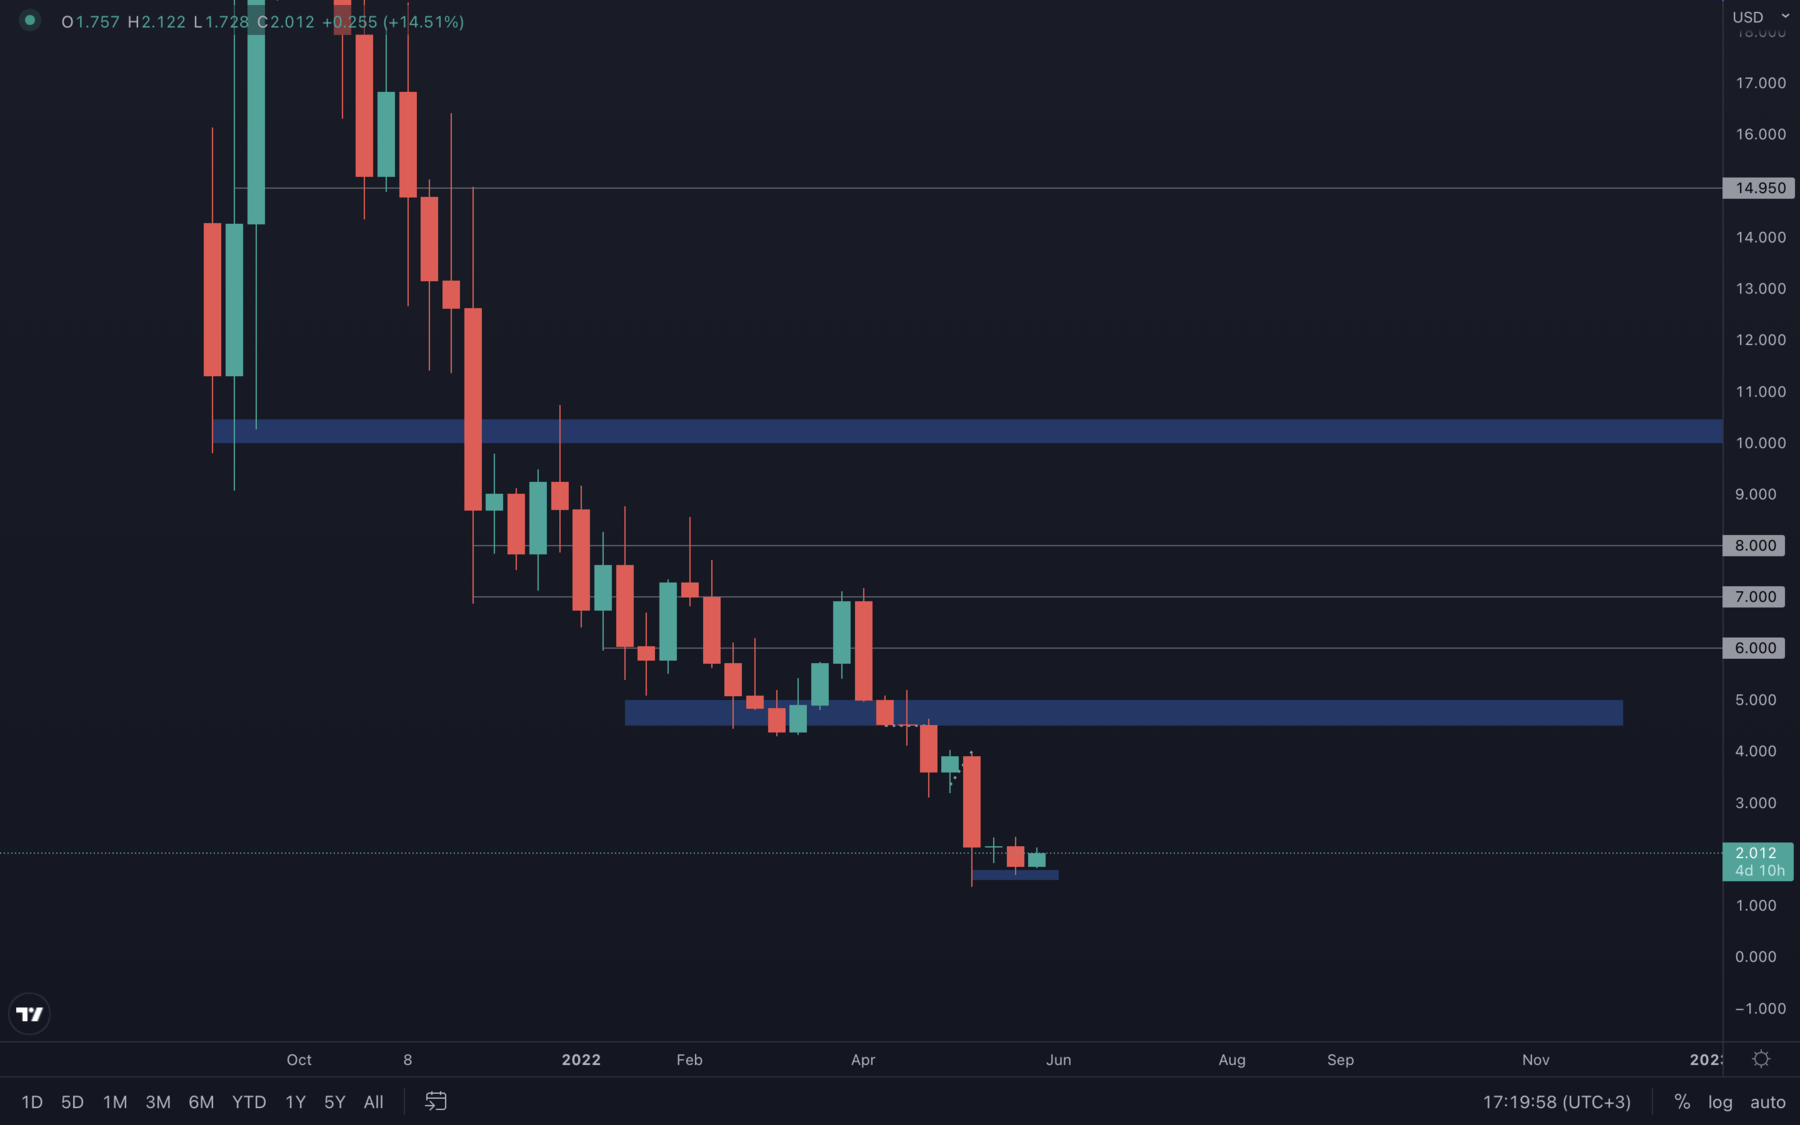
dYdX has been ranging above $1.5 for four weeks now, which suggests that a local bottom is set. A weekly closure under $1.5 will most likely drive dYdX to make another all-time low - until then, we should expect ranging between $1.5 and $3, as it's unlikely the price will rise higher than $3 due to the extremely low volume and uncertain market conditions
Summary
We now have two bearish months in Q2 and no signs of that changing anytime soon. With the current macro conditions, we can treat 2022 as a perfect time to accumulate, gather knowledge, master skills and study the psychological aspects of investing. Selling pressure continues to rule the market, as market participants are exiting the markets fearfully, in order to cut even more losses or to just wait for better opportunities. A bear market can either be your friend or your worst enemy - it's only a matter of perspective.Recommended from Cryptonary


