Save 23% ($351) & Get a Free 1-1 Call with our Team ⏰ : 0d 2h 59m 43s

Disclaimer: Not financial nor investment advice. You are responsible for any capital-related decisions you make, and only you are accountable for the results.
Summary for September ’22
- Total Market Cap – +7.33%
- Altcoins Market Cap – +8.63%
TLDR
- The markets will be driven this week by FED Chair Powell’s Press Conference on 02/11.
- The largest Bitcoin wallets have begun adding more coins to their balances, but still in a hesitant way.
- Some market indicator metrics are showing that a bottom formation is being formulated, although a flush much lower can’t be ruled out, its odds of happening are decreasing.
This week’s price action will likely be governed by the key macro events. These events include the FED Interest Rate Decision followed by FED Chair Powell’s Press Conference on 02/11 and then the Jobs data on 04/11.
Markets have priced in for the FED to do a 75 basis points increase in the Interest Rate on Wednesday, but the key will be to listen to what Chair Powell forward guides in the Press Conference following the decision. Currently, markets have priced for 75 bps in November, followed by a 50 bps raise in December, and possibly a further 25 bps in February. If Powell forward guides a further 25 bps in March or for the February rate hike to be 50 bps rather than just 25 bps, the markets may fall on the guidance of a higher terminal FED Funds Rate. However, if Powell stays in line with what’s been priced in (75 bps in Nov, 50 bps in Dec, and 25 bps in Feb), then the markets may rally due to the visibility of the Interest Rate hike cycle coming to an end.
On Friday, there is also key jobs data out. If both the Non-Farm Payrolls and the Unemployment Rate come in low (Consensus is suggesting they will) then the markets may sell off due to this signaling to the FED that not enough demand destruction has been felt just yet – demand destruction is needed in order to bring inflation down.
DXY
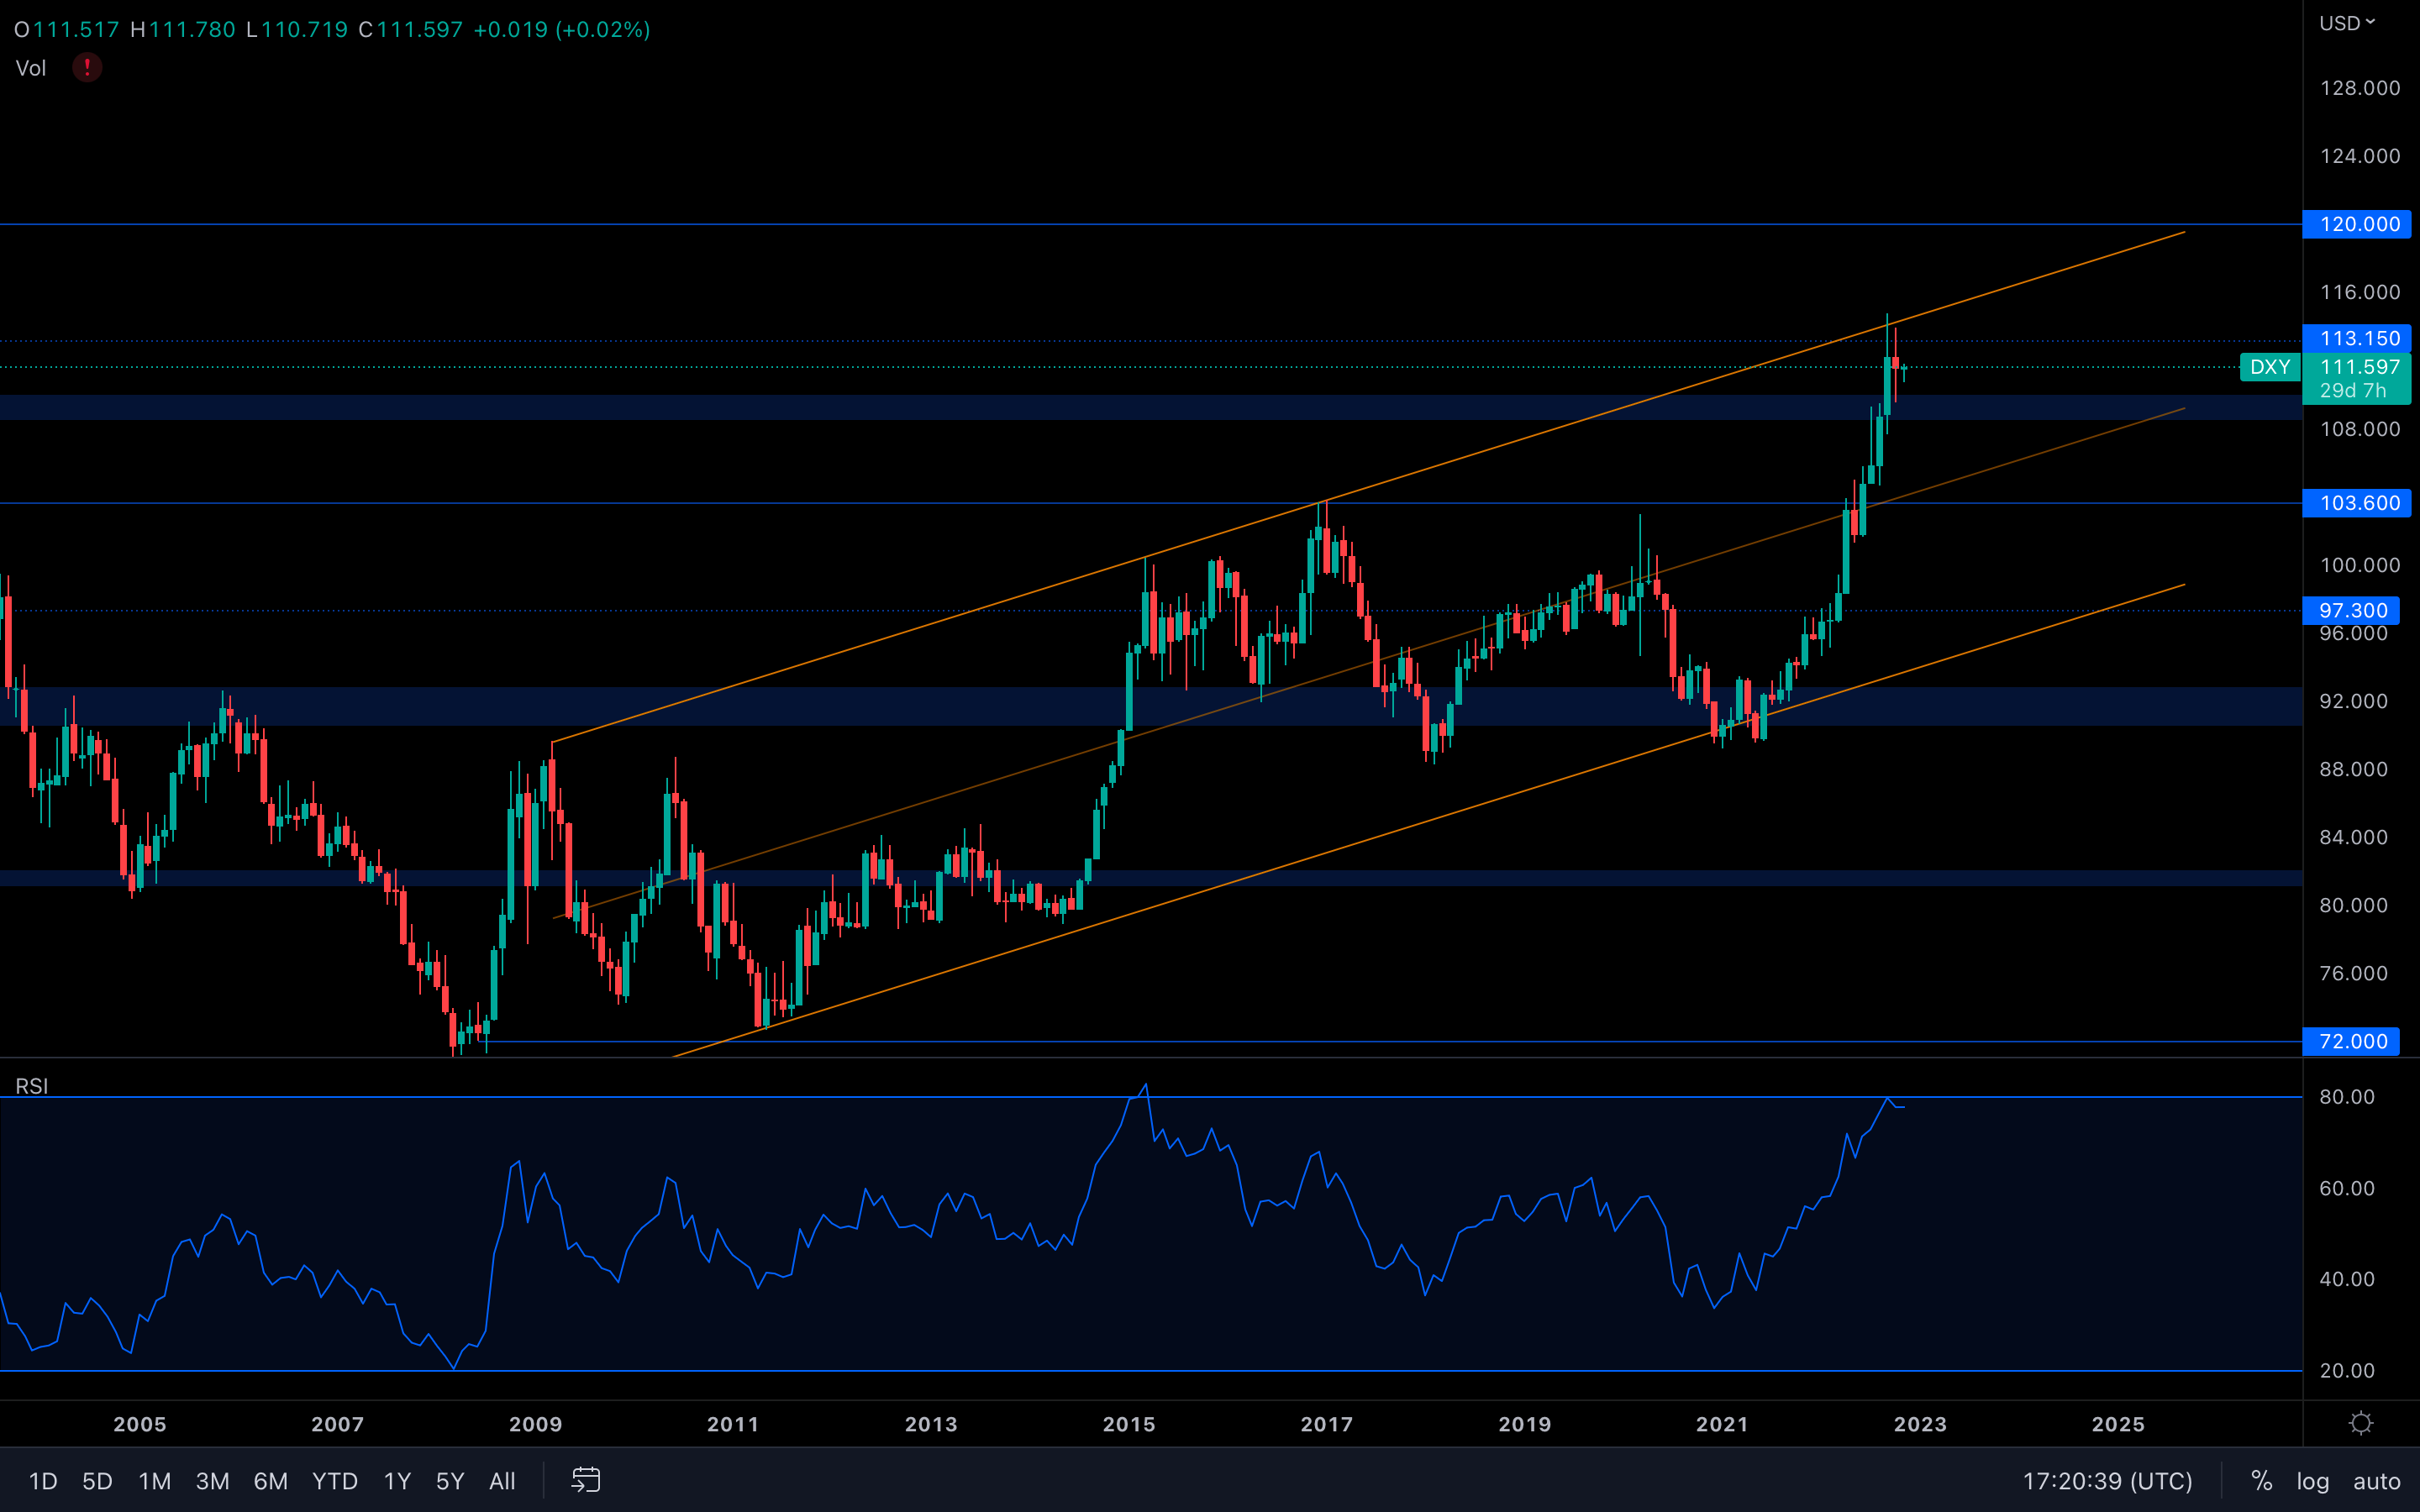 The U.S. Dollar Currency Index is still trading near the top of this ascending channel. In the past, we've seen the index start ranging for multiple months before being rejected and heading lower. If we were to stick with that bias, then the DXY should have difficulty breaking above the channel - this aids the crypto market as a descending/ranging DXY can be beneficial for crypto prices.
The RSI has also reached its 80 oversold area. However, we can see that back in 2015, the indicator surpassed its 80 mark for some time while still trading inside the channel. The same thing can occur once more, so the possibility of another higher move for the DXY isn't ruled out either, but not to the extent that it could cause major damage to crypto prices.
S&P 500 Index
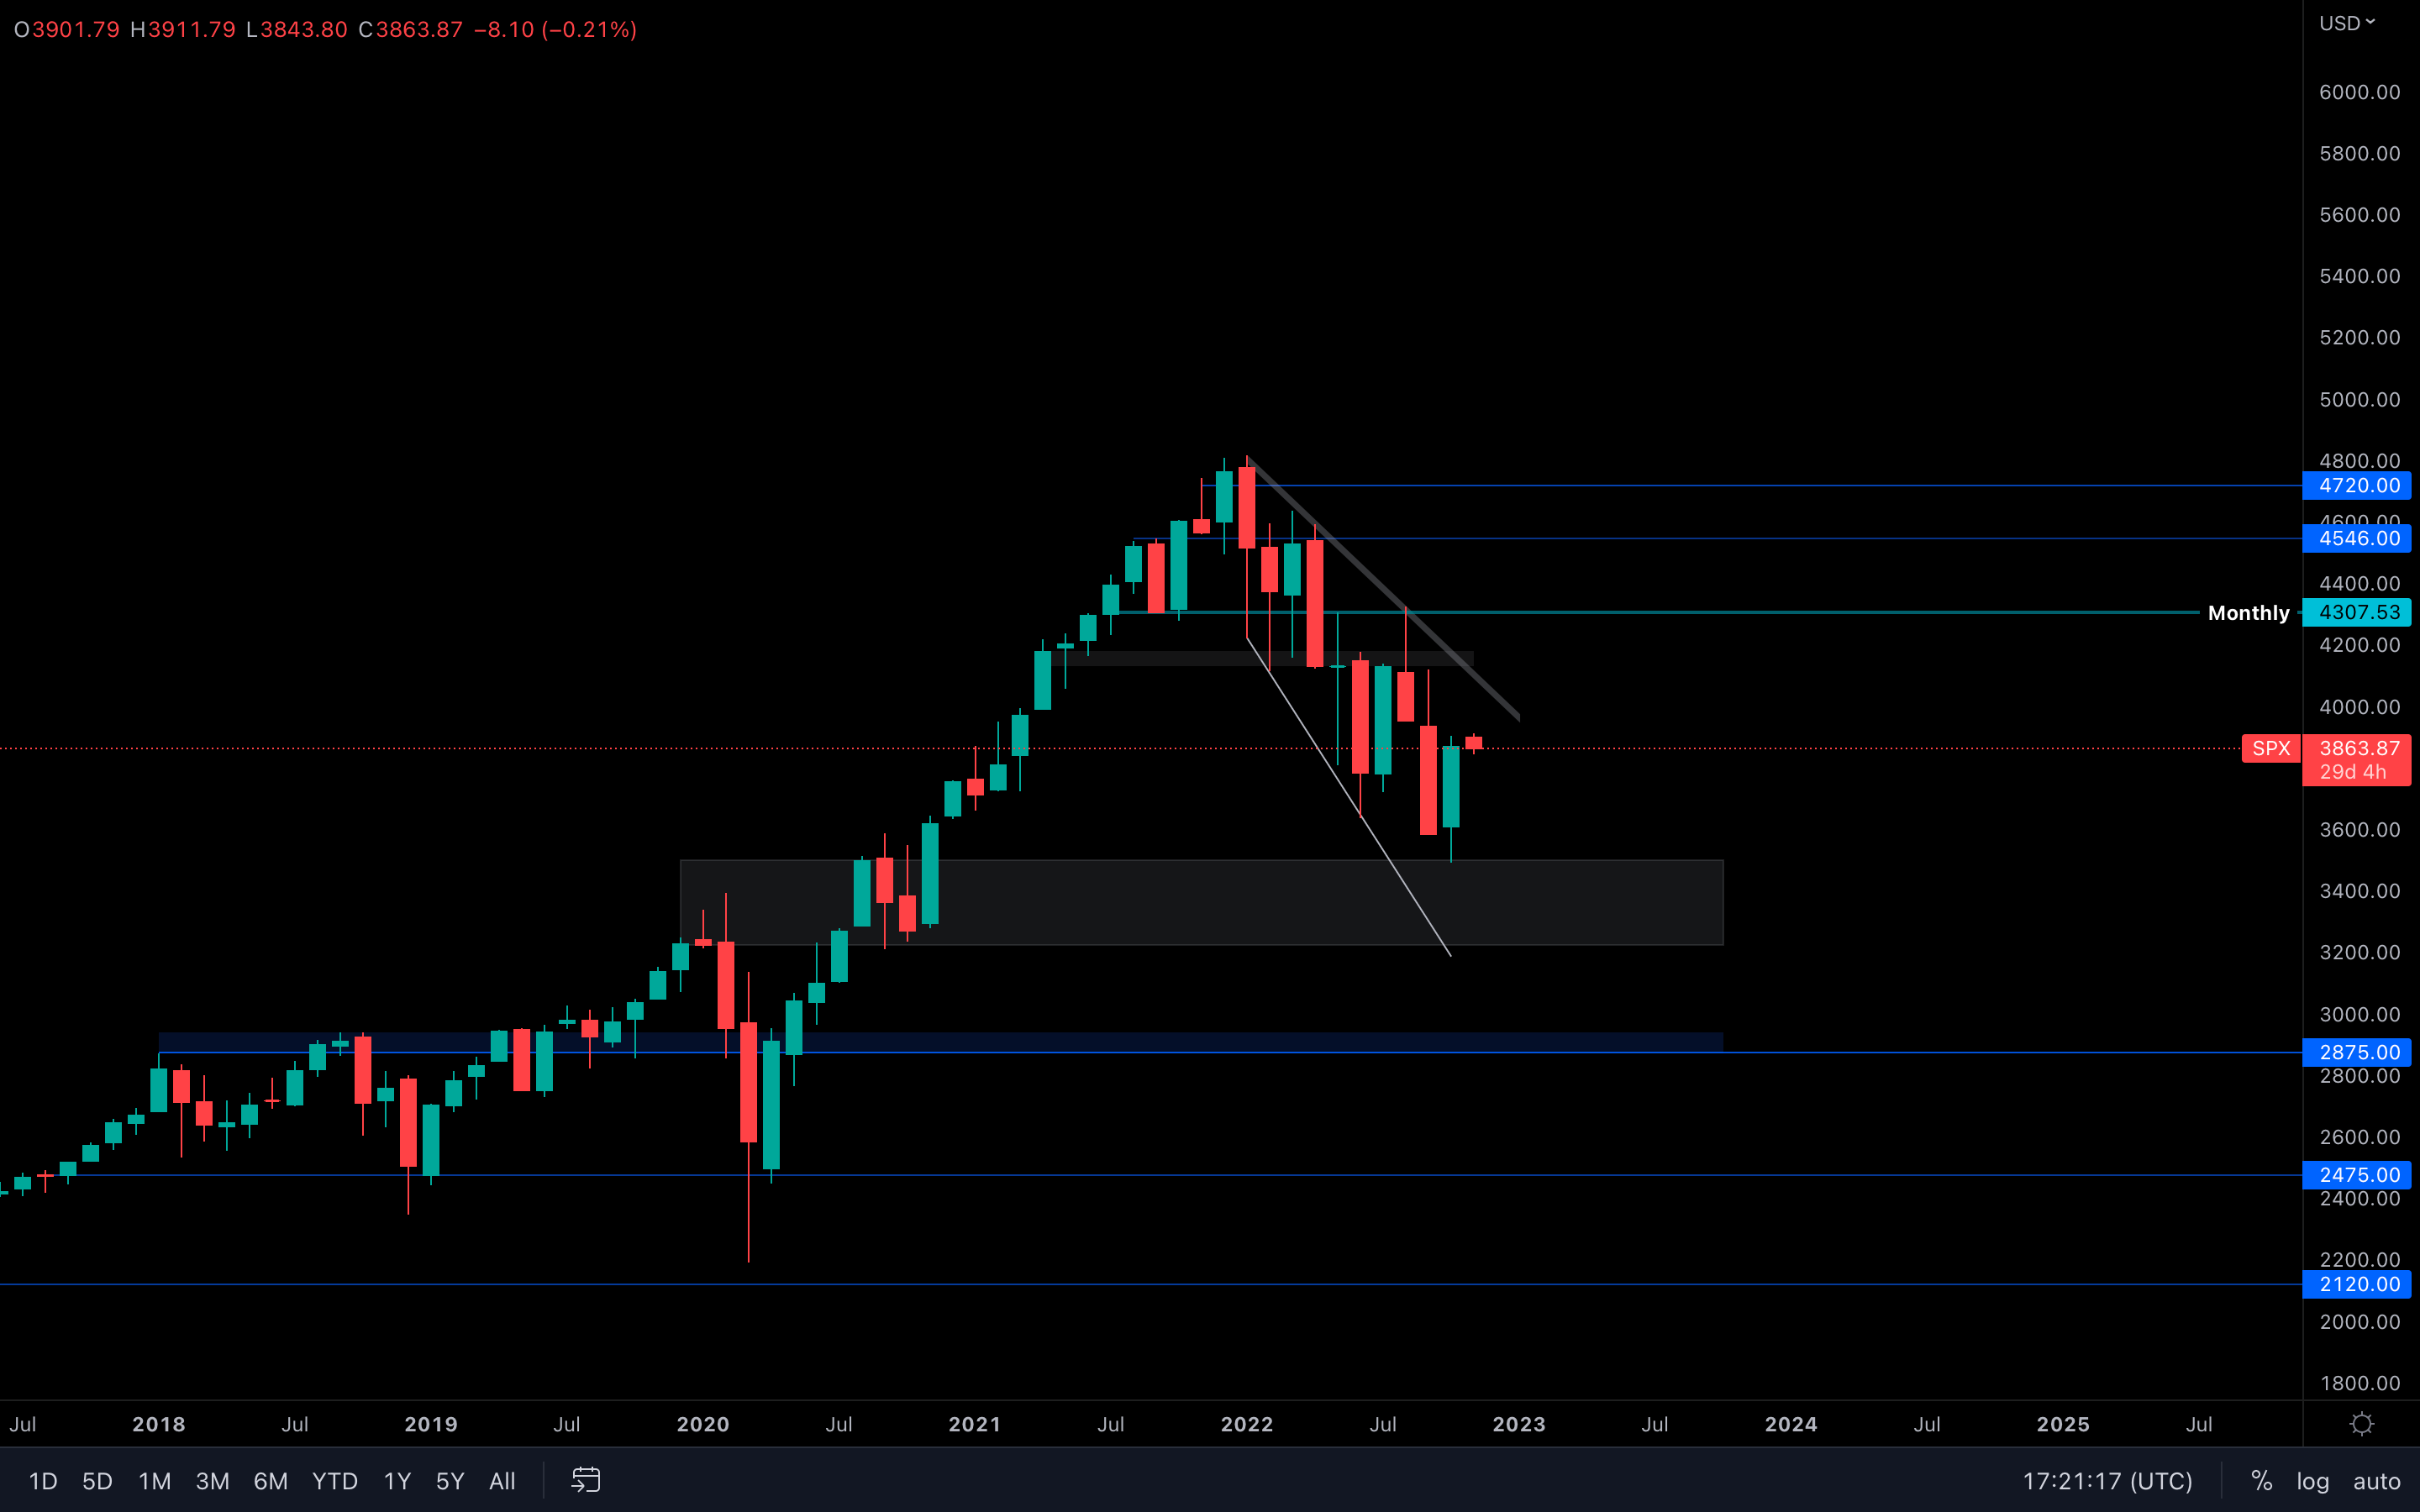 The S&P 500 Index has seen a constant decline over the last few months in what looks to be a descending broadening wedge. This pattern is known to provide a bullish signal, but there's no telling when a breakout can occur - it can take weeks or even months before progress is made.
With that said, we could see the index test the top trend line of this broadening wedge in November - we've seen a strong upward movement after testing the $3500 level last month, and while also taking into consideration external factors such as the macro environment, the index should have no issues in testing $4000 - $4100 this month.
Total Market Cap
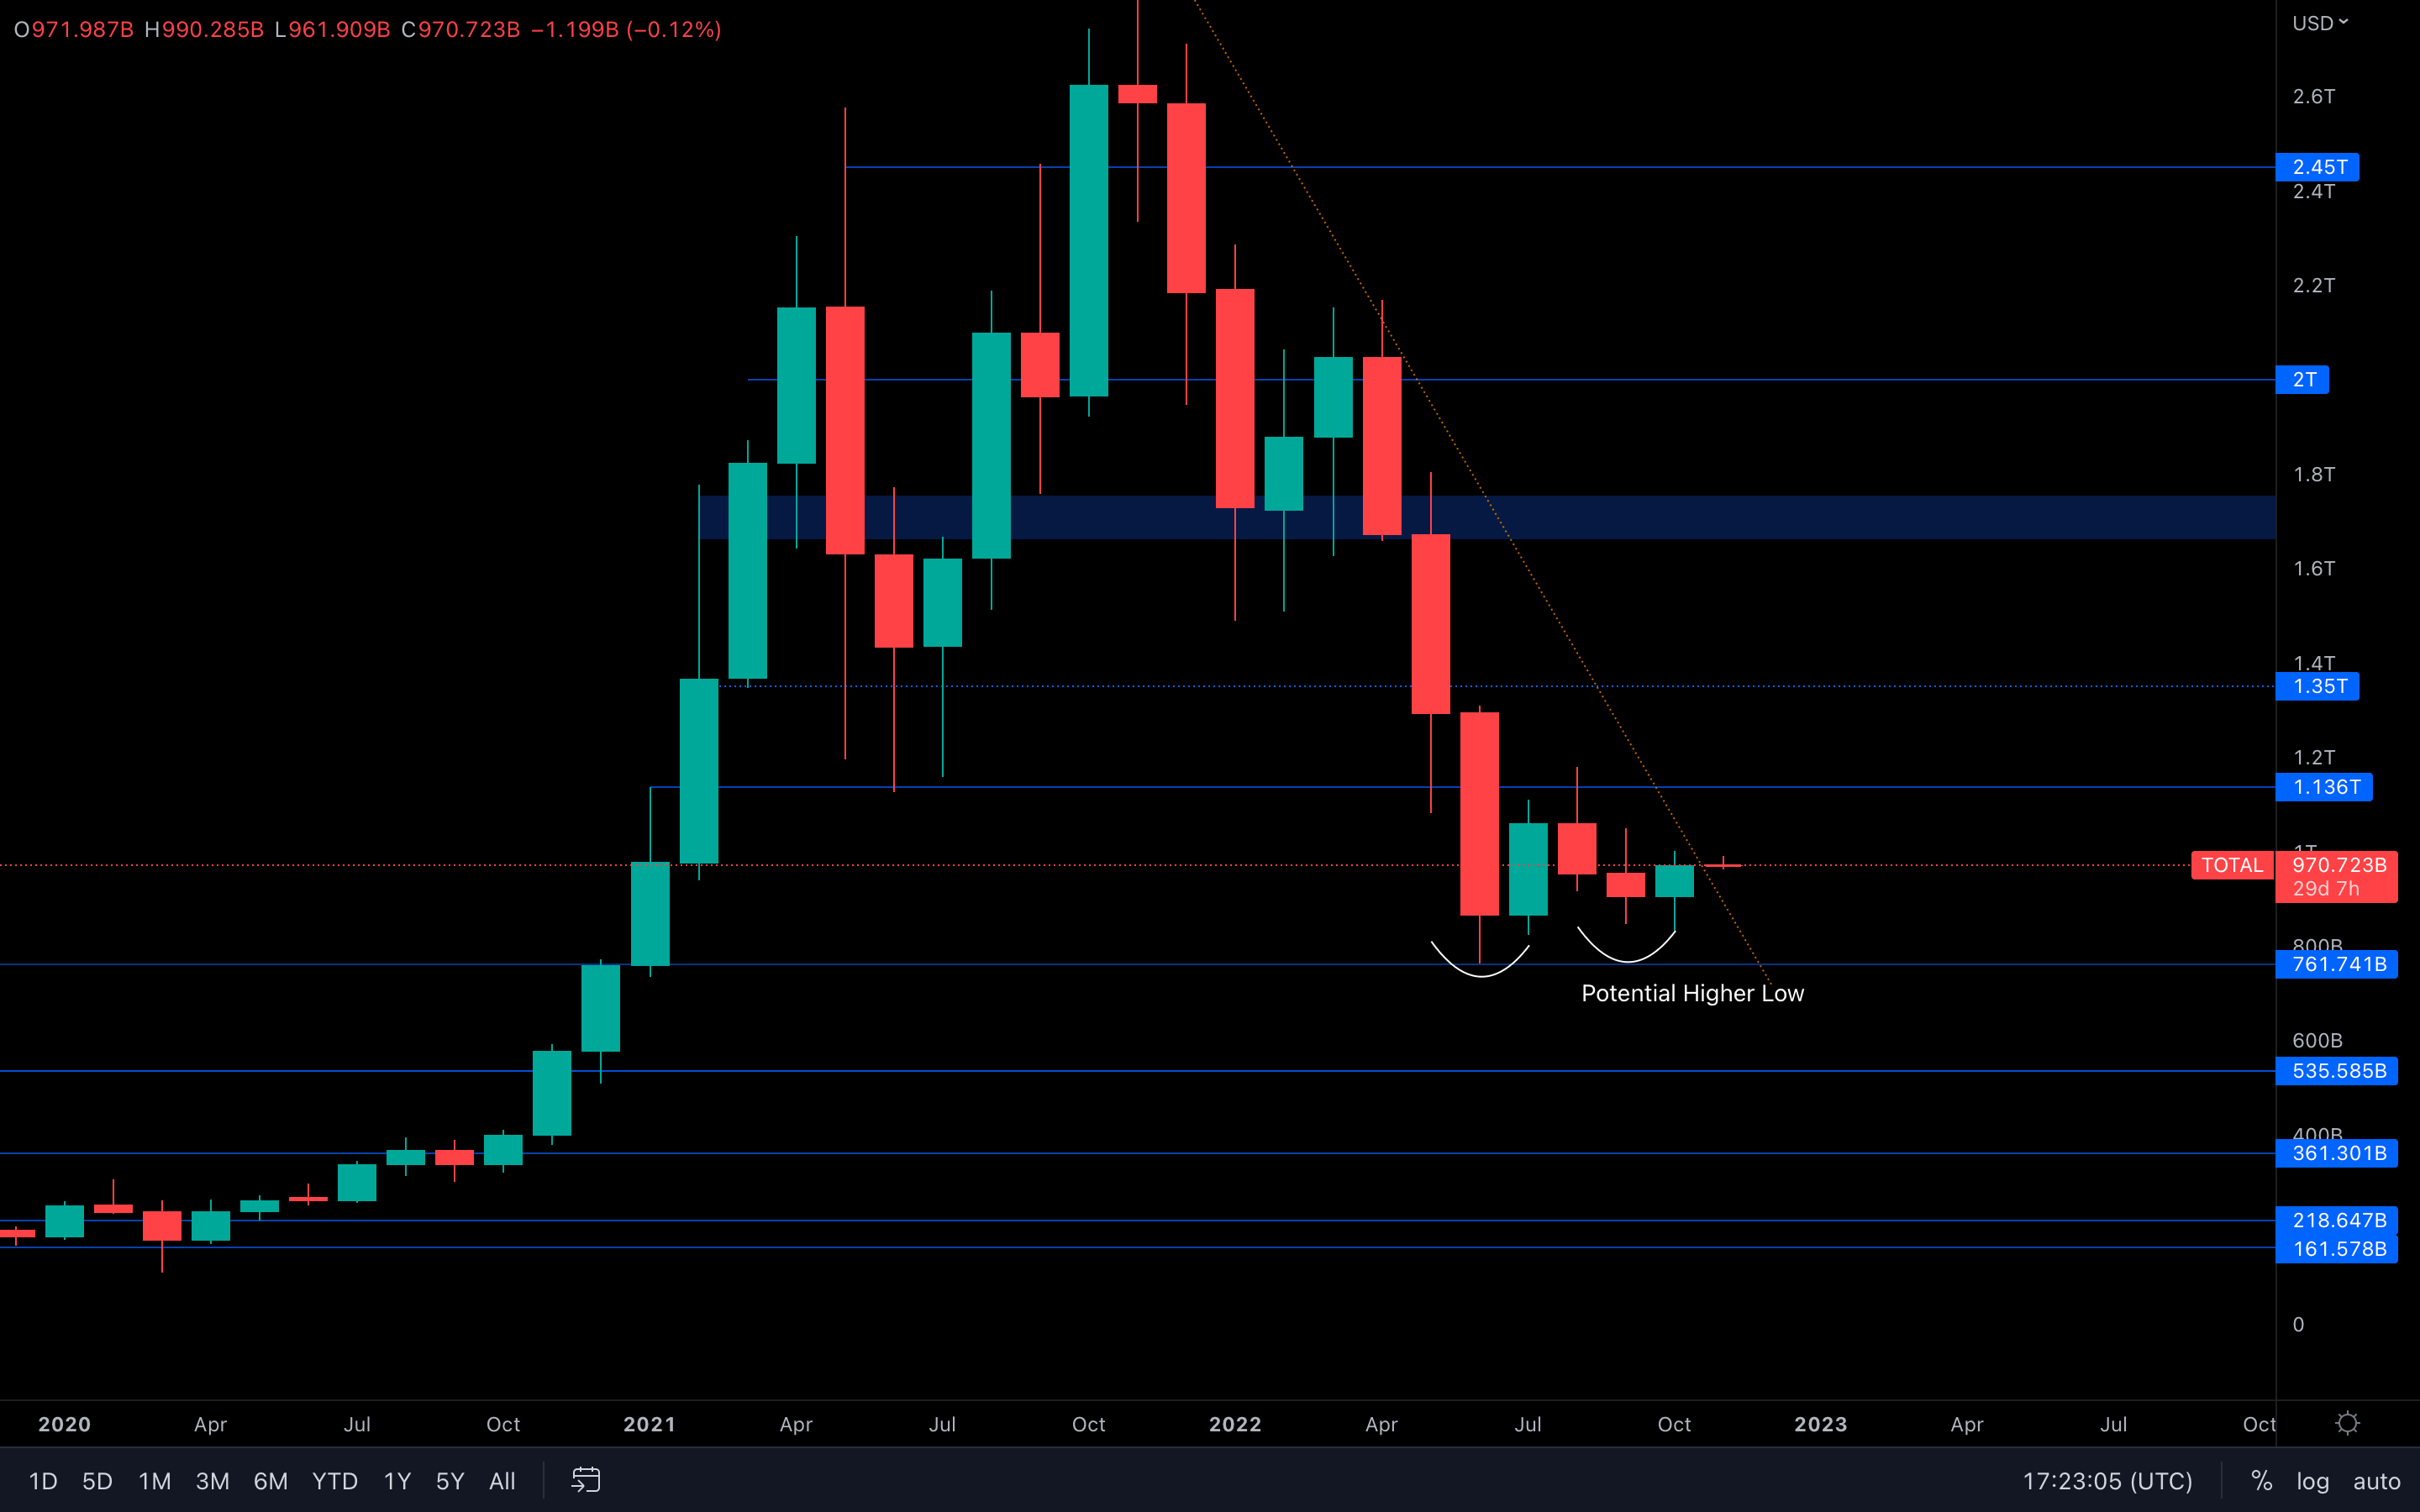 The Total Market Cap index has closed October above September's candlestick open - this means that the entire bearish price action that occurred during September has now been invalidated entirely.
Not only that, but because we are looking at some bullish momentum taking place here, last month's closure can also act as a higher low - that's the first sign we've had in months of a potential shift in market structures.
November is likely going to be bullish for the crypto market, of course, if no crazy or unexpected events occur.
Altcoins Market Cap
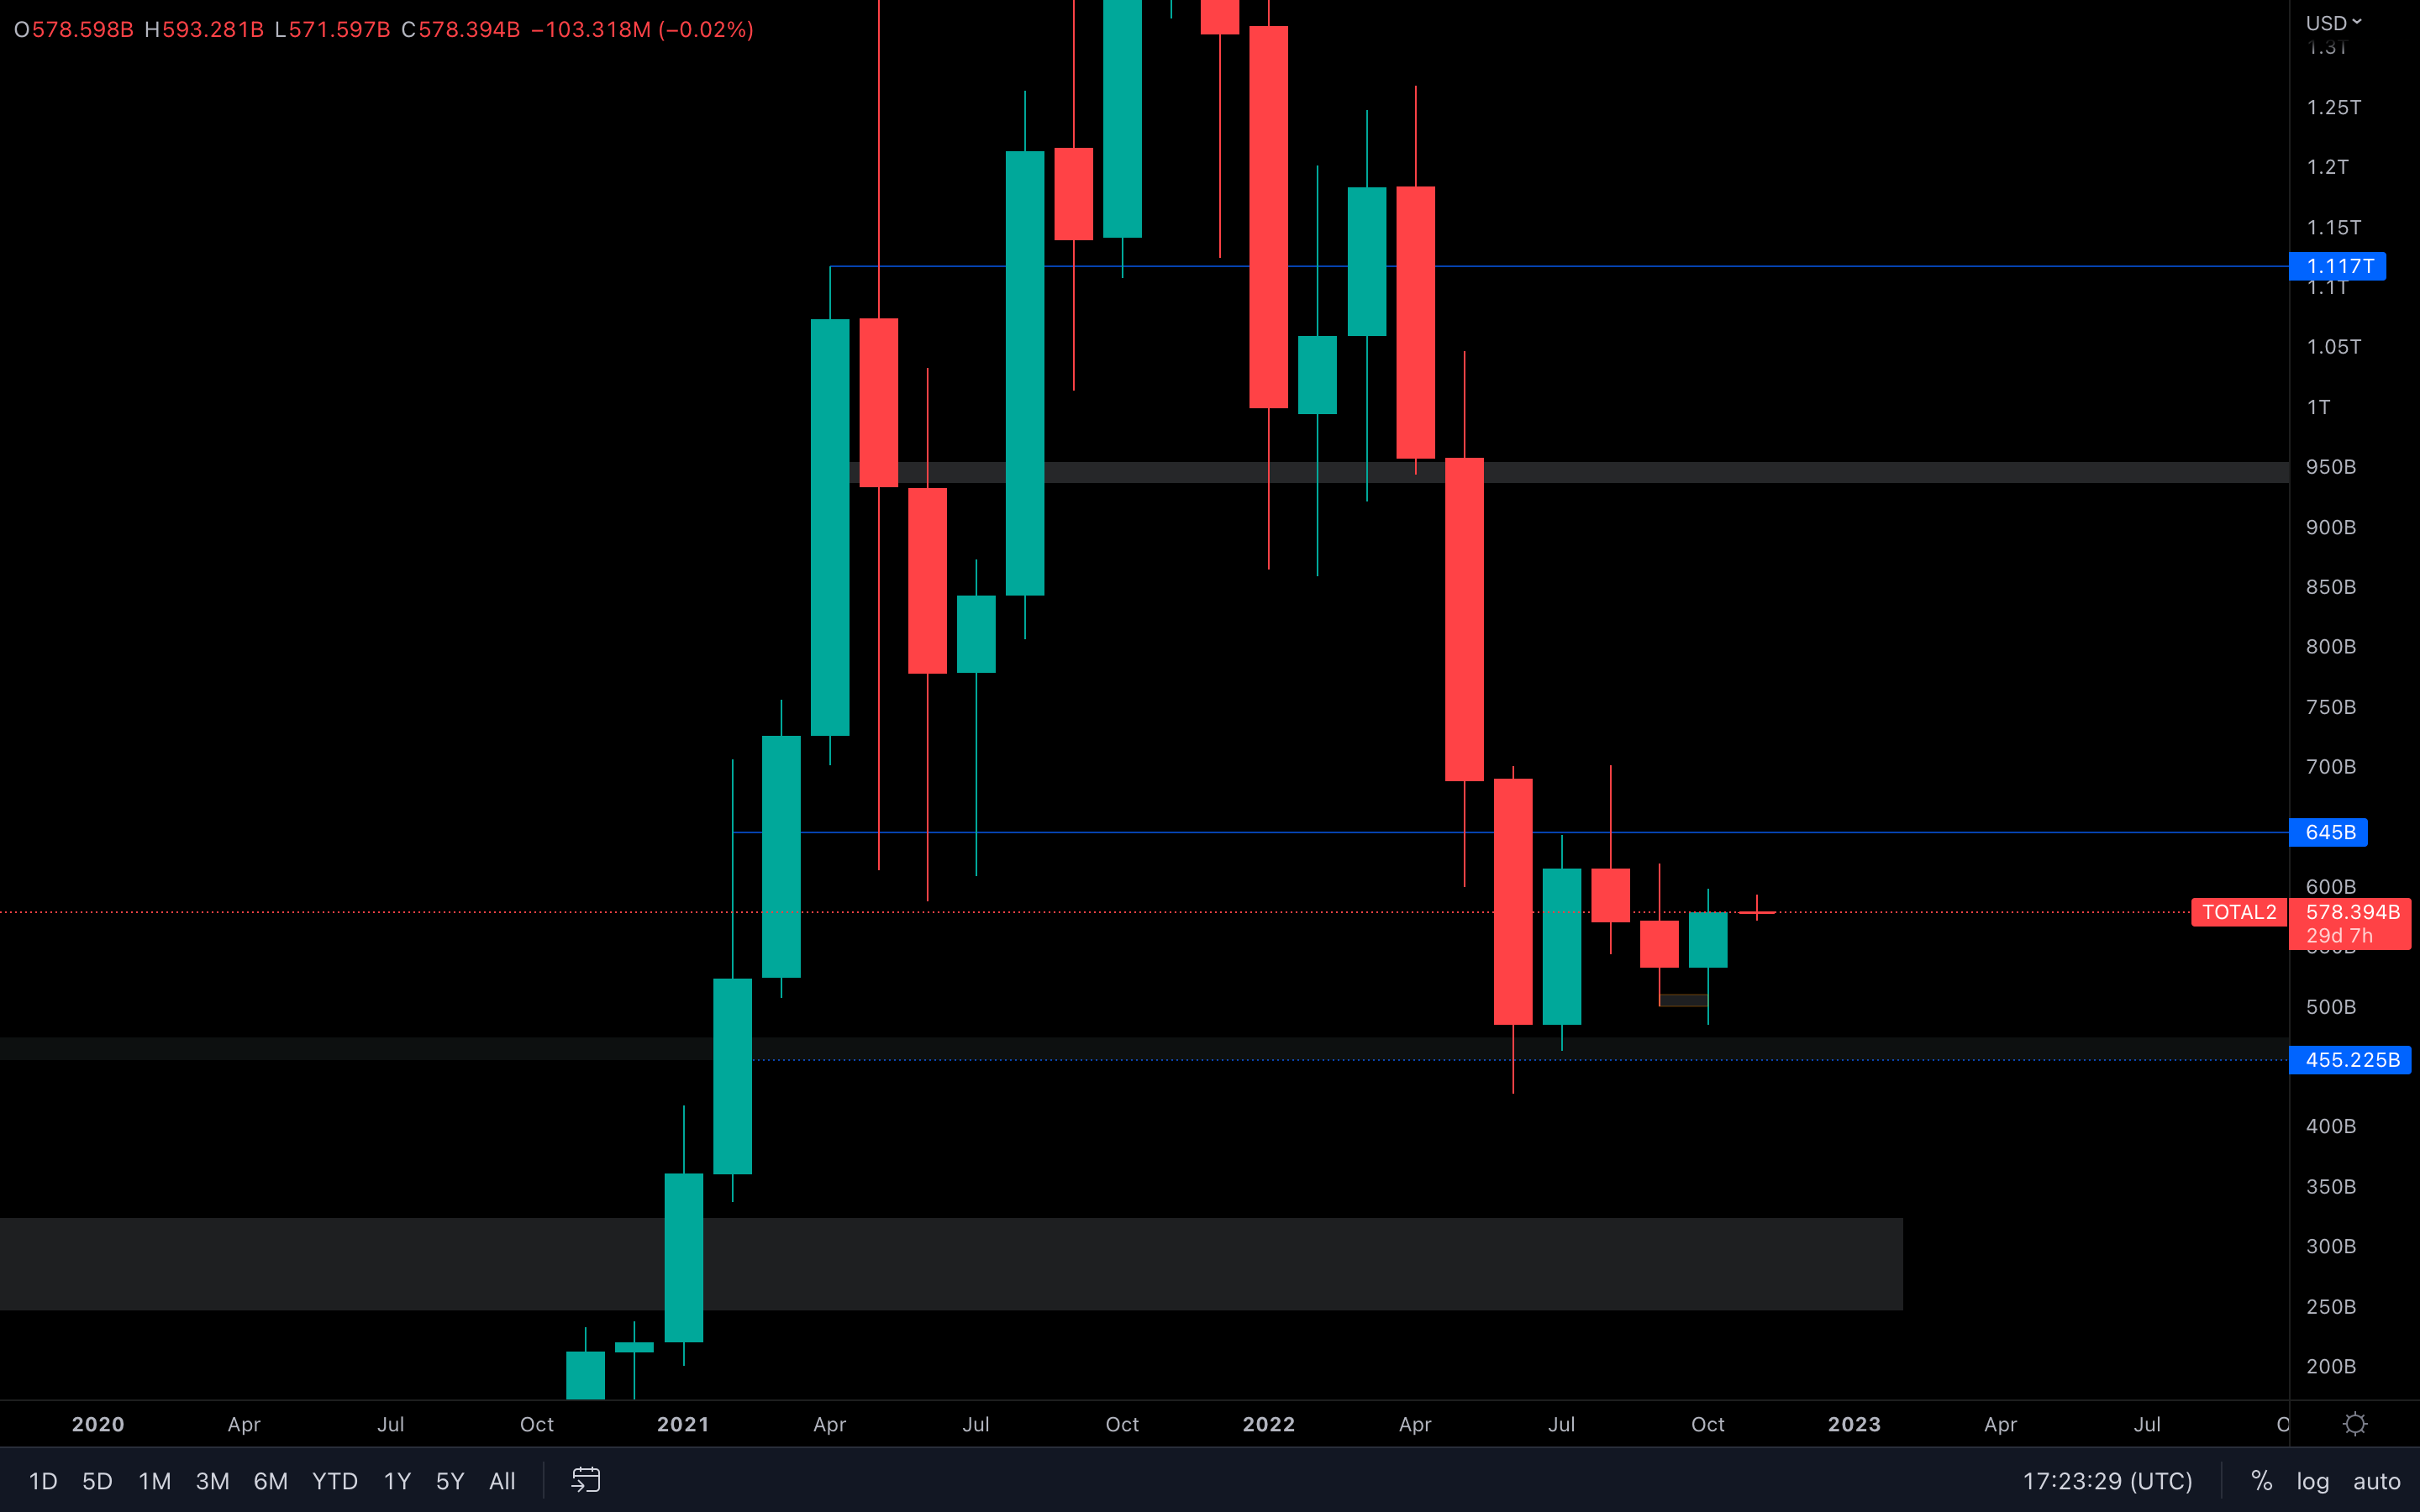 Check the Total MCap analysis to understand what's going on here - the charts look exactly the same.
If November does indeed end up being bullish, then we should expect a $645B resistance test for the Altcoins Market Cap index this month.
Bitcoin - Technical & On-Chain Analysis
 (Weekly chart was used)
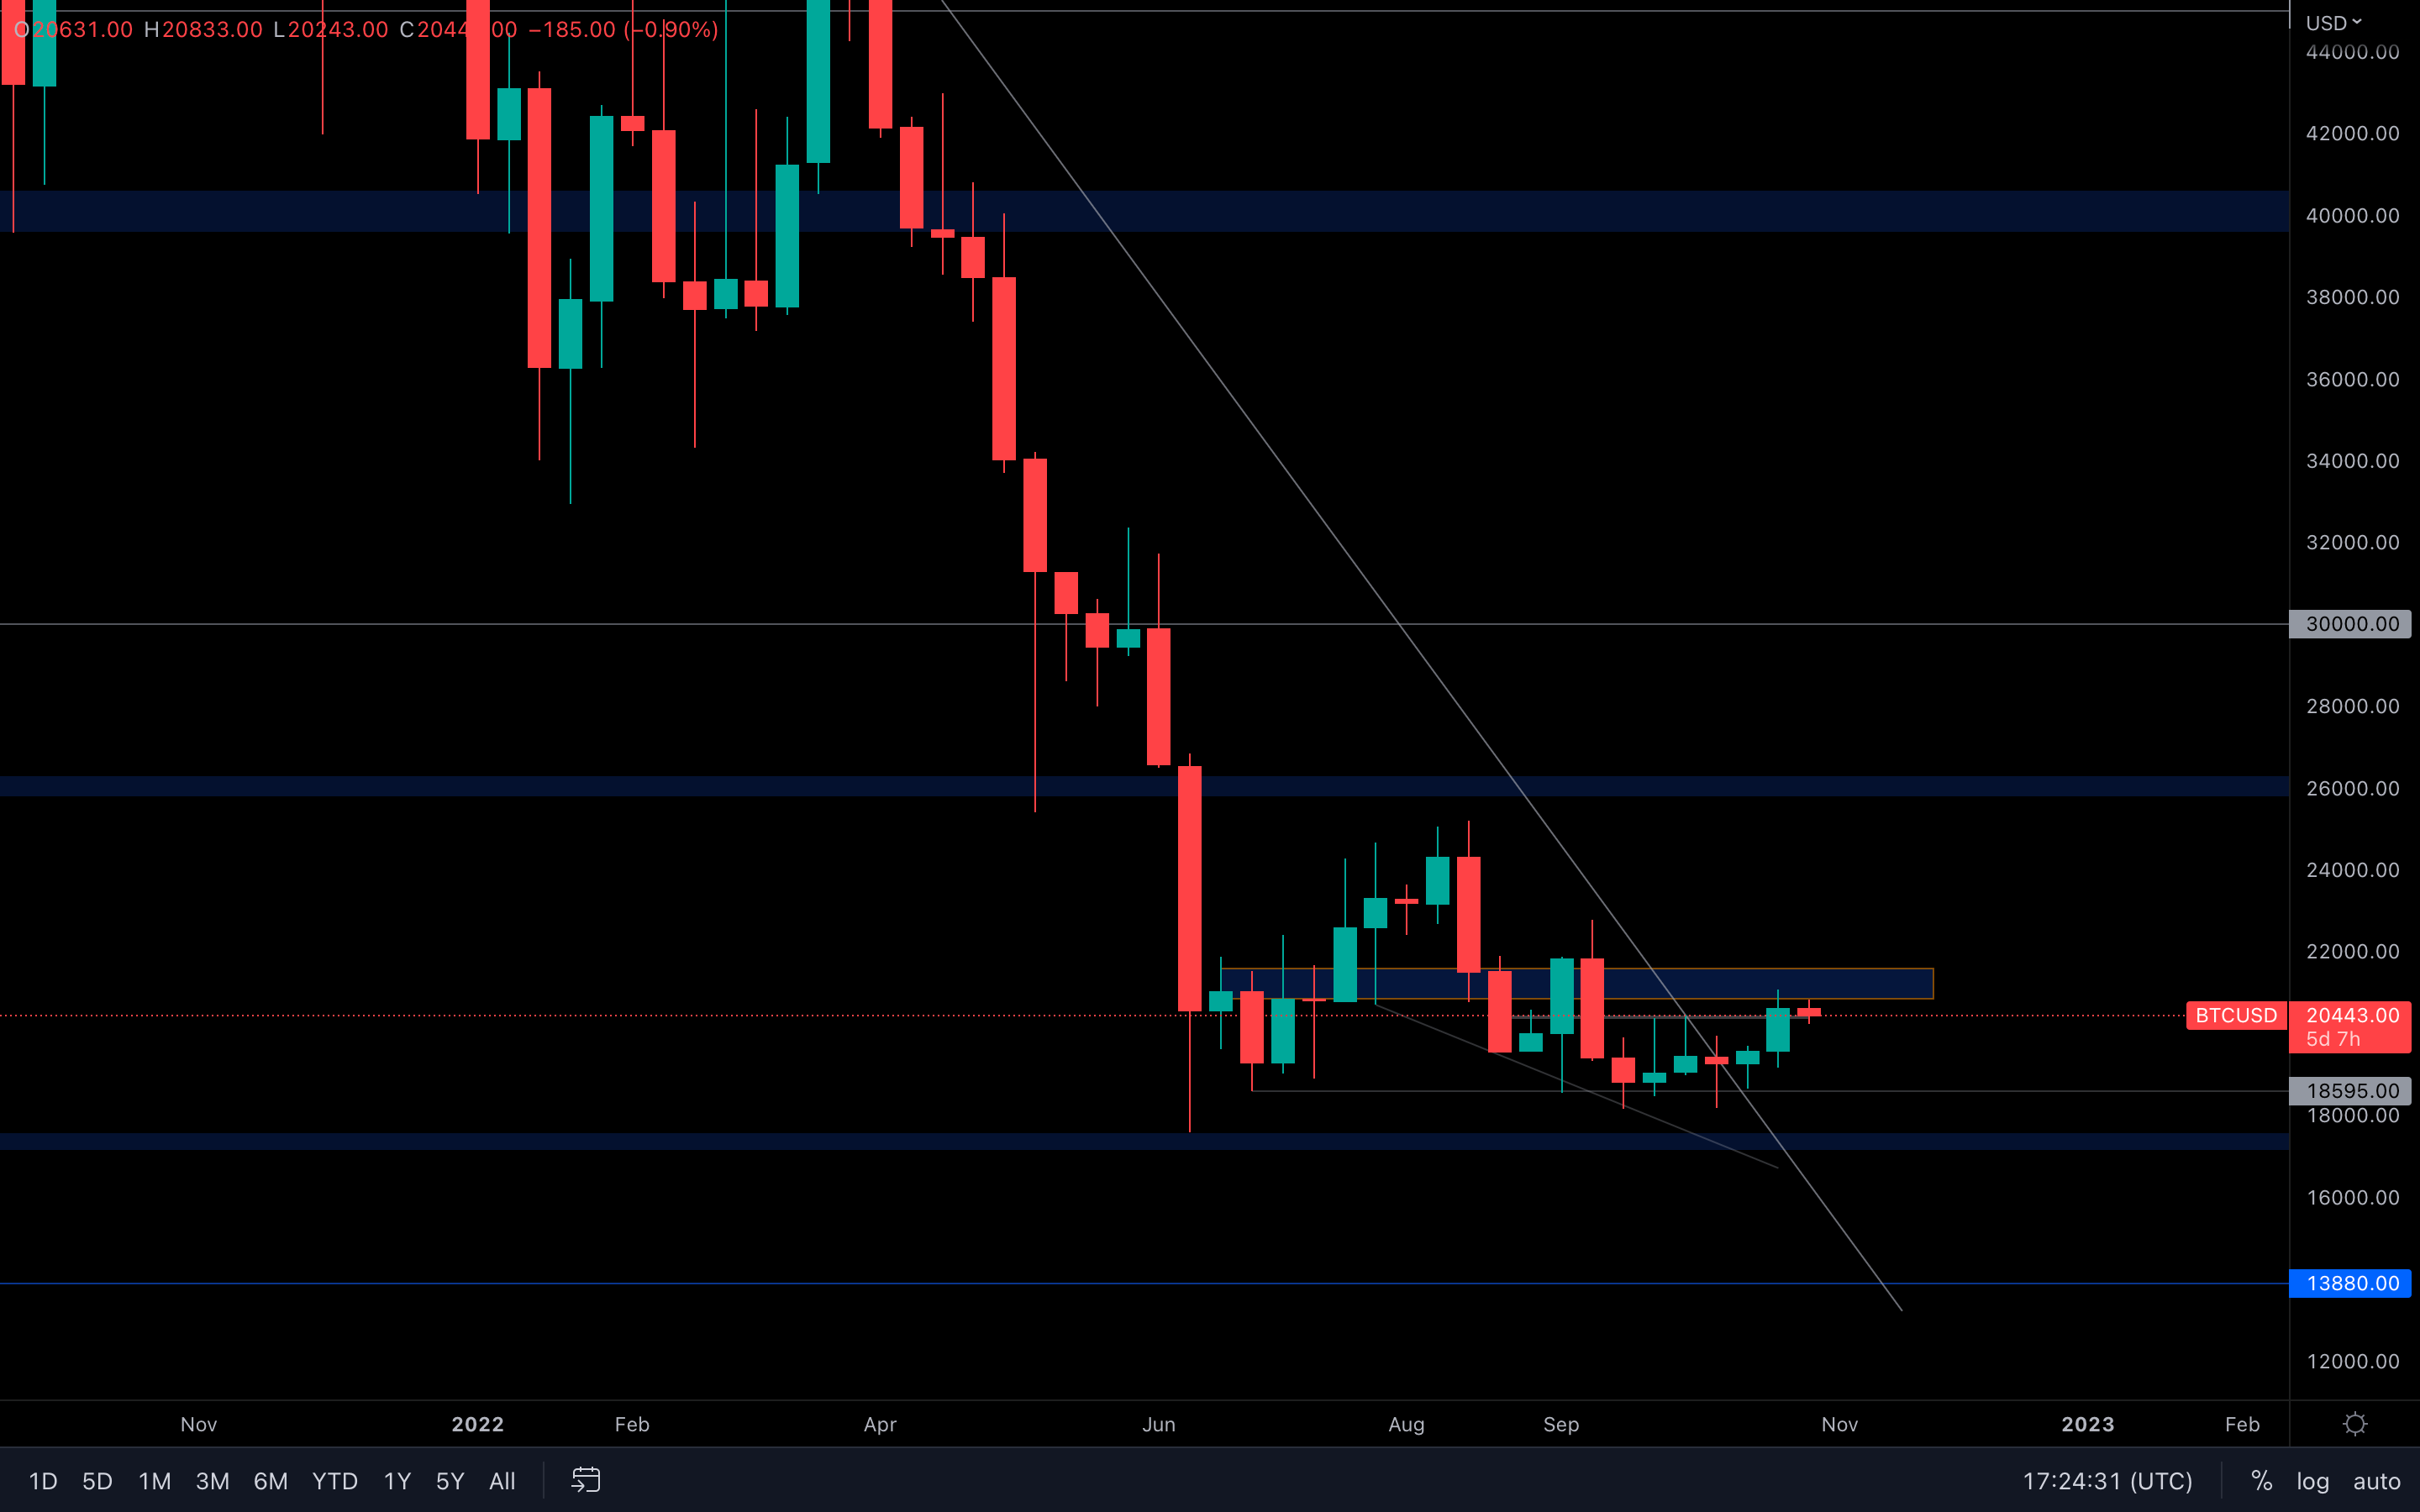
This almost 1-year old resistance trend line has been broken two weeks ago, after which Bitcoin experienced a small increase in its price up to the $21,000 resistance level. The reason we dived into the weekly timeframe here is that it gives us a clearer view of this specific breakout, which will play an important role in November's price action.
As of now, the asset is trying to break above the $21,000 level - if successful, then we could be looking at prices as high as $26,000 in Q4. If Bitcoin is unable to reclaim this local resisting area, however, then a drop to $18,600 will follow shortly.
It's just a matter of confirmation now - wait for either of these scenarios to occur and act accordingly.
Metric 1 – Addresses
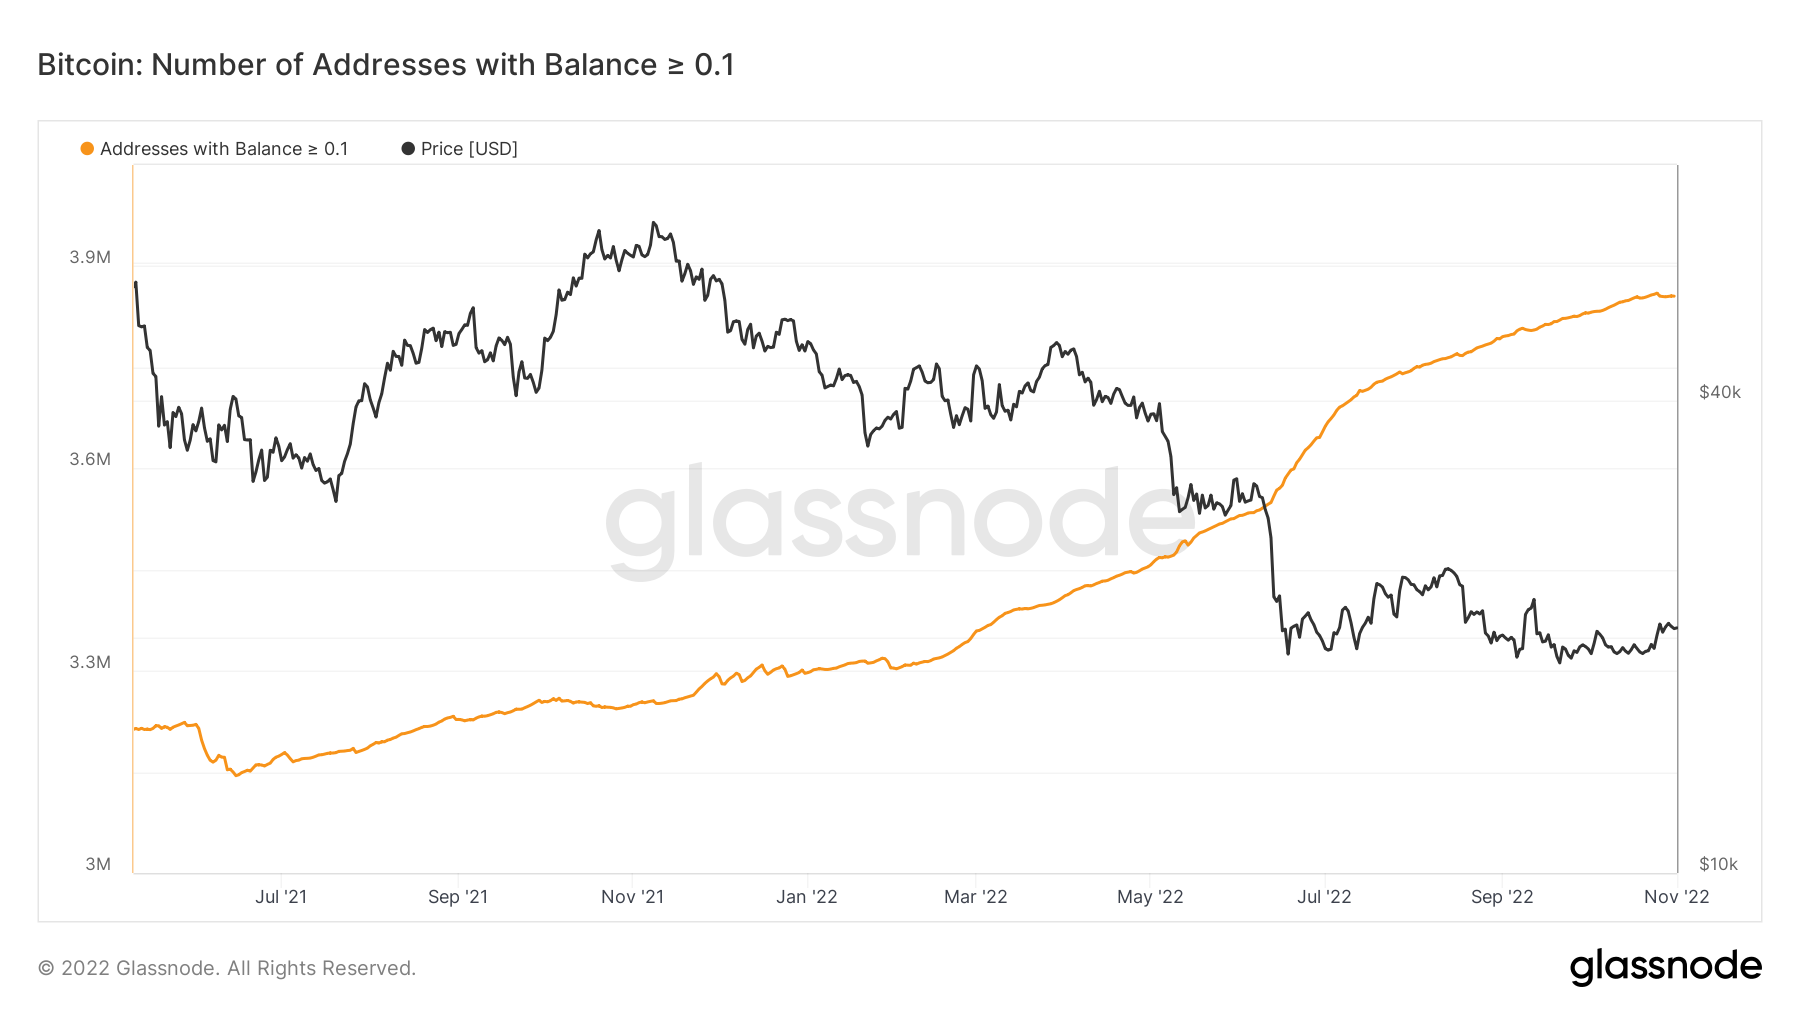
When assessing the addresses metrics during mid-to-late stage bear markets, we’re looking for the larger Bitcoin wallet cohorts to show signs of risking-on (adding to their balances) and for the smaller Bitcoin wallet cohorts to be risking-off – fearful of adding coins into the lower prices or the anticipation of lower prices. We can see below, that the smaller Bitcoin wallet cohorts have historically always added coins (or sats) to their balances but have recently become hesitant to continue adding sats.
Bitcoin – Addresses with Balance > 0.1 Bitcoin
 Bitcoin – Addresses with Balance > 1 Bitcoin
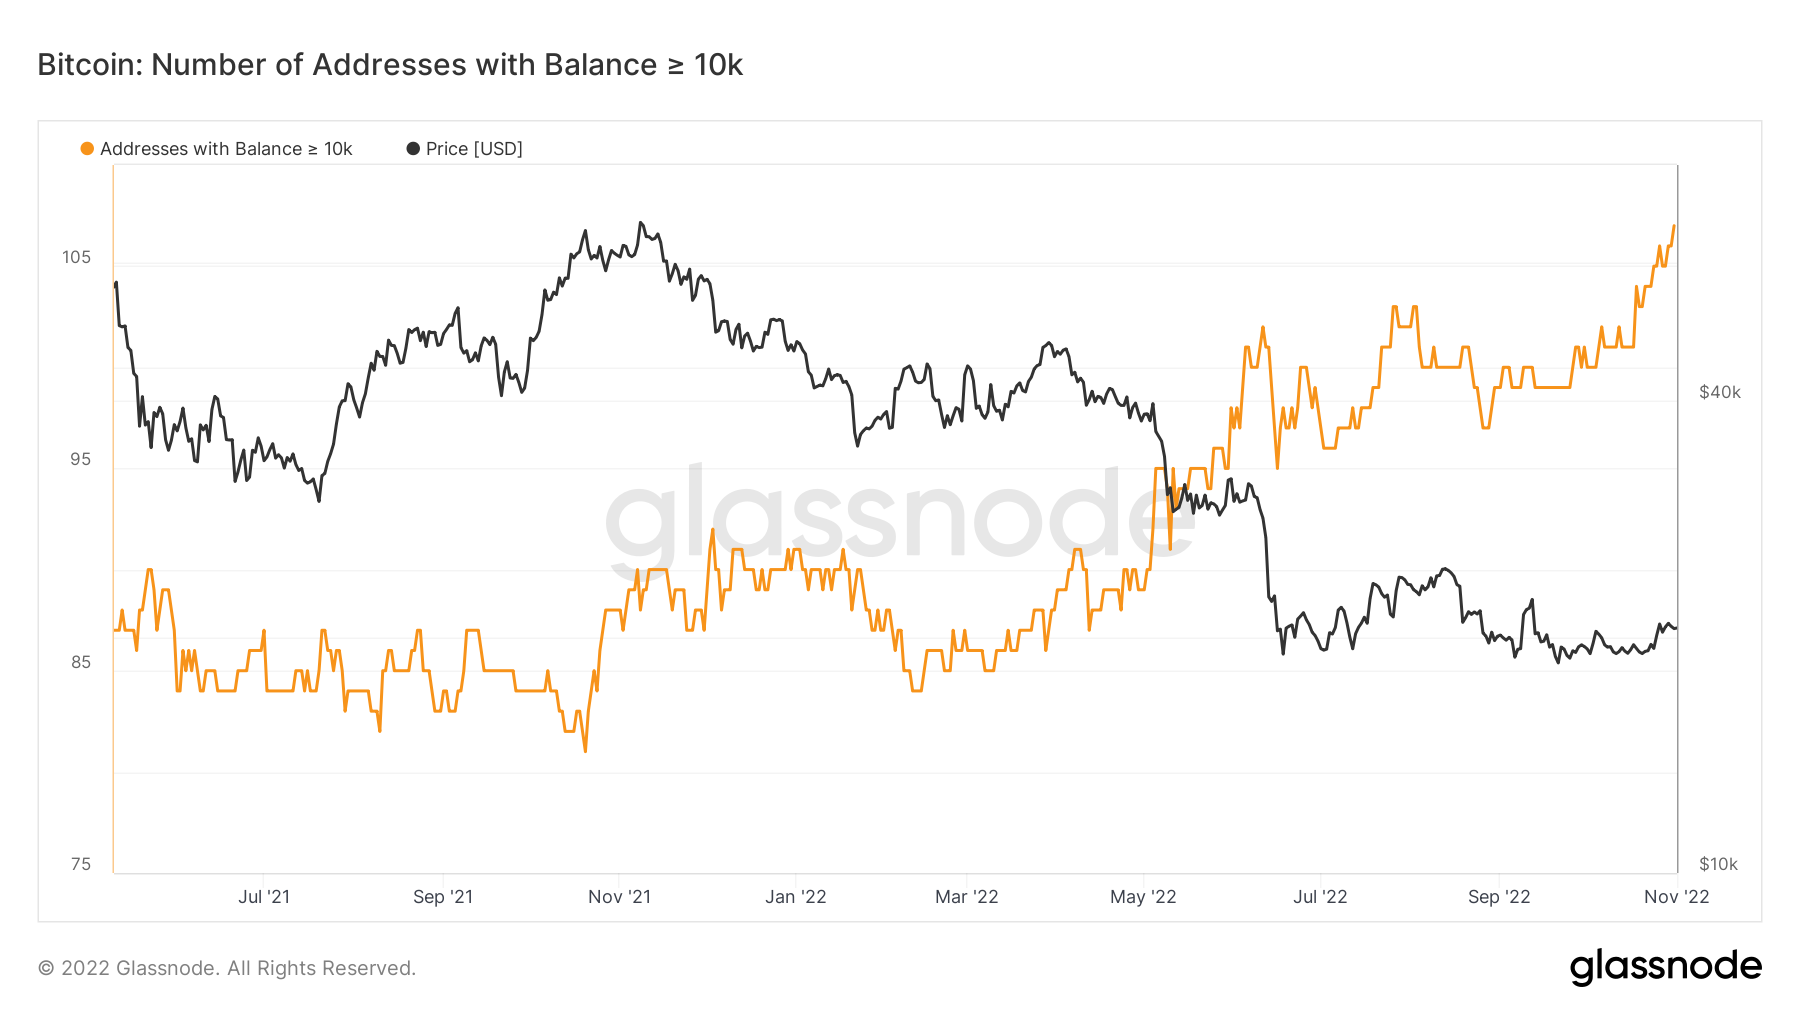
 However, we can see that the larger Bitcoin wallet cohorts have begun the process of risking on. This is the first time we have seen the 1K Wallet cohort increase in its number of wallets. The 10K Bitcoin Wallet cohorts have seen the number of wallets in this cohort increase significantly – risk-on.
Bitcoin – Addresses with Balance > 1,000 Bitcoin
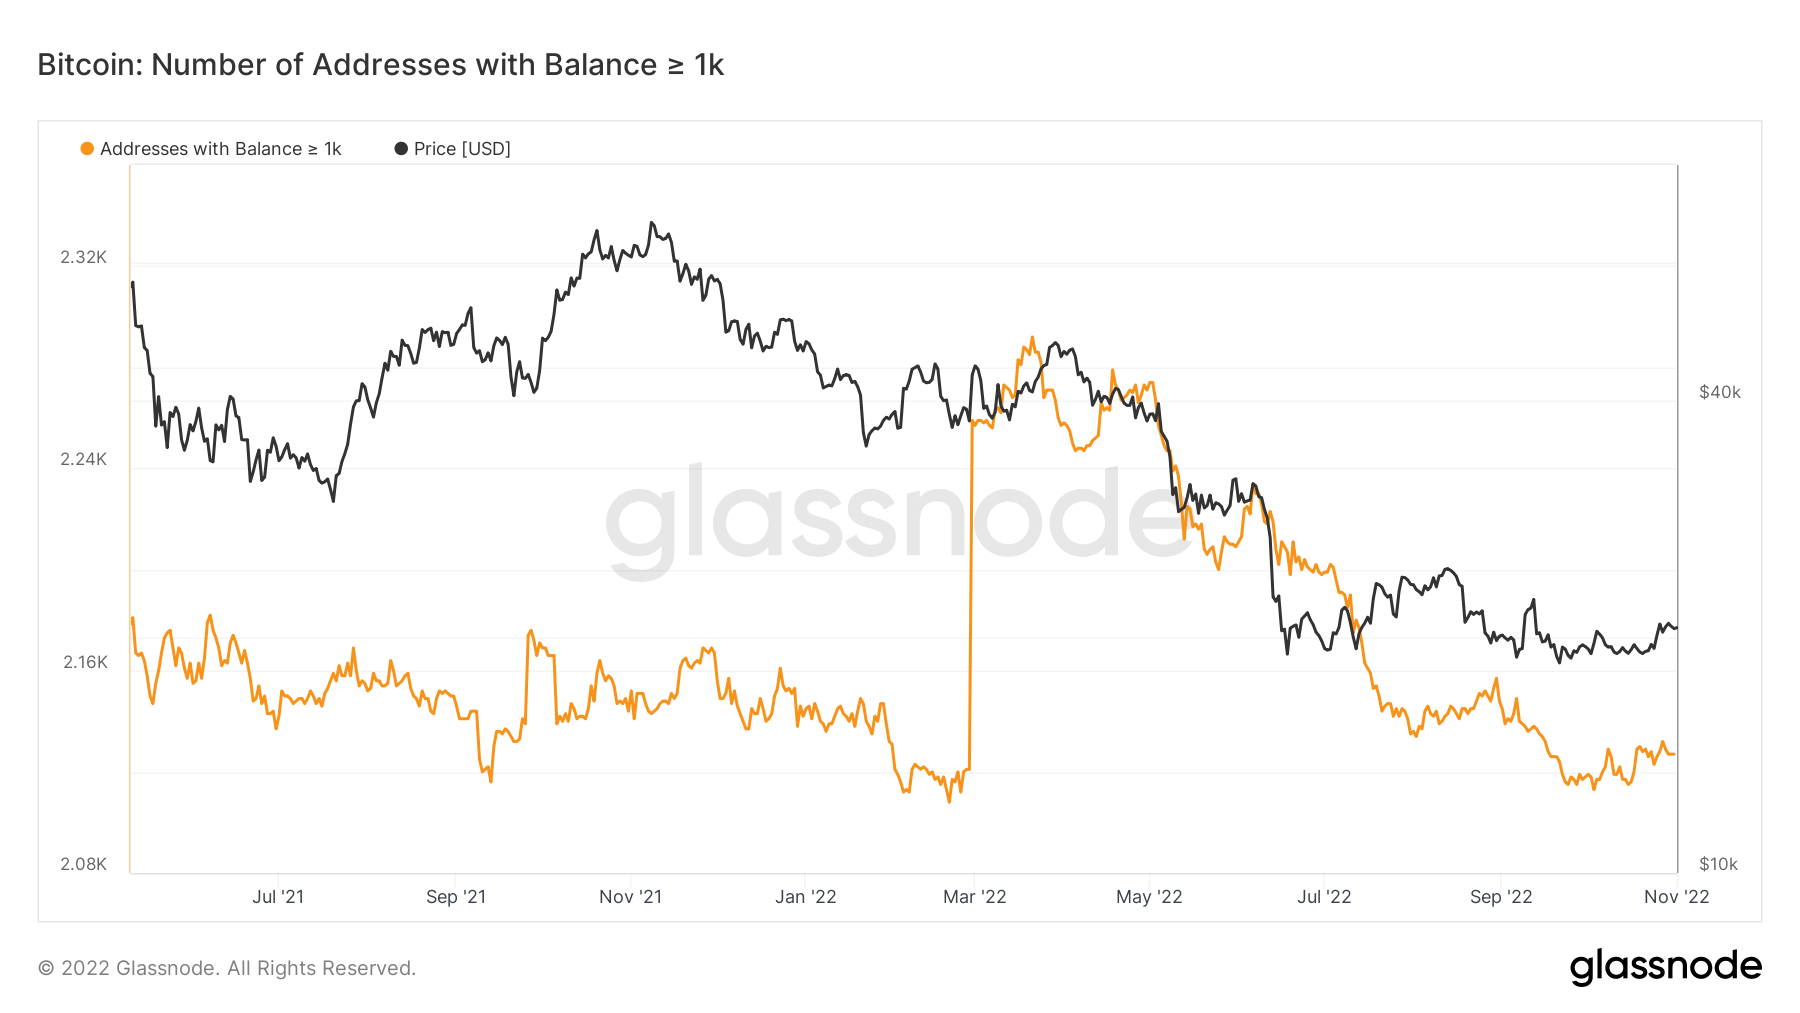 Note: The large move up on this metric in late February was not an organic move up. This was confirmed by the data provider, Glassnode.
Bitcoin – Addresses with Balance > 10,000 Bitcoin
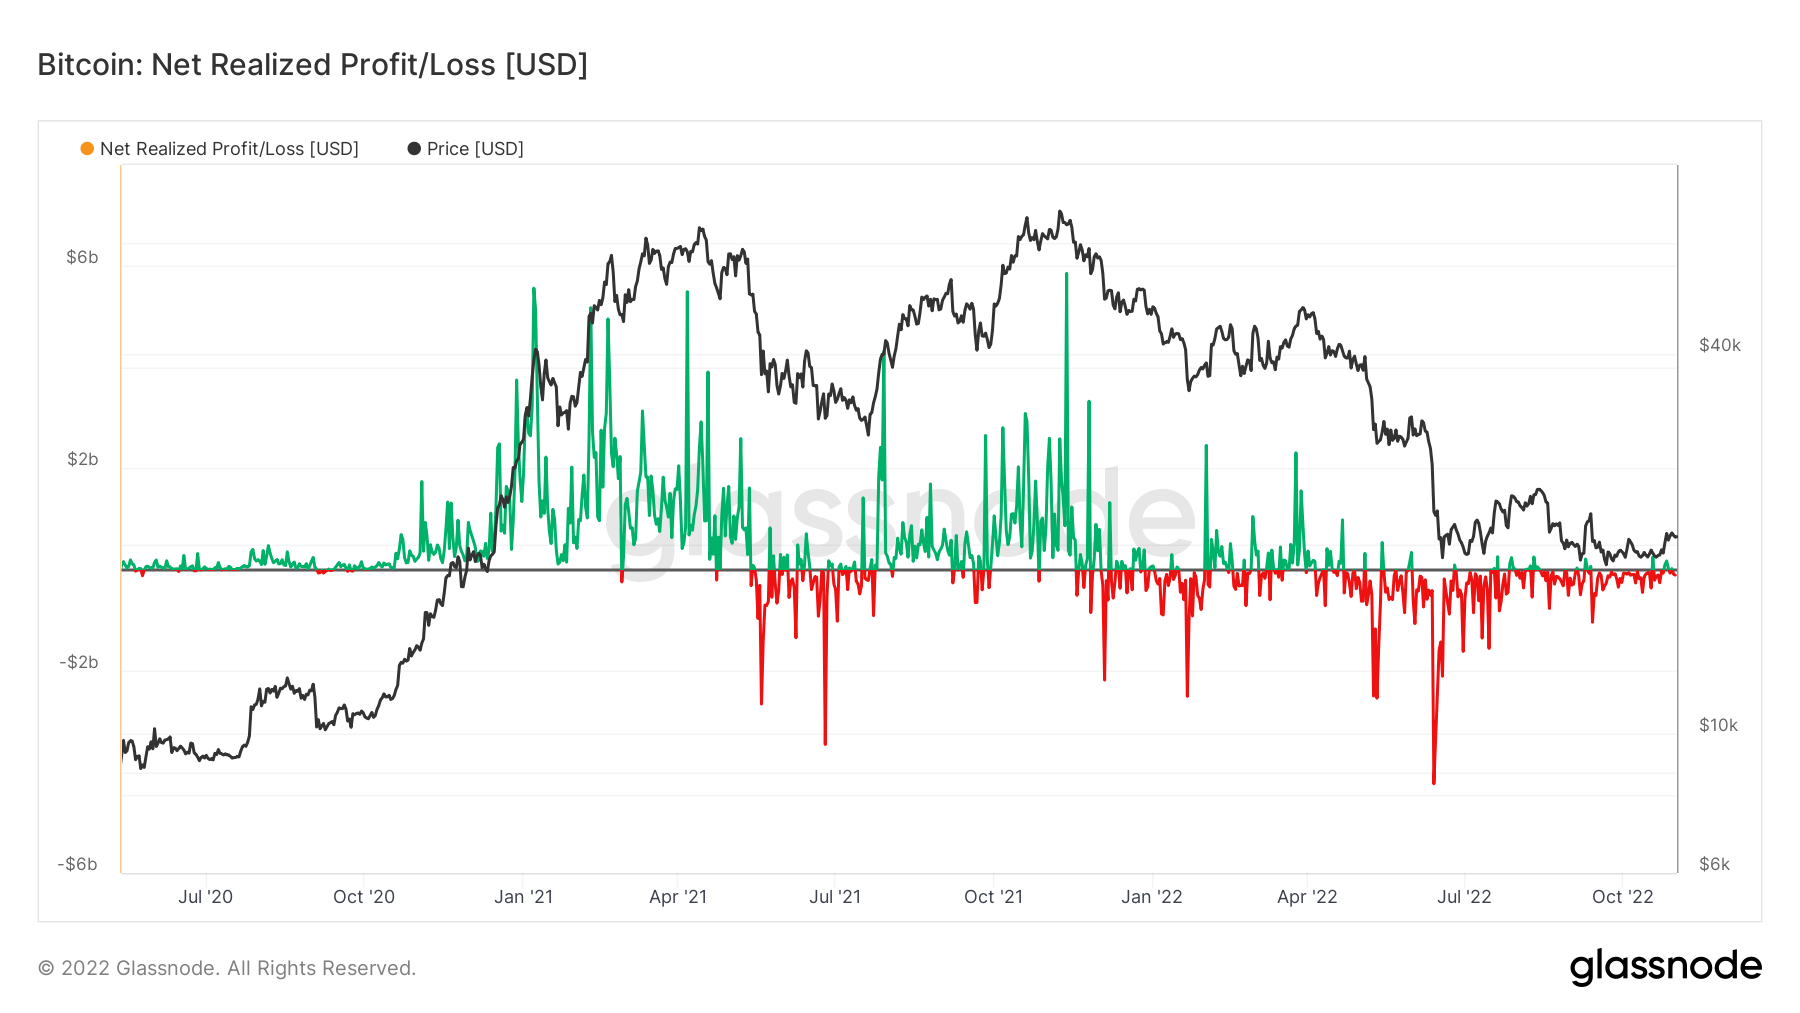
 Metric 2 – Net Realised Profit/Loss
The Net Realised Profit/Loss has been an important metric recently when assessing investor sentiment. We can see that the black horizontal 0 line has continued to act as resistance – this is where investors are approaching break-even levels. In the past months, we have seen investors sell into break-even levels, however recently we have seen small green spikes (profit-taking). It’ll be important to continue assessing this metric in the coming weeks to see if investor actions/sentiment begin shifting.
Bitcoin – Net Realised Profit/Loss
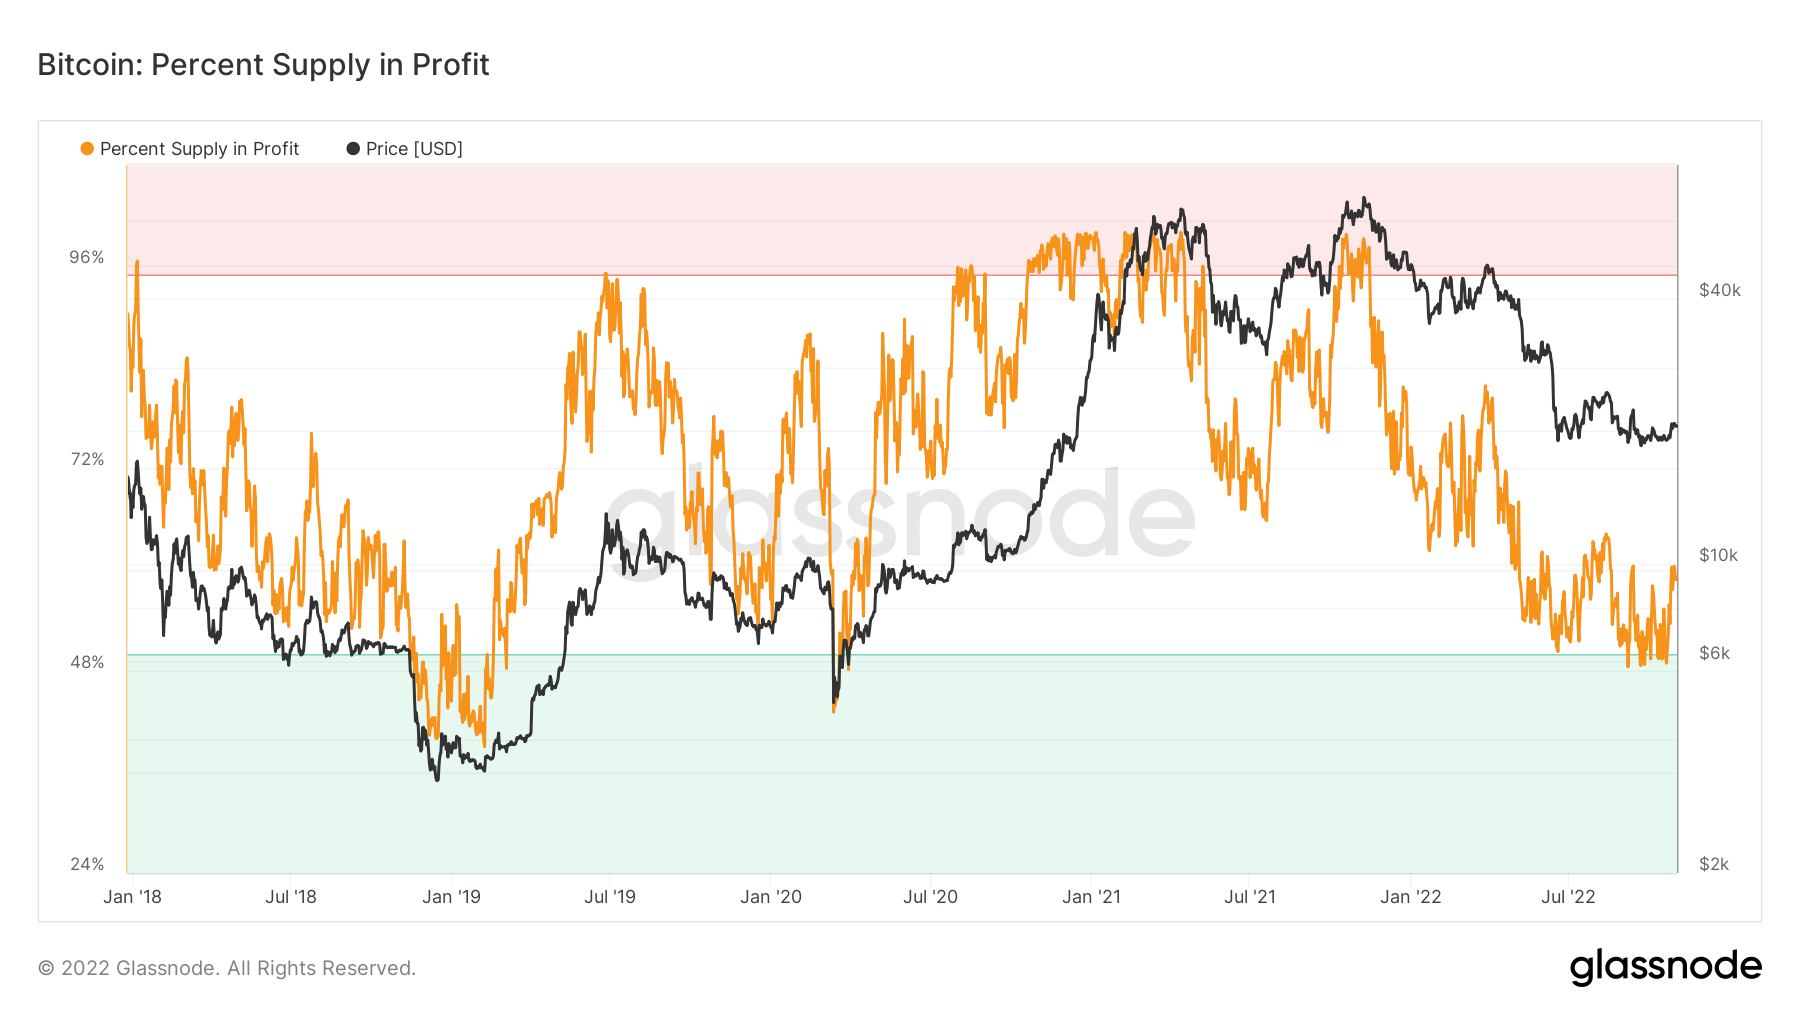
 Metric 3 – Percent Supply in Profit
The Percent Supply in Profit has previously been a good metric for buying Bitcoin during macro bottoms. It currently shows that 58% of the circulating supply is in profit and less than 50% has proven to be where little to no sellers remain. We can see that we are no longer in the green zone. If this metric goes back into the green zone, it could be considered a good strategy to begin Dollar-cost-averaging in.
Bitcoin – Percent Supply in Profit
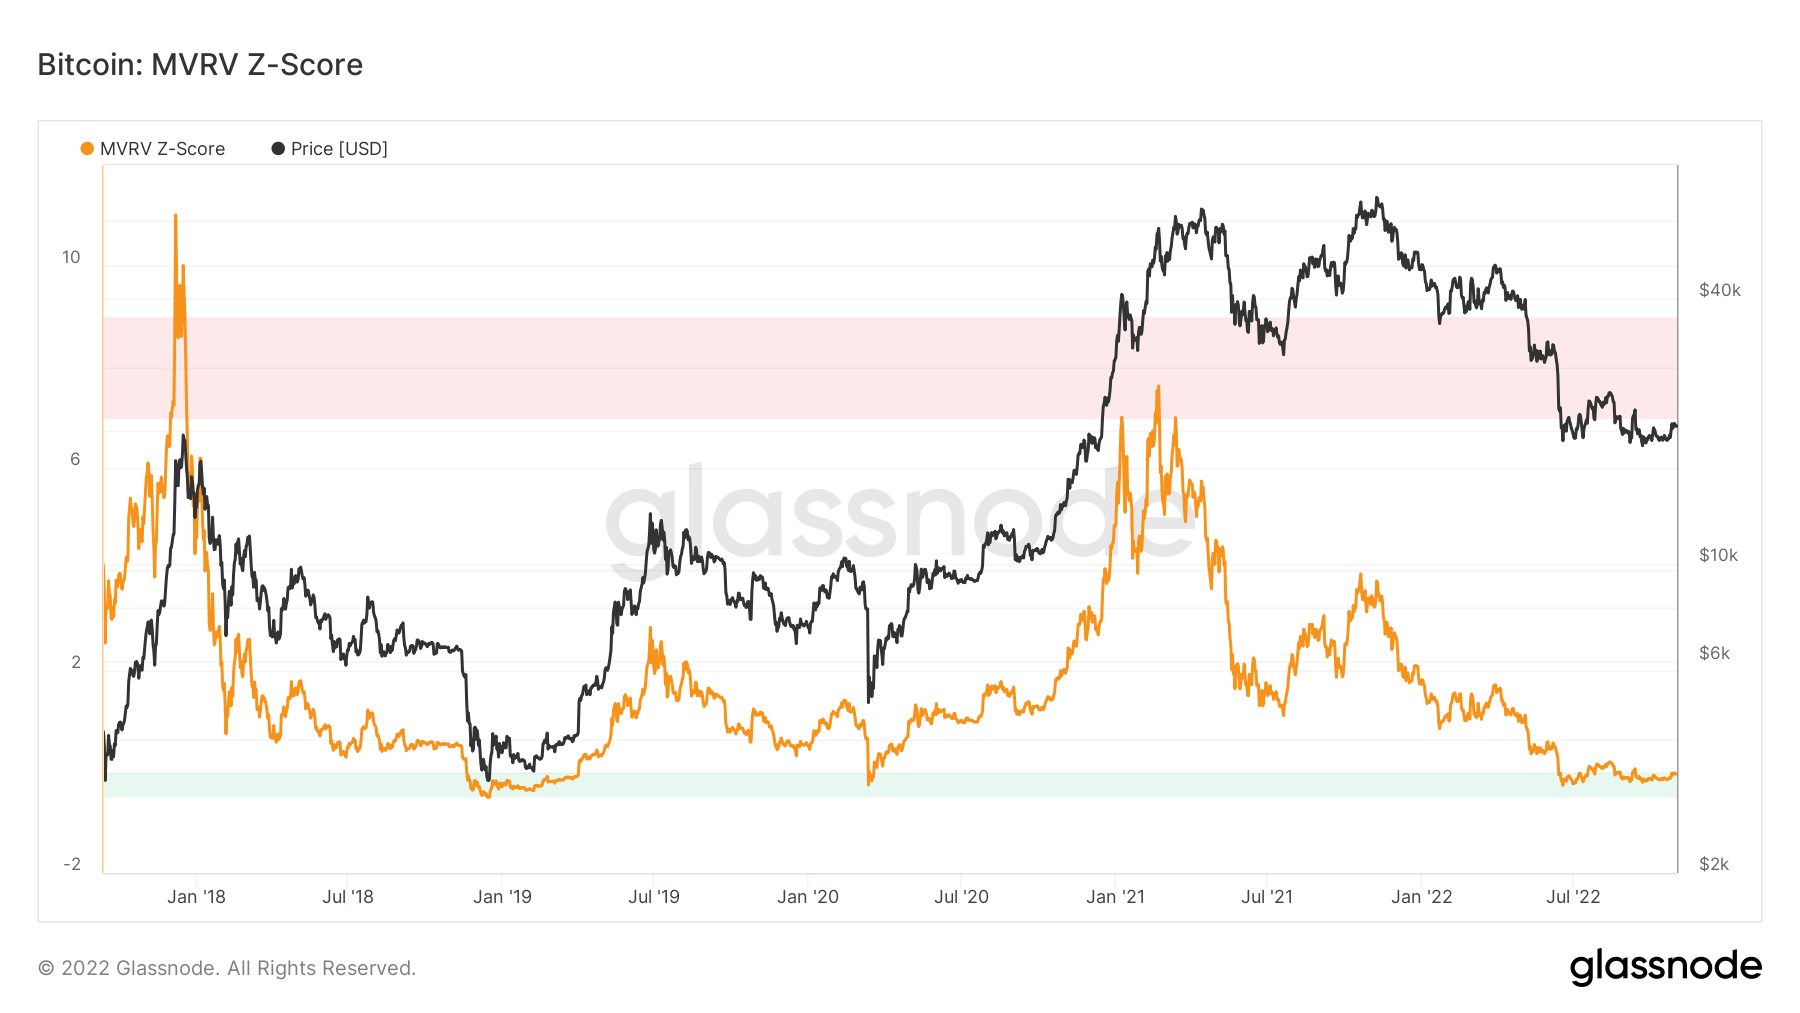
 Metric 4 – MVRV Z-Score
The MVRV Z-Score shows when Bitcoin is over/undervalued relative to its “fair value”. We can see below that the green zone has acted as a good long-term buy zone. This metric has been in this zone for some months now and has previously reached the bottom of this zone. We’re currently at the higher end of this zone which can still be considered a good long-term entry point, however, a move to the bottom of this zone, would likely mean a 20 – 30% drop in Bitcoin’s price in order to get it there.
Bitcoin – MVRV Z-Score
Ether - Technical Analysis
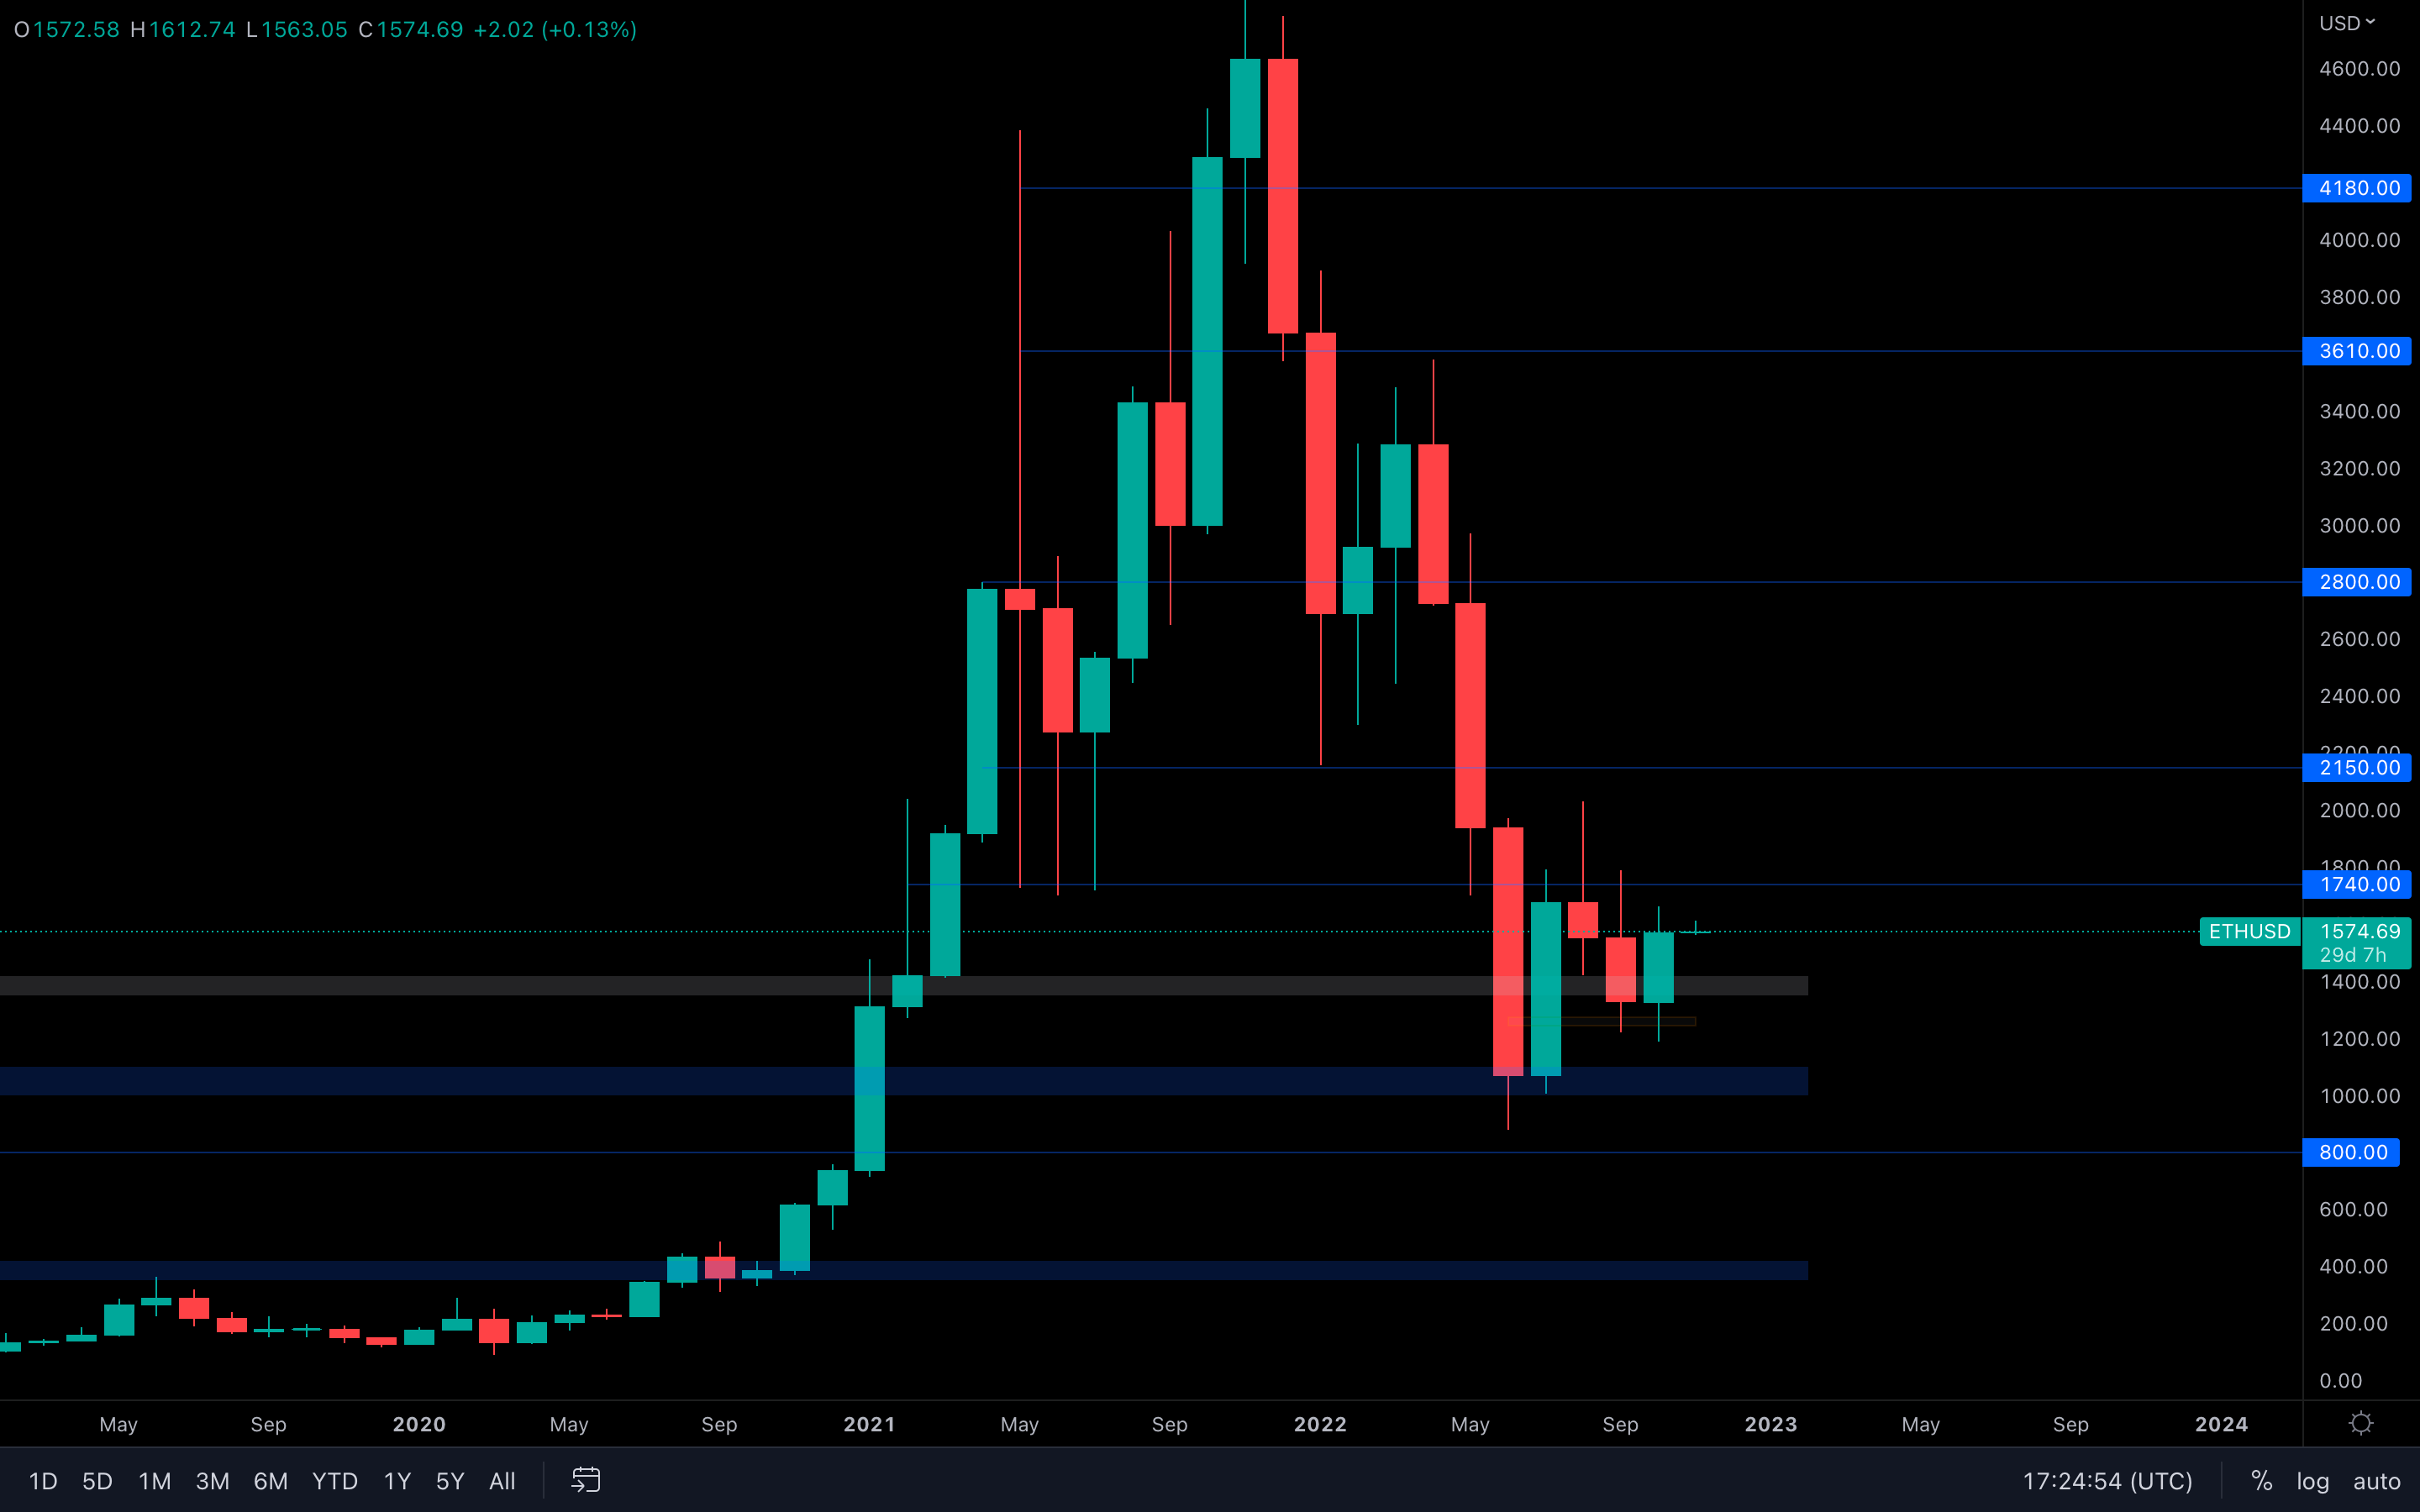 Similar to the Total MCap, Ether has closed October above September's candlestick open, invalidating the bearish price action entirely. The $1400 has held nicely, which could've also formed a monthly higher low here, as far as we know.
I believe Ether will experience a bullish November. If not, a $1740 resistance test is almost guaranteed at this point.
DOT
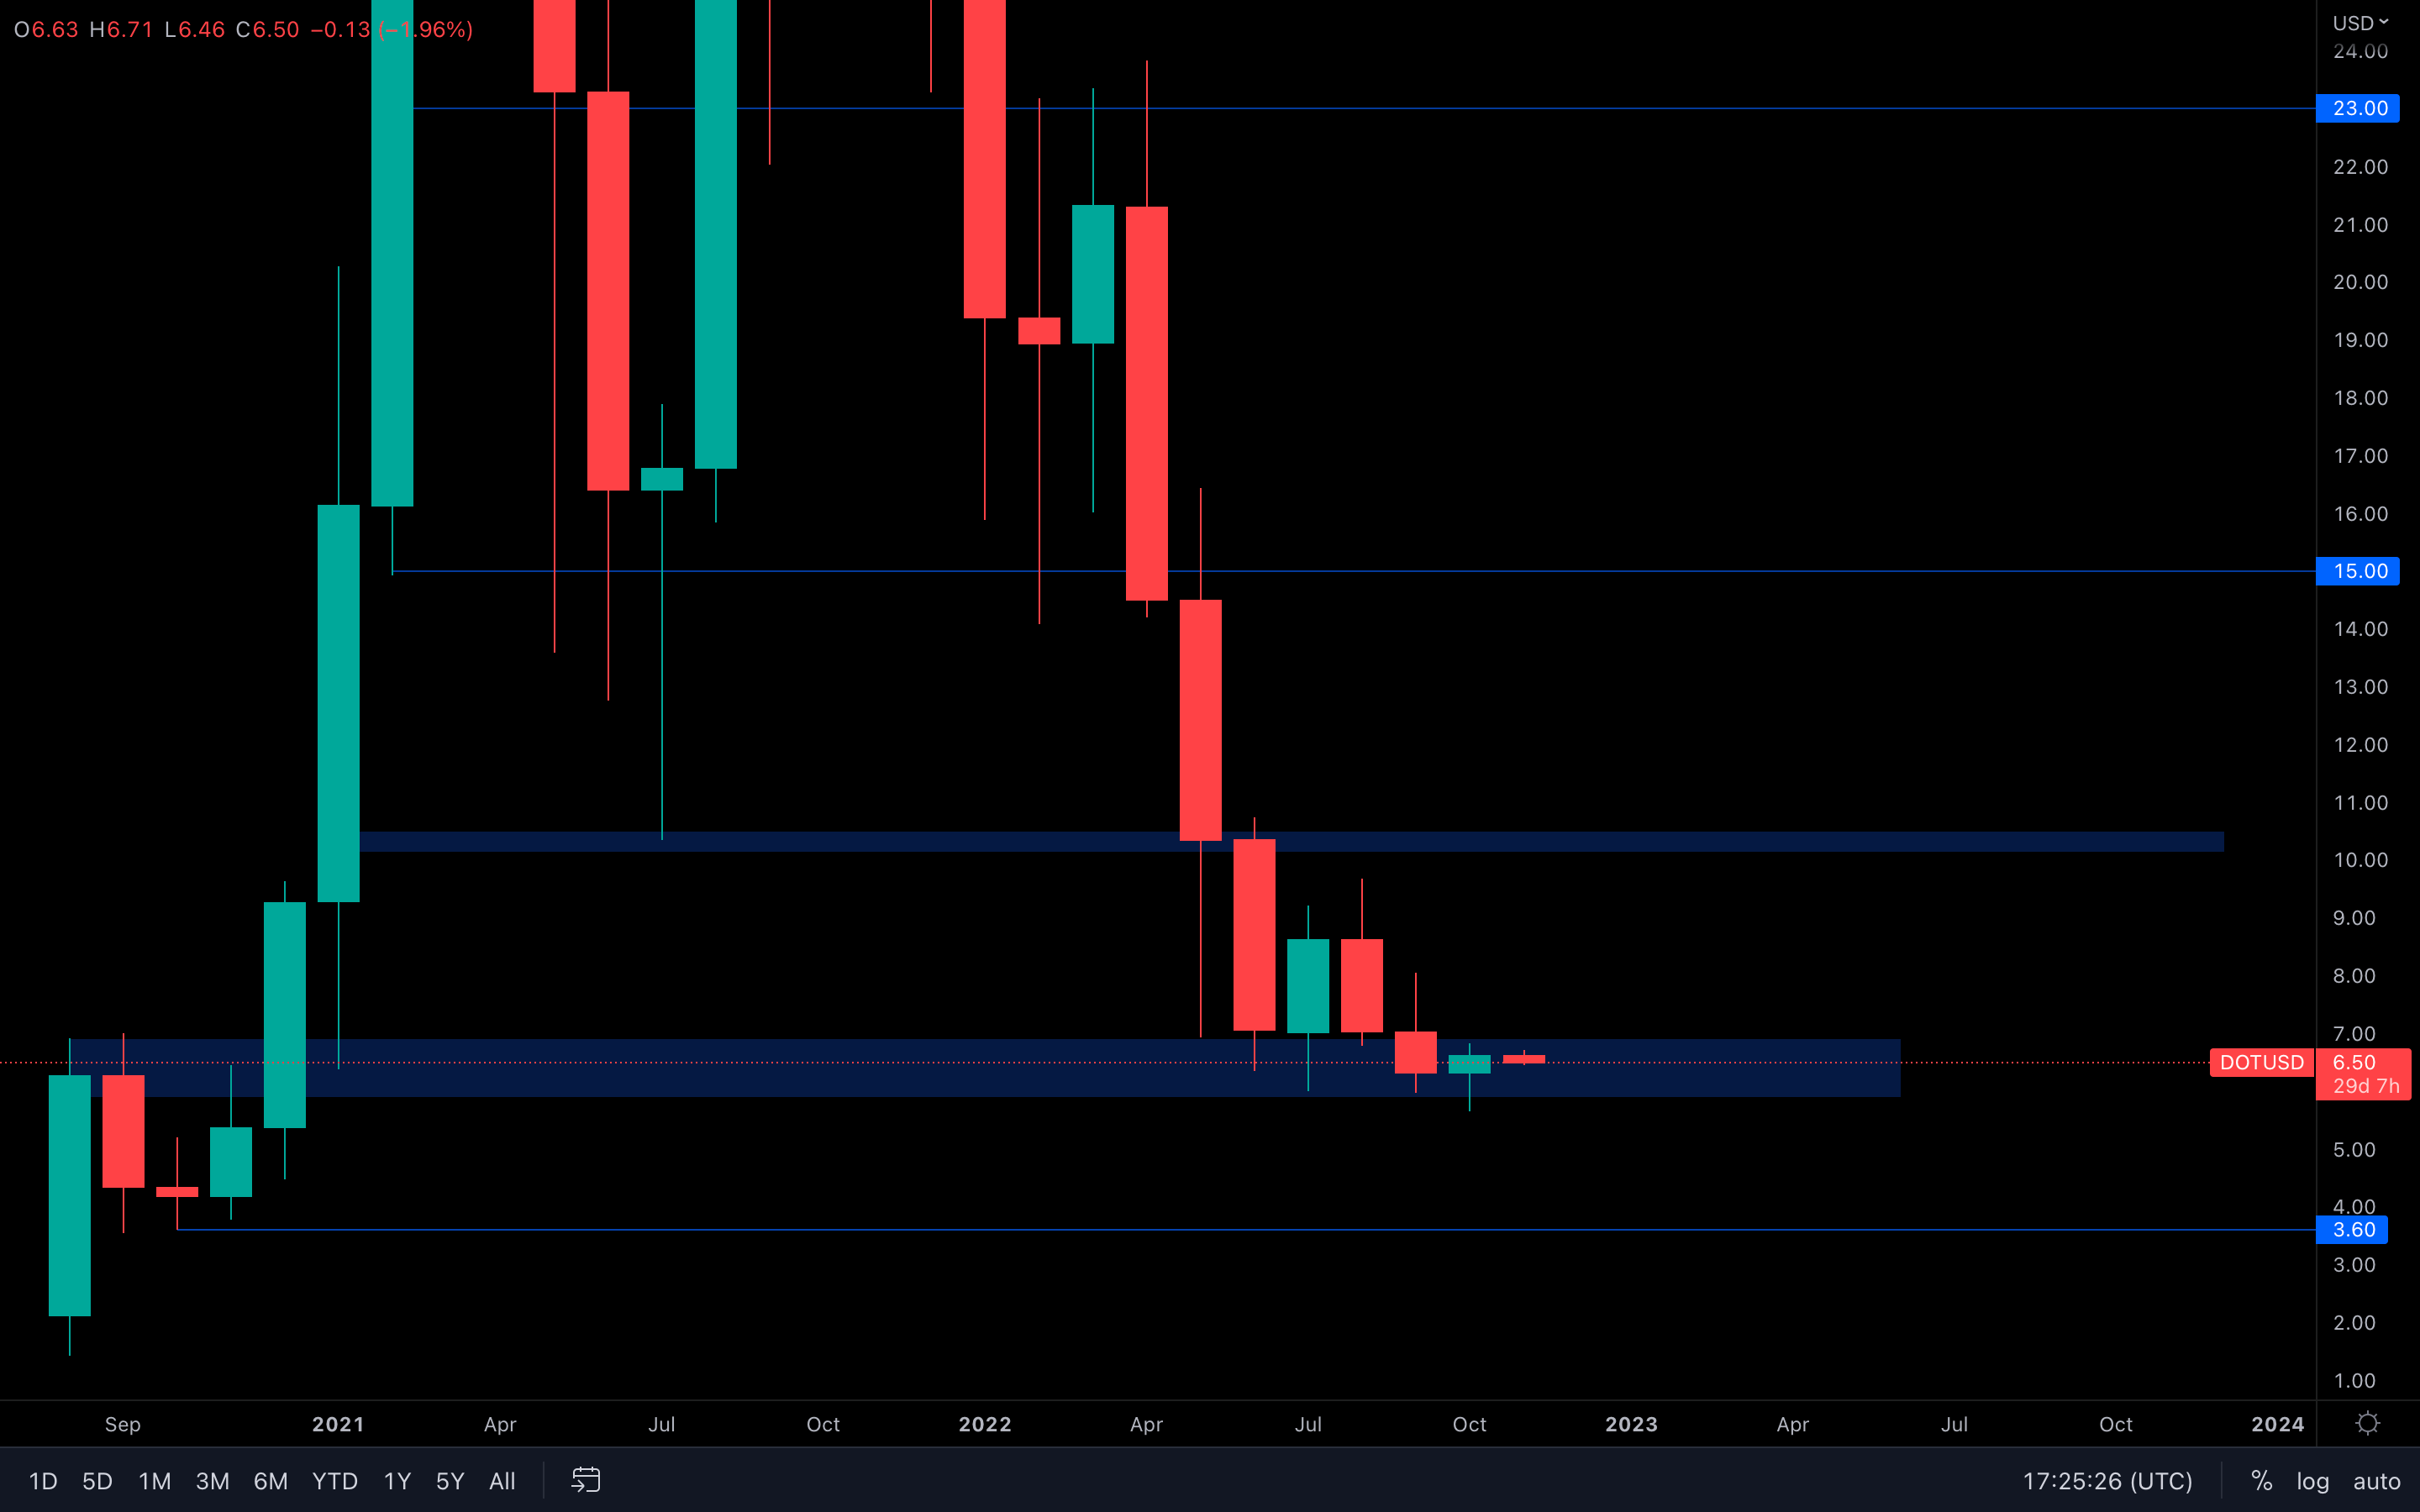 We can see a potential monthly hammer candlestick here, that's a bullish signal.
Not only that, but DOT has managed to hold itself above $6 as well, further strengthening the level. With the majors also looking ready to play, November might end up bullish for DOT.
SNX
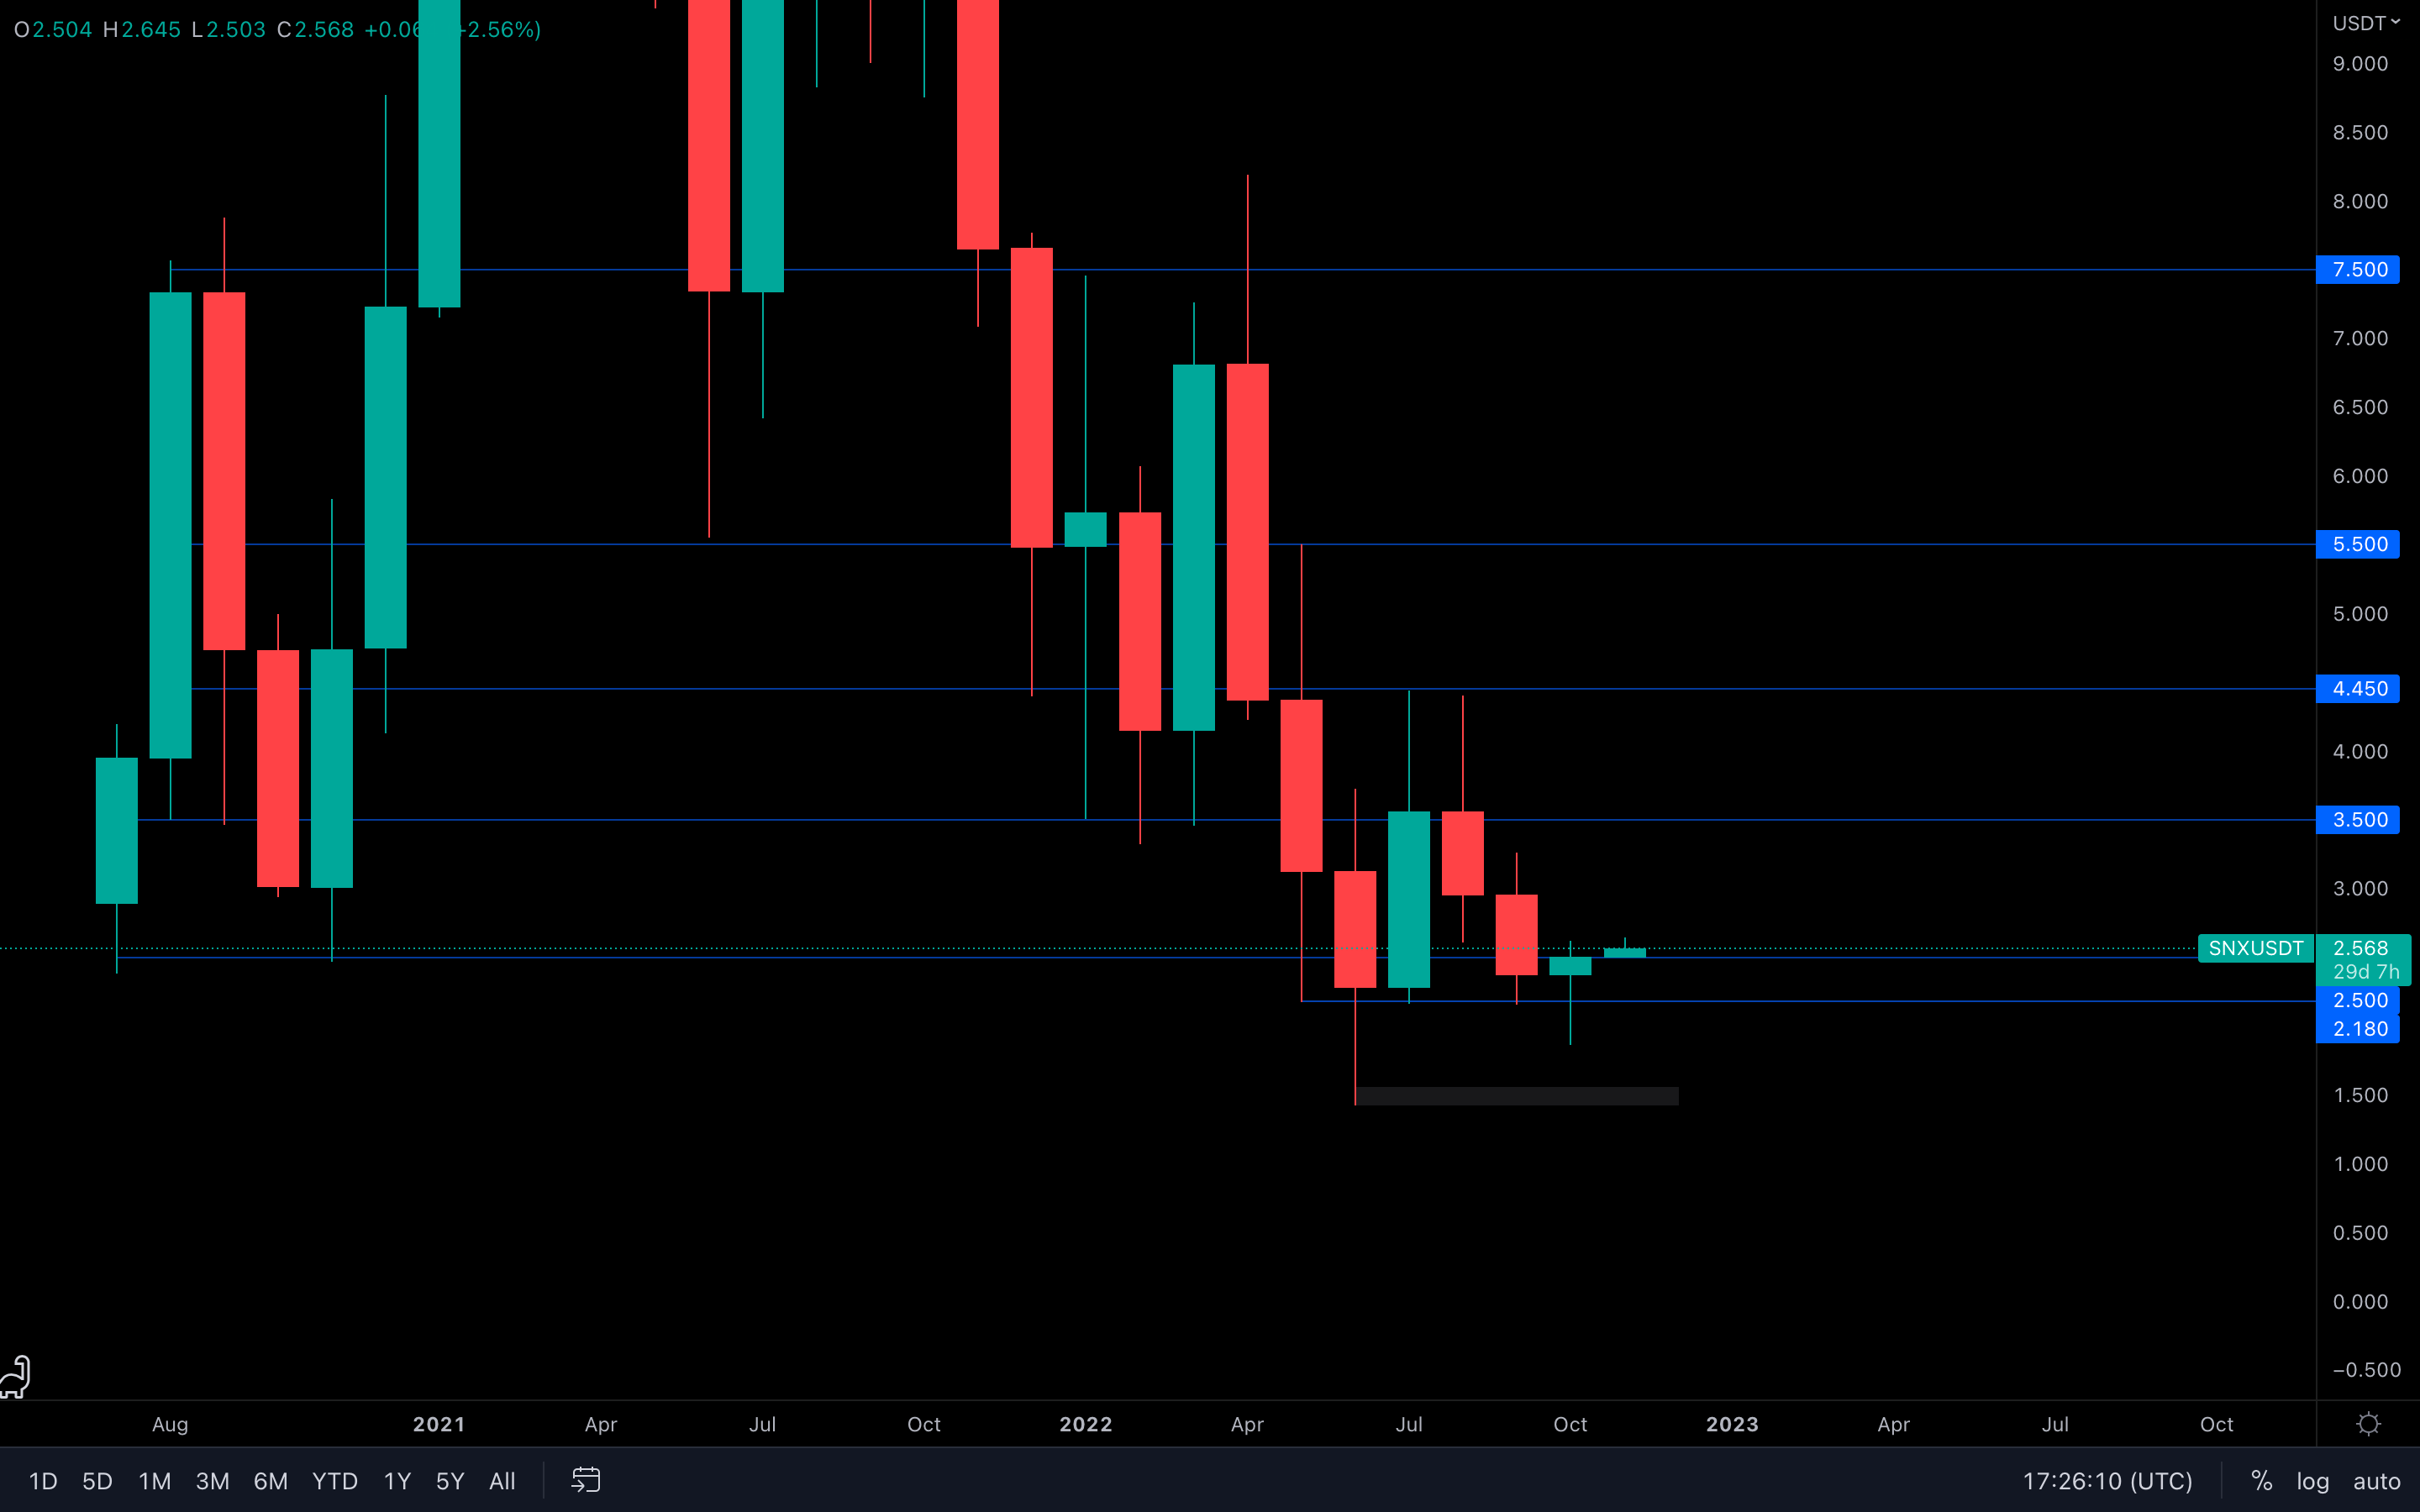 Monthly hammer candlestick, a bullish signal.
There is one slight obstacle here - the $2.50 level. SNX closed October right into it and has yet to close above it on the weekly timeframe. However, candlesticks tell stories, and we know where this one might be going toward:
$3+ in November.
RUNE
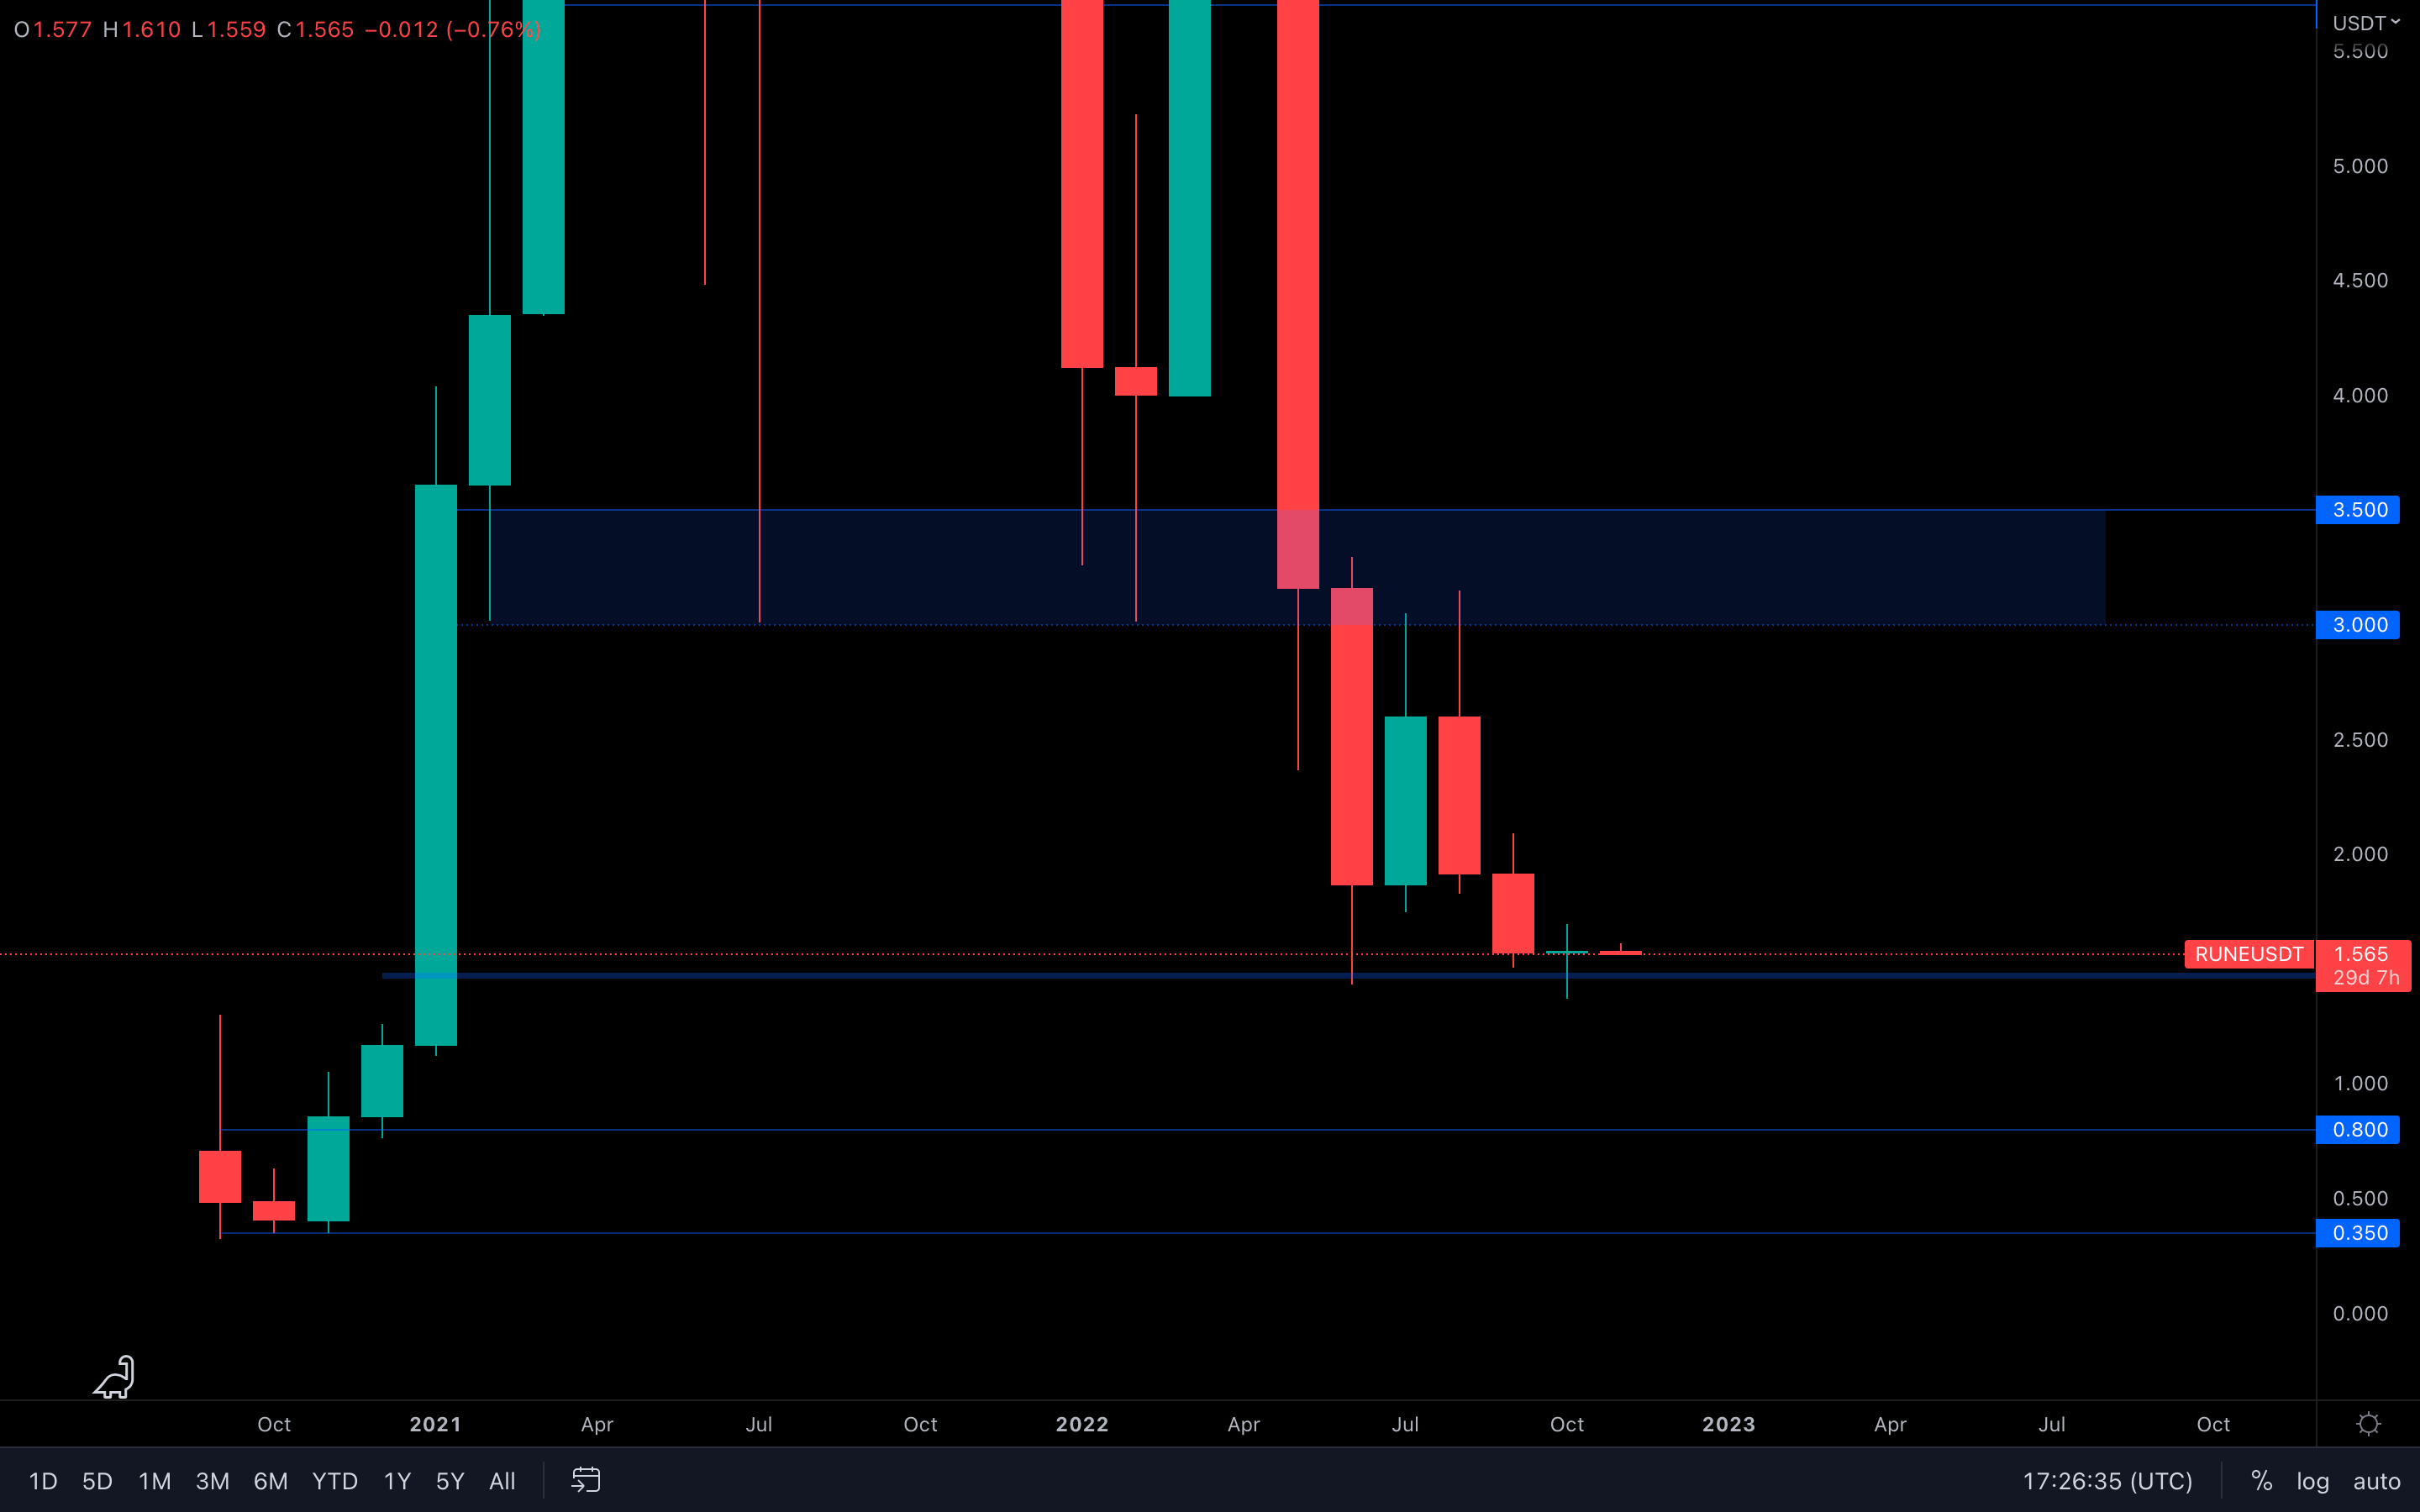 With the asset still above its $1.50 monthly support level, RUNE is not looking ready to drop under that level yet. In fact, bottoming-like price action is happening right now on the weekly timeframe, which might suggest that RUNE can see a bullish first week in November.
Aiming for $2 as a potential short-term target. As for the entirety of November, we could expect a bullish monthly closure here because the asset still has to lose its $1.50 support for any upside movement to be invalidated.
SOL
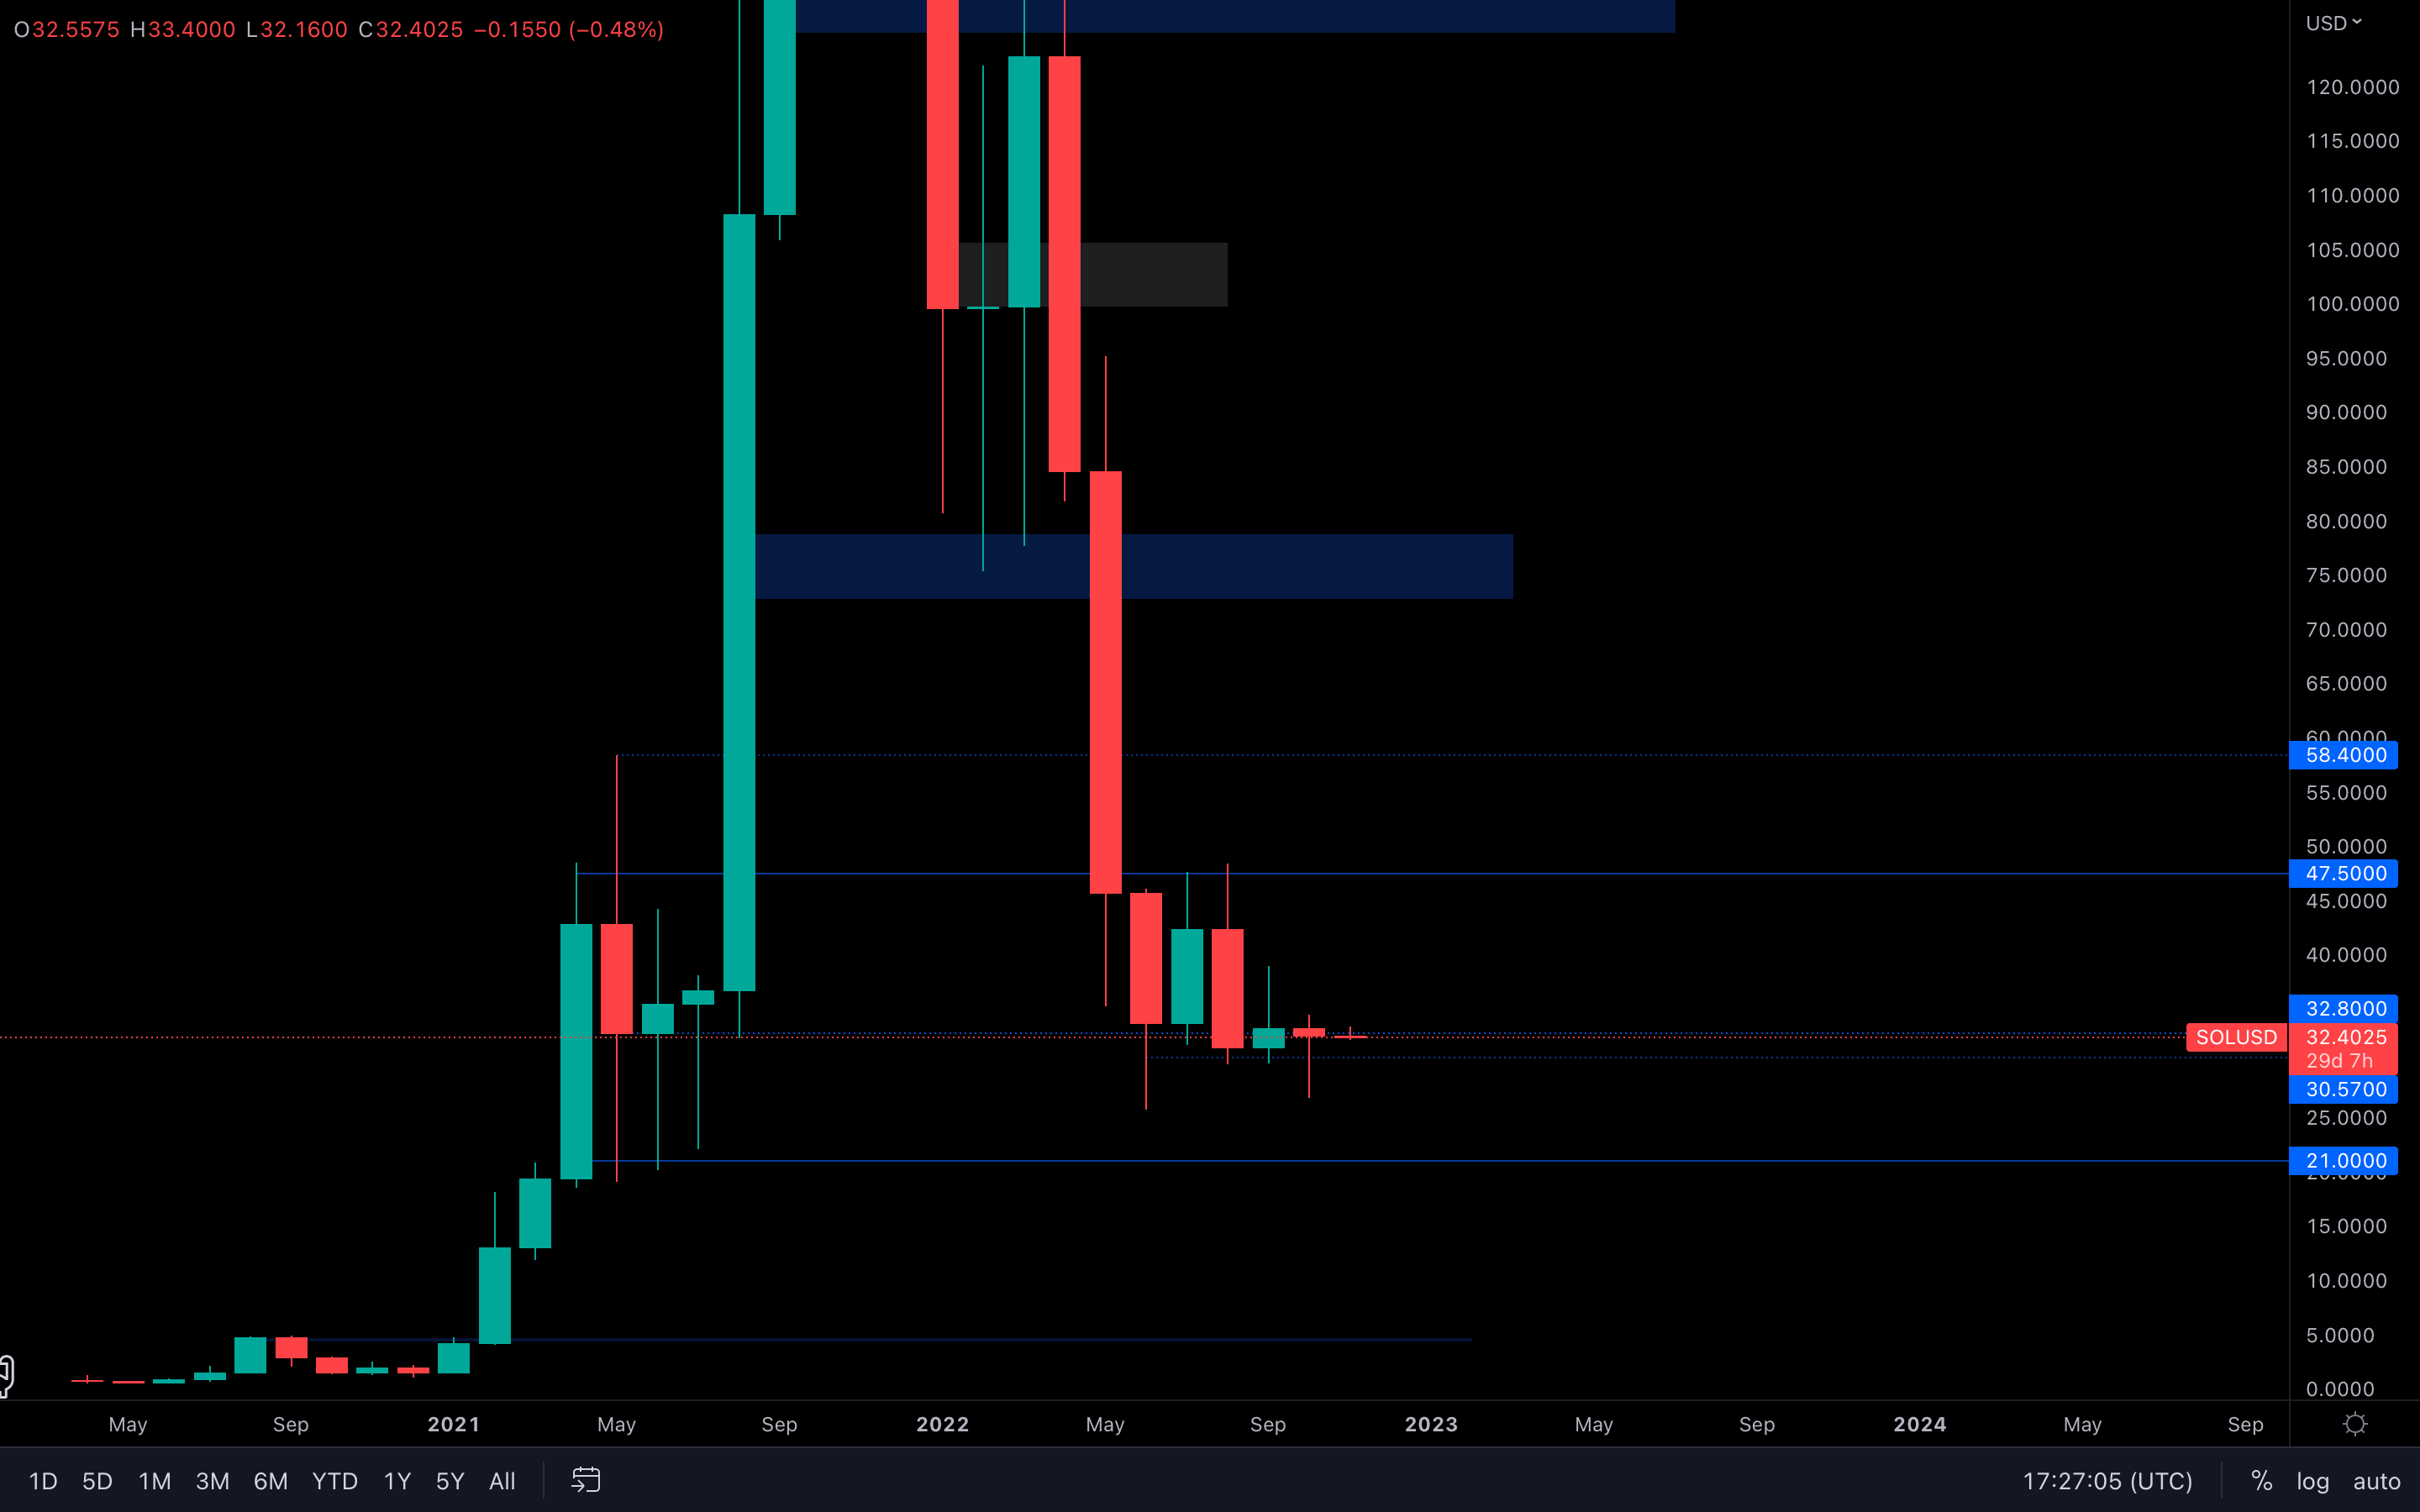 An inverse hammer candlestick forms in September, monthly timeframe. Following that event, a dragonfly Doji candlestick forms in October, also on the monthly timeframe. Both types of candlesticks provide bullish signals, yet we're still waiting for that to occur.
If we stick purely with technicals here, then November should close bullish for SOL. Two bullish monthly candlesticks in a row are not to be ignored.
SRM
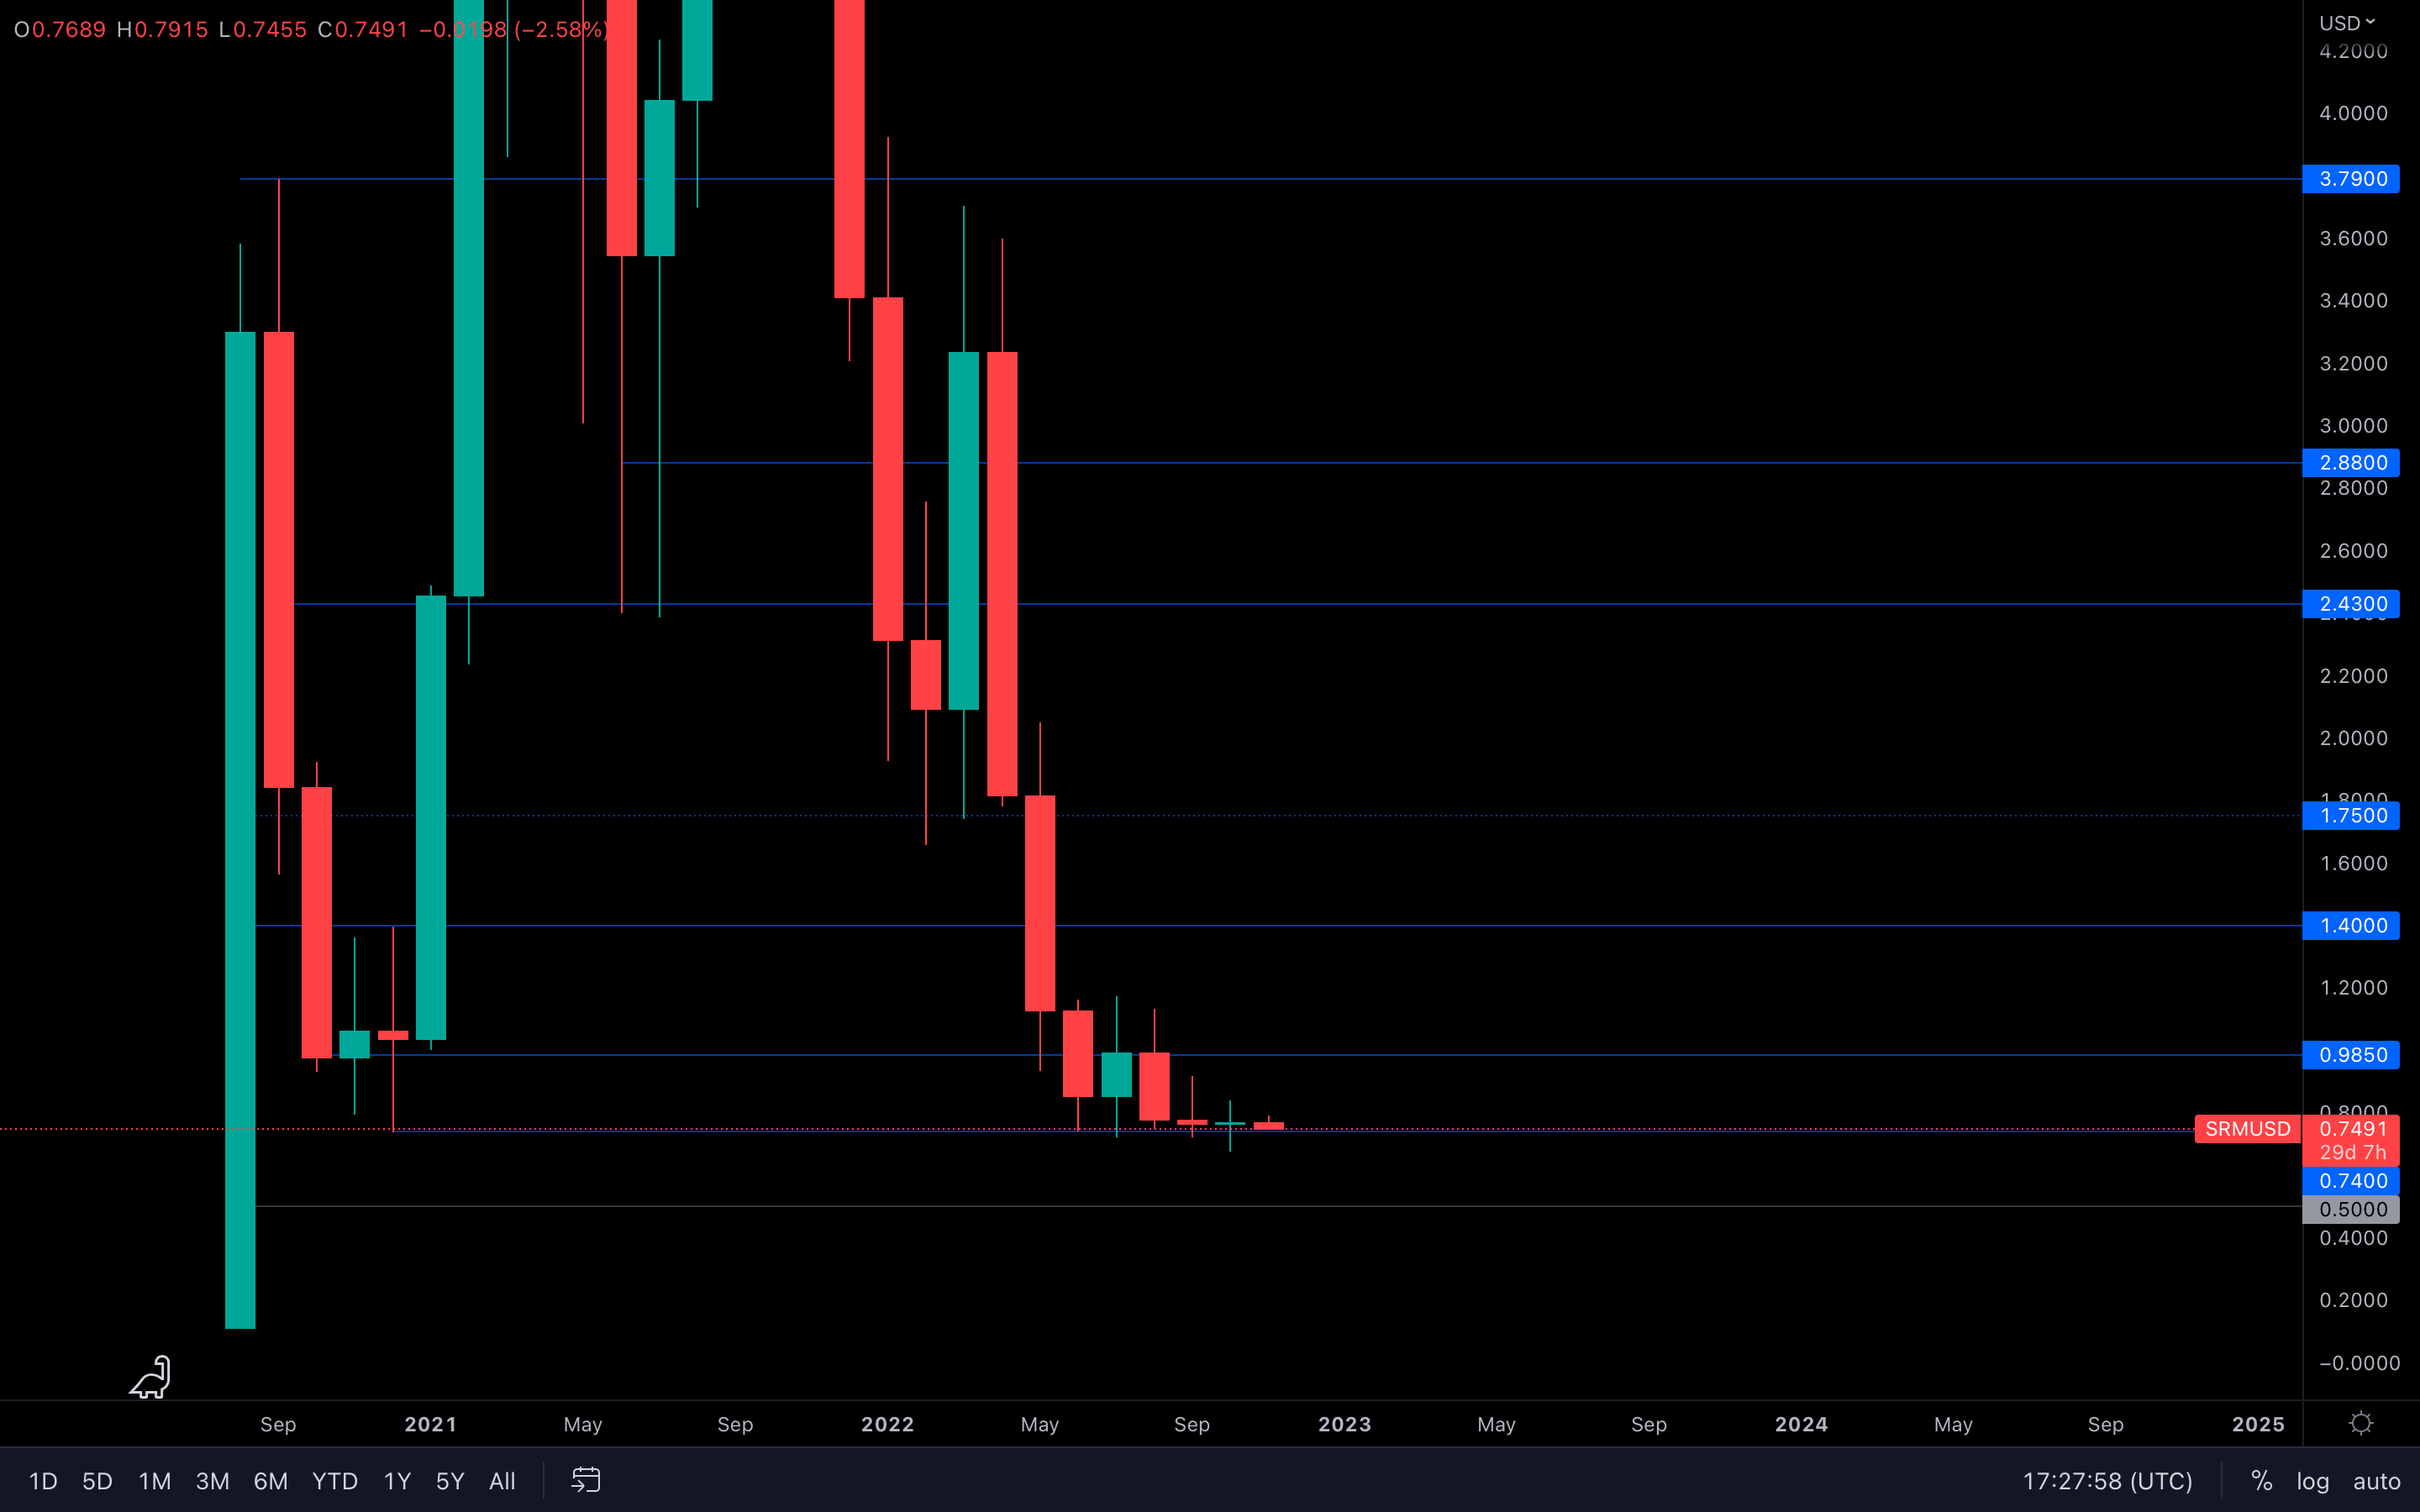 SRM has closed an even lower monthly candle closure than in previous months, indicating sellers have the upper hand. The asset can now be seen at all-time low levels and has been trading above the $0.74 level (all-time low) for the past four months.
The above suggests one thing - buyers are present and have interfered at every all-time low test, holding SRM's price above the respective level. Unless the asset loses the $0.74 level, then higher prices can be expected for October.
FTT
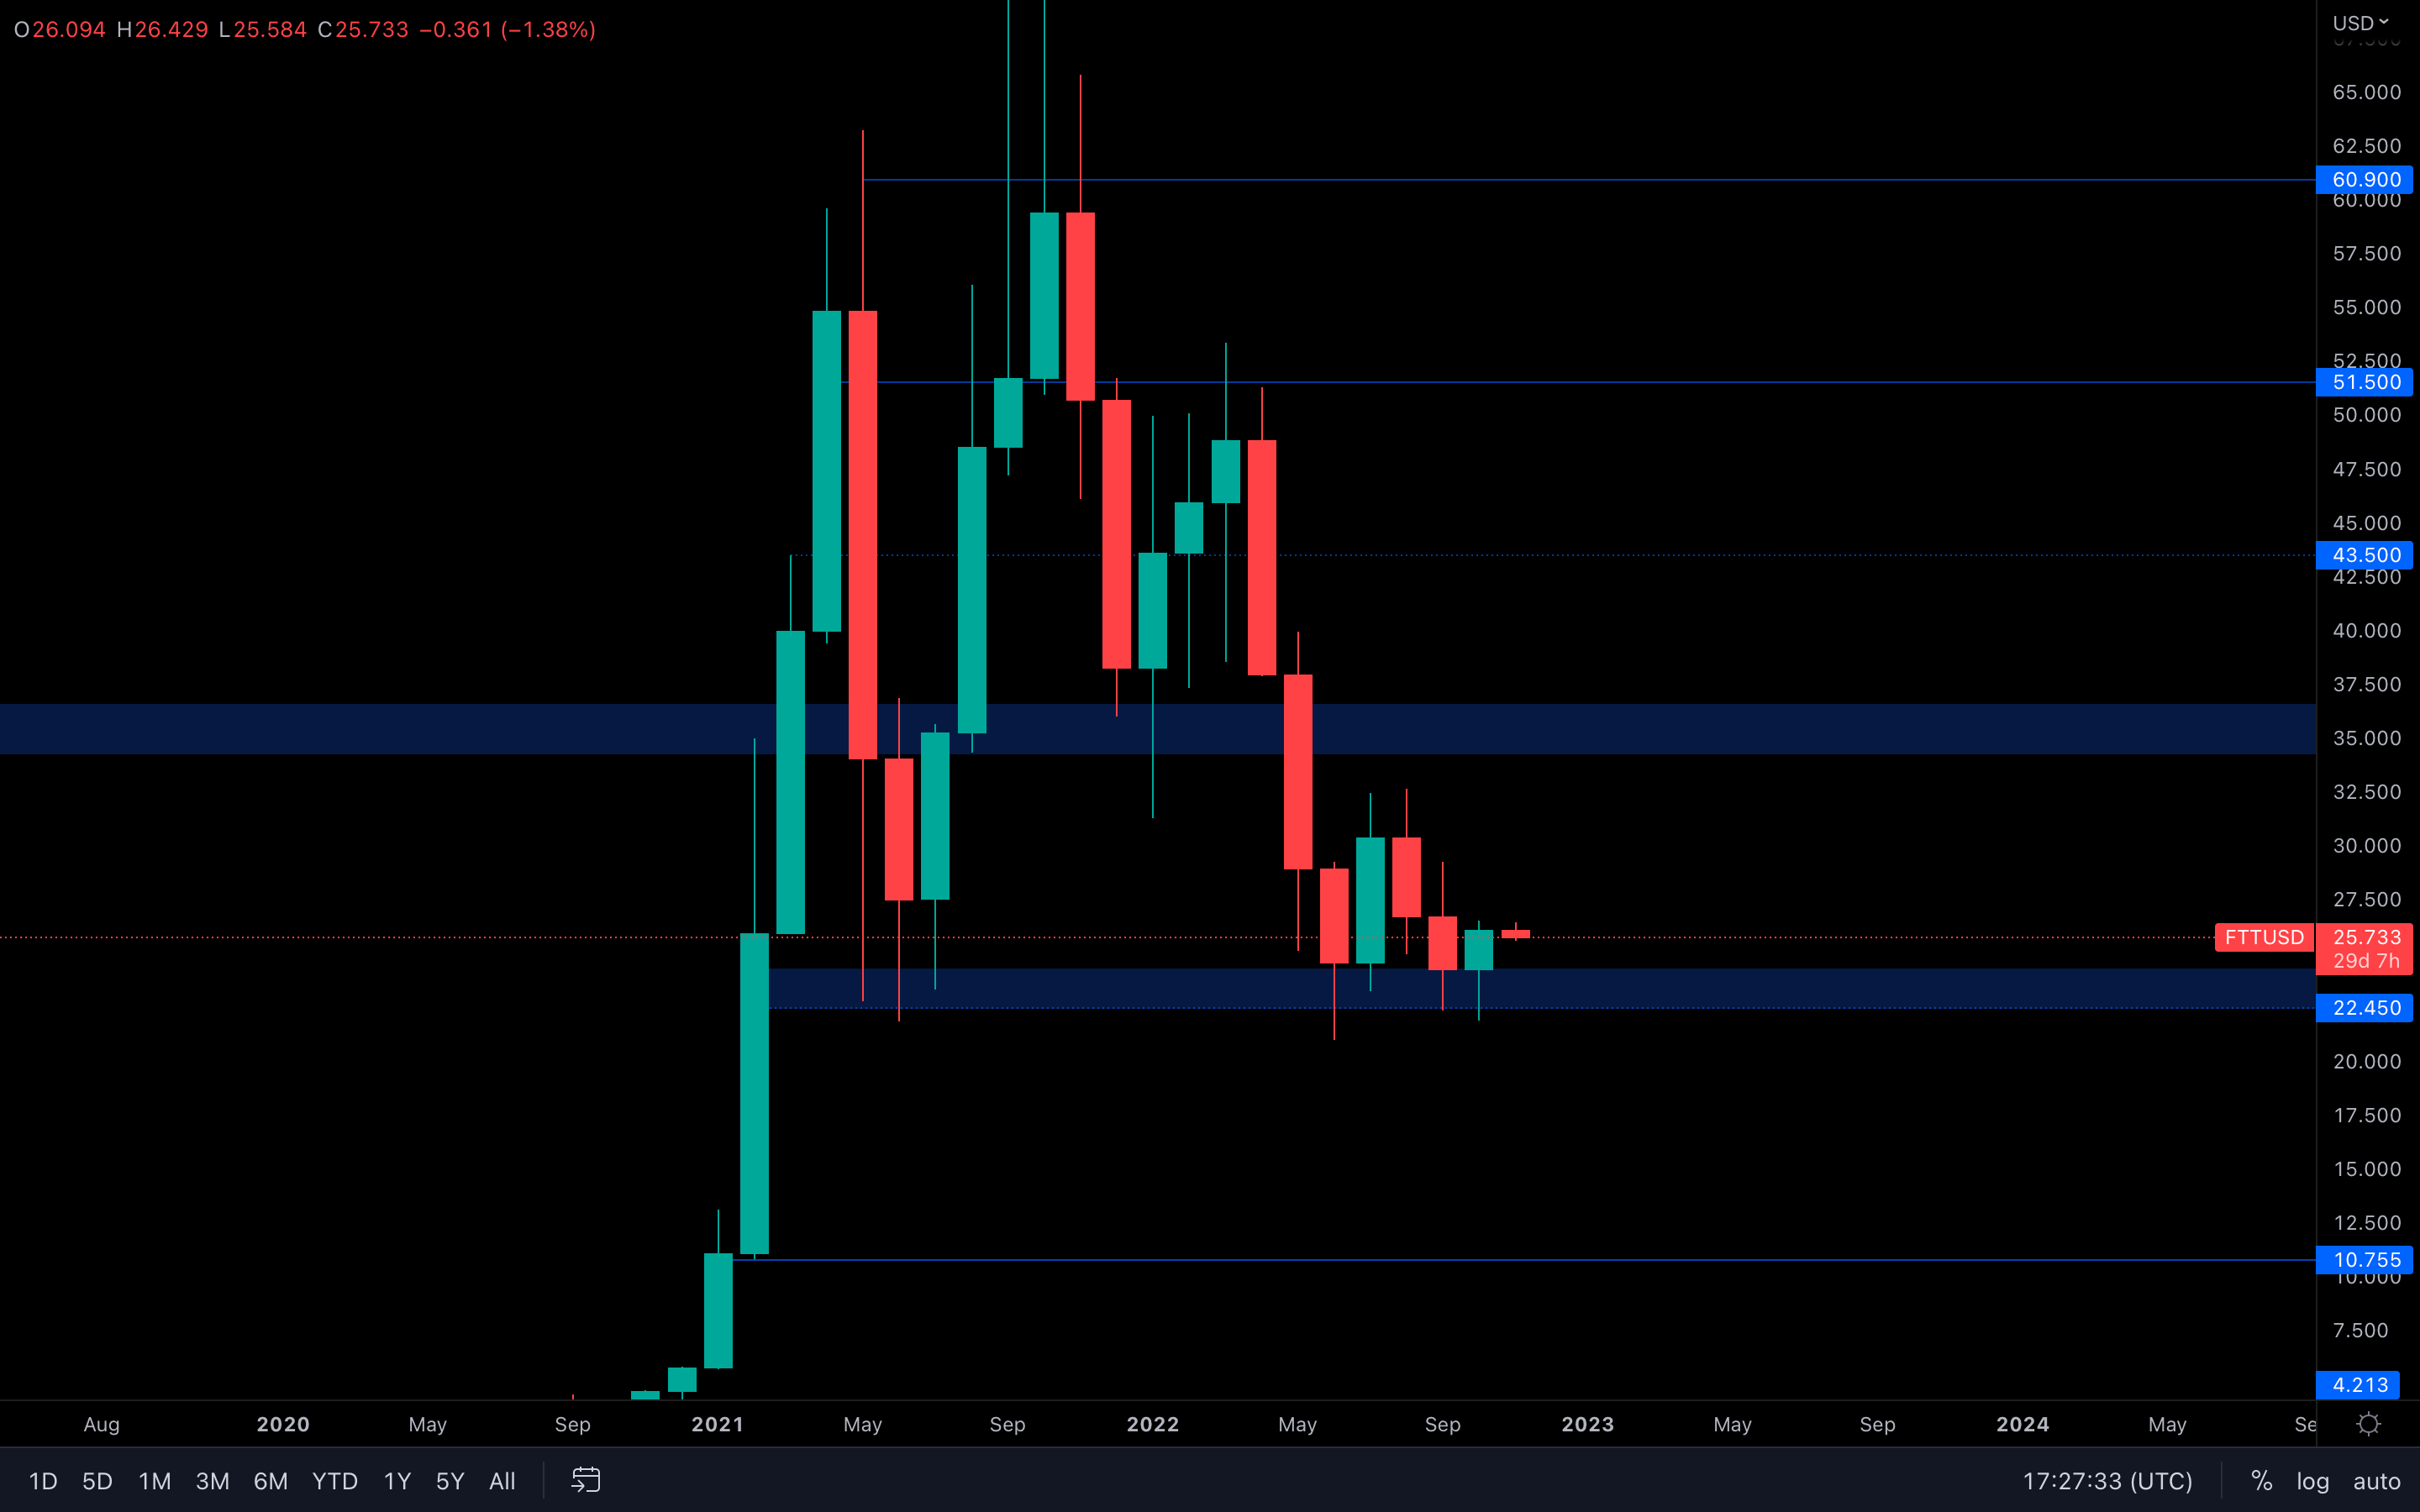 Round of applause for FTT - the one and only asset we've been covering for months that still managed to hold its 2021 bull market support ($22.45 - $24).
However, that makes things even more indecisive than they should be - we know for a fact that when a level is tested too many times, it becomes weaker. But the fact alone that FTT was able to hold itself above $22.45 for that long implies buyers are not planning on giving up control around that level anytime soon.
We could be seeing a slight increase in the first week of November, but other than that, FTT remains in the hands of the big players (BTC & SPX/DXY).
MINA
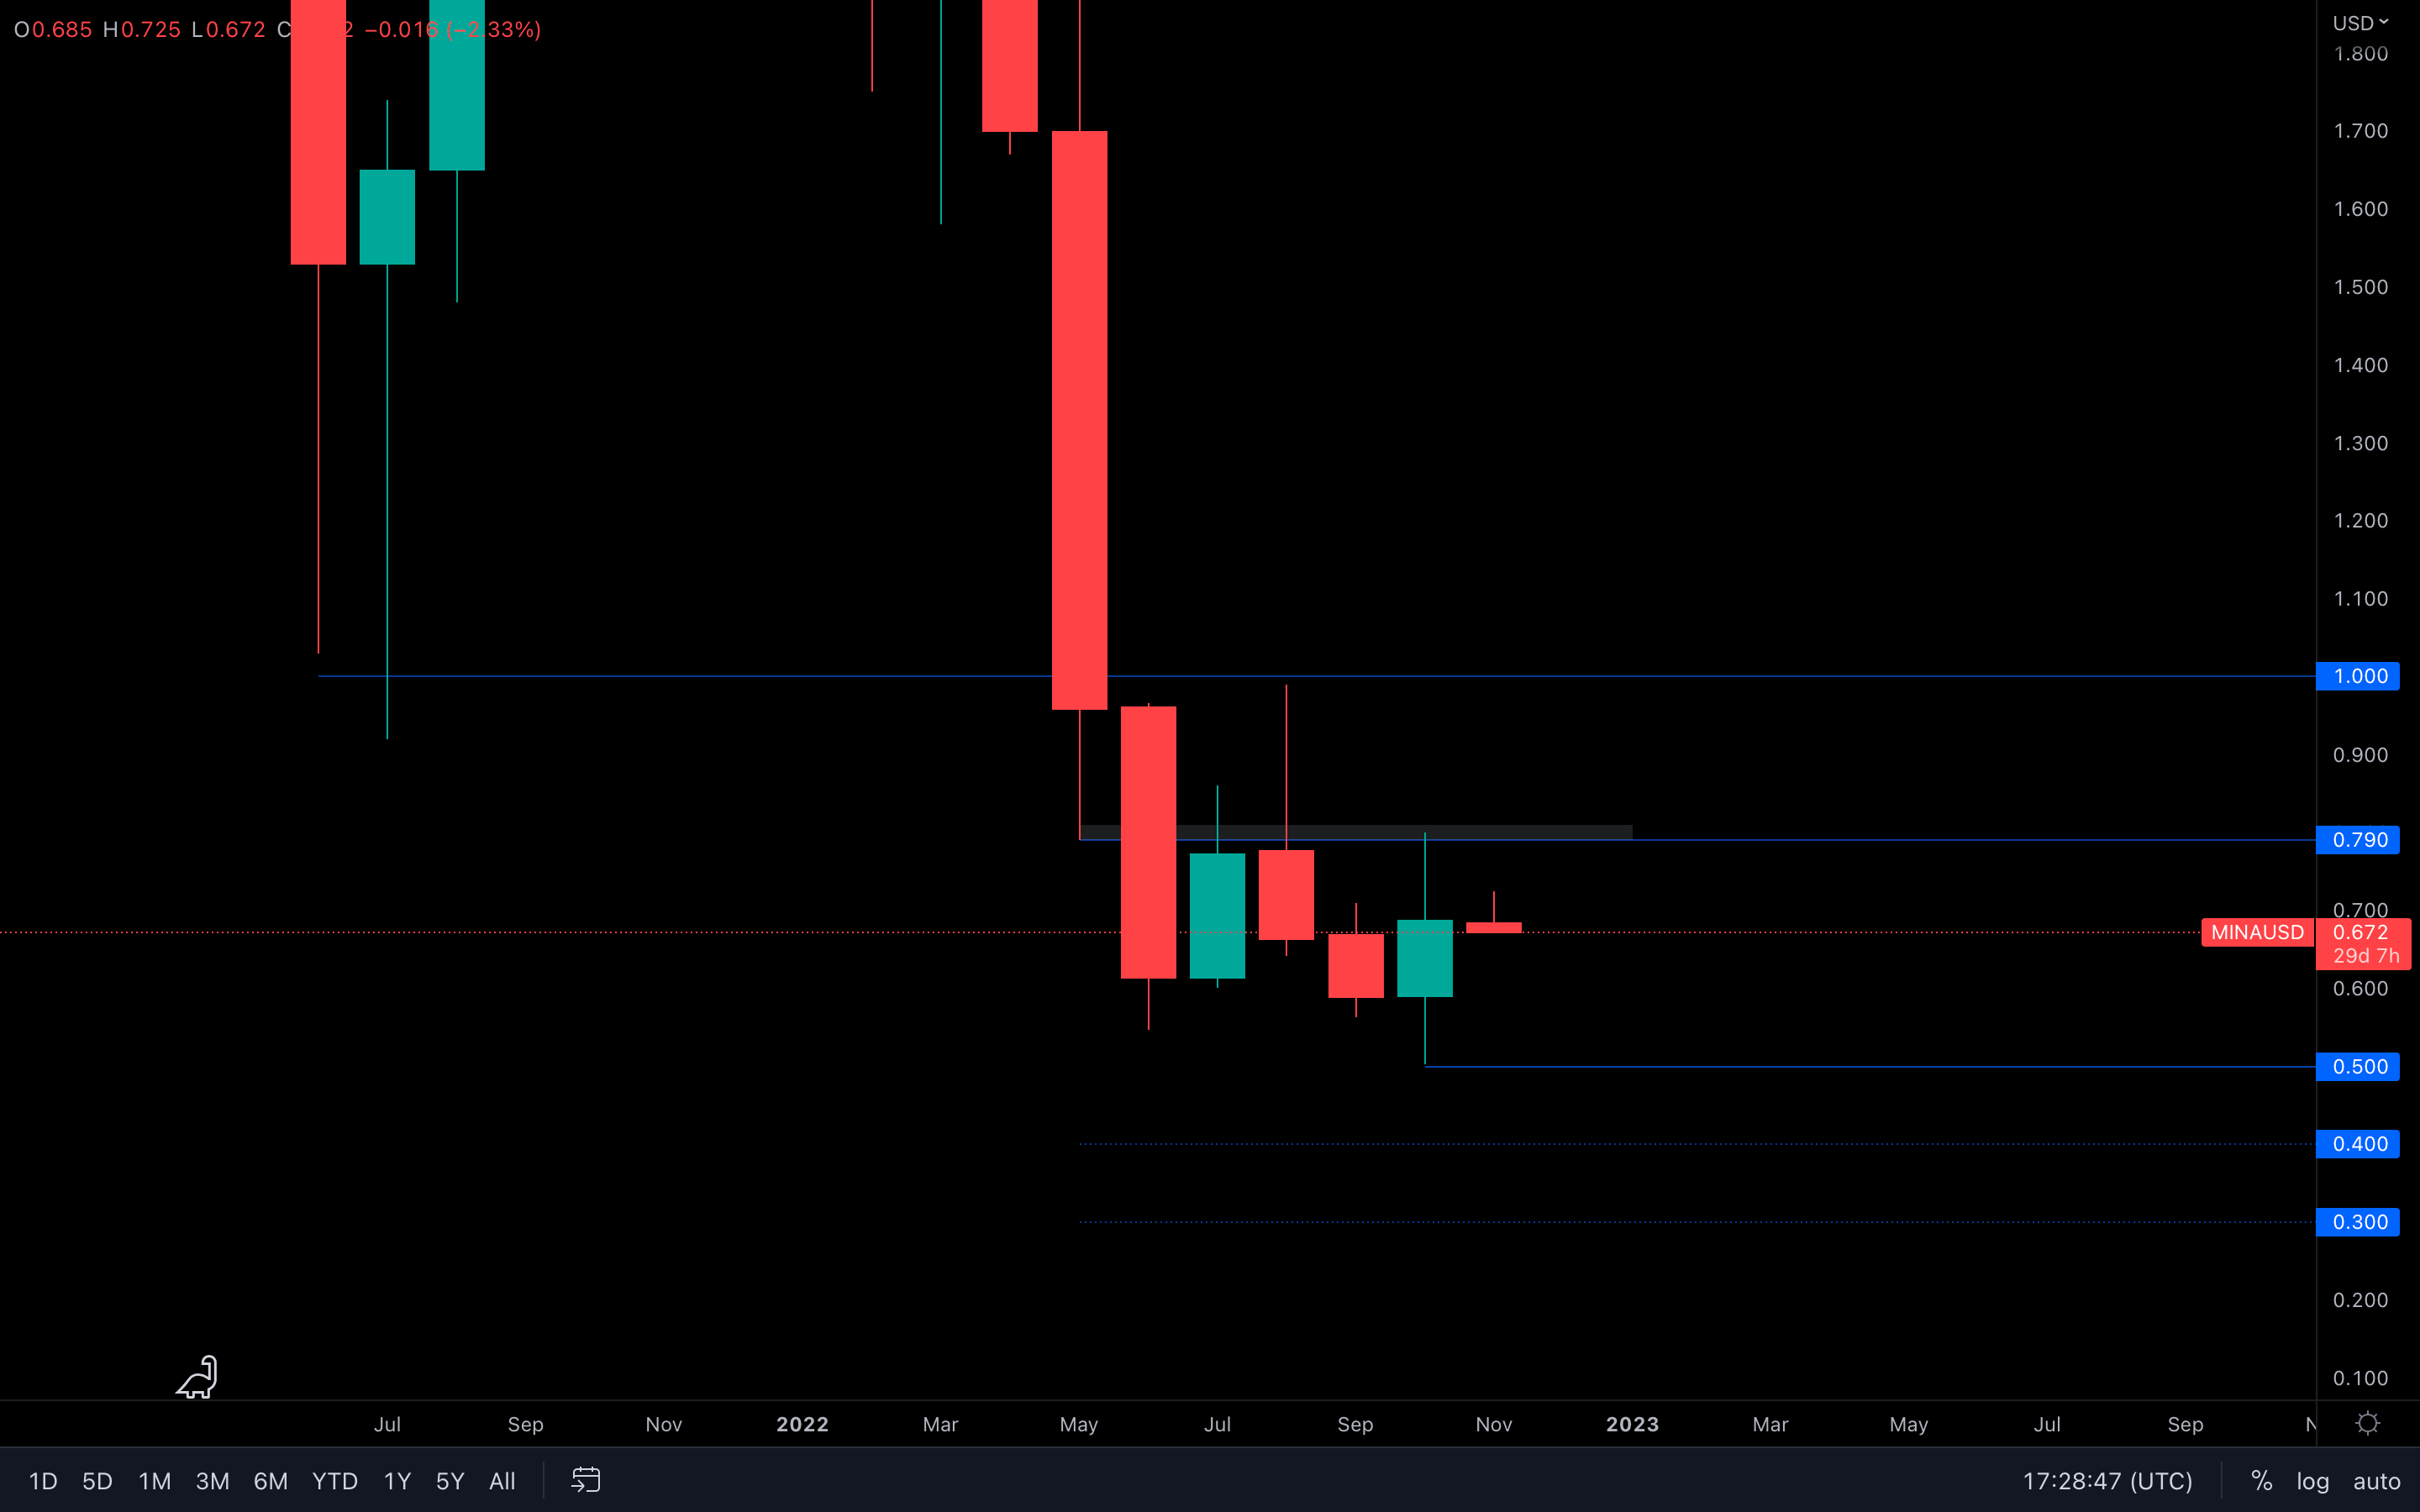 MINA's been boring lately, that's a known statement. However, last month, the asset closed above September's candle open, invalidating the bearish price action from September entirely. We've also seen volatility take over the asset during October, which is perfect for what we deduced from this chart:
Buyers are in control - they invalidated the previous bearish price action from September and are now on a path to $0.79. A break above this level isn't something impossible either, but rather unlikely.
DYDX
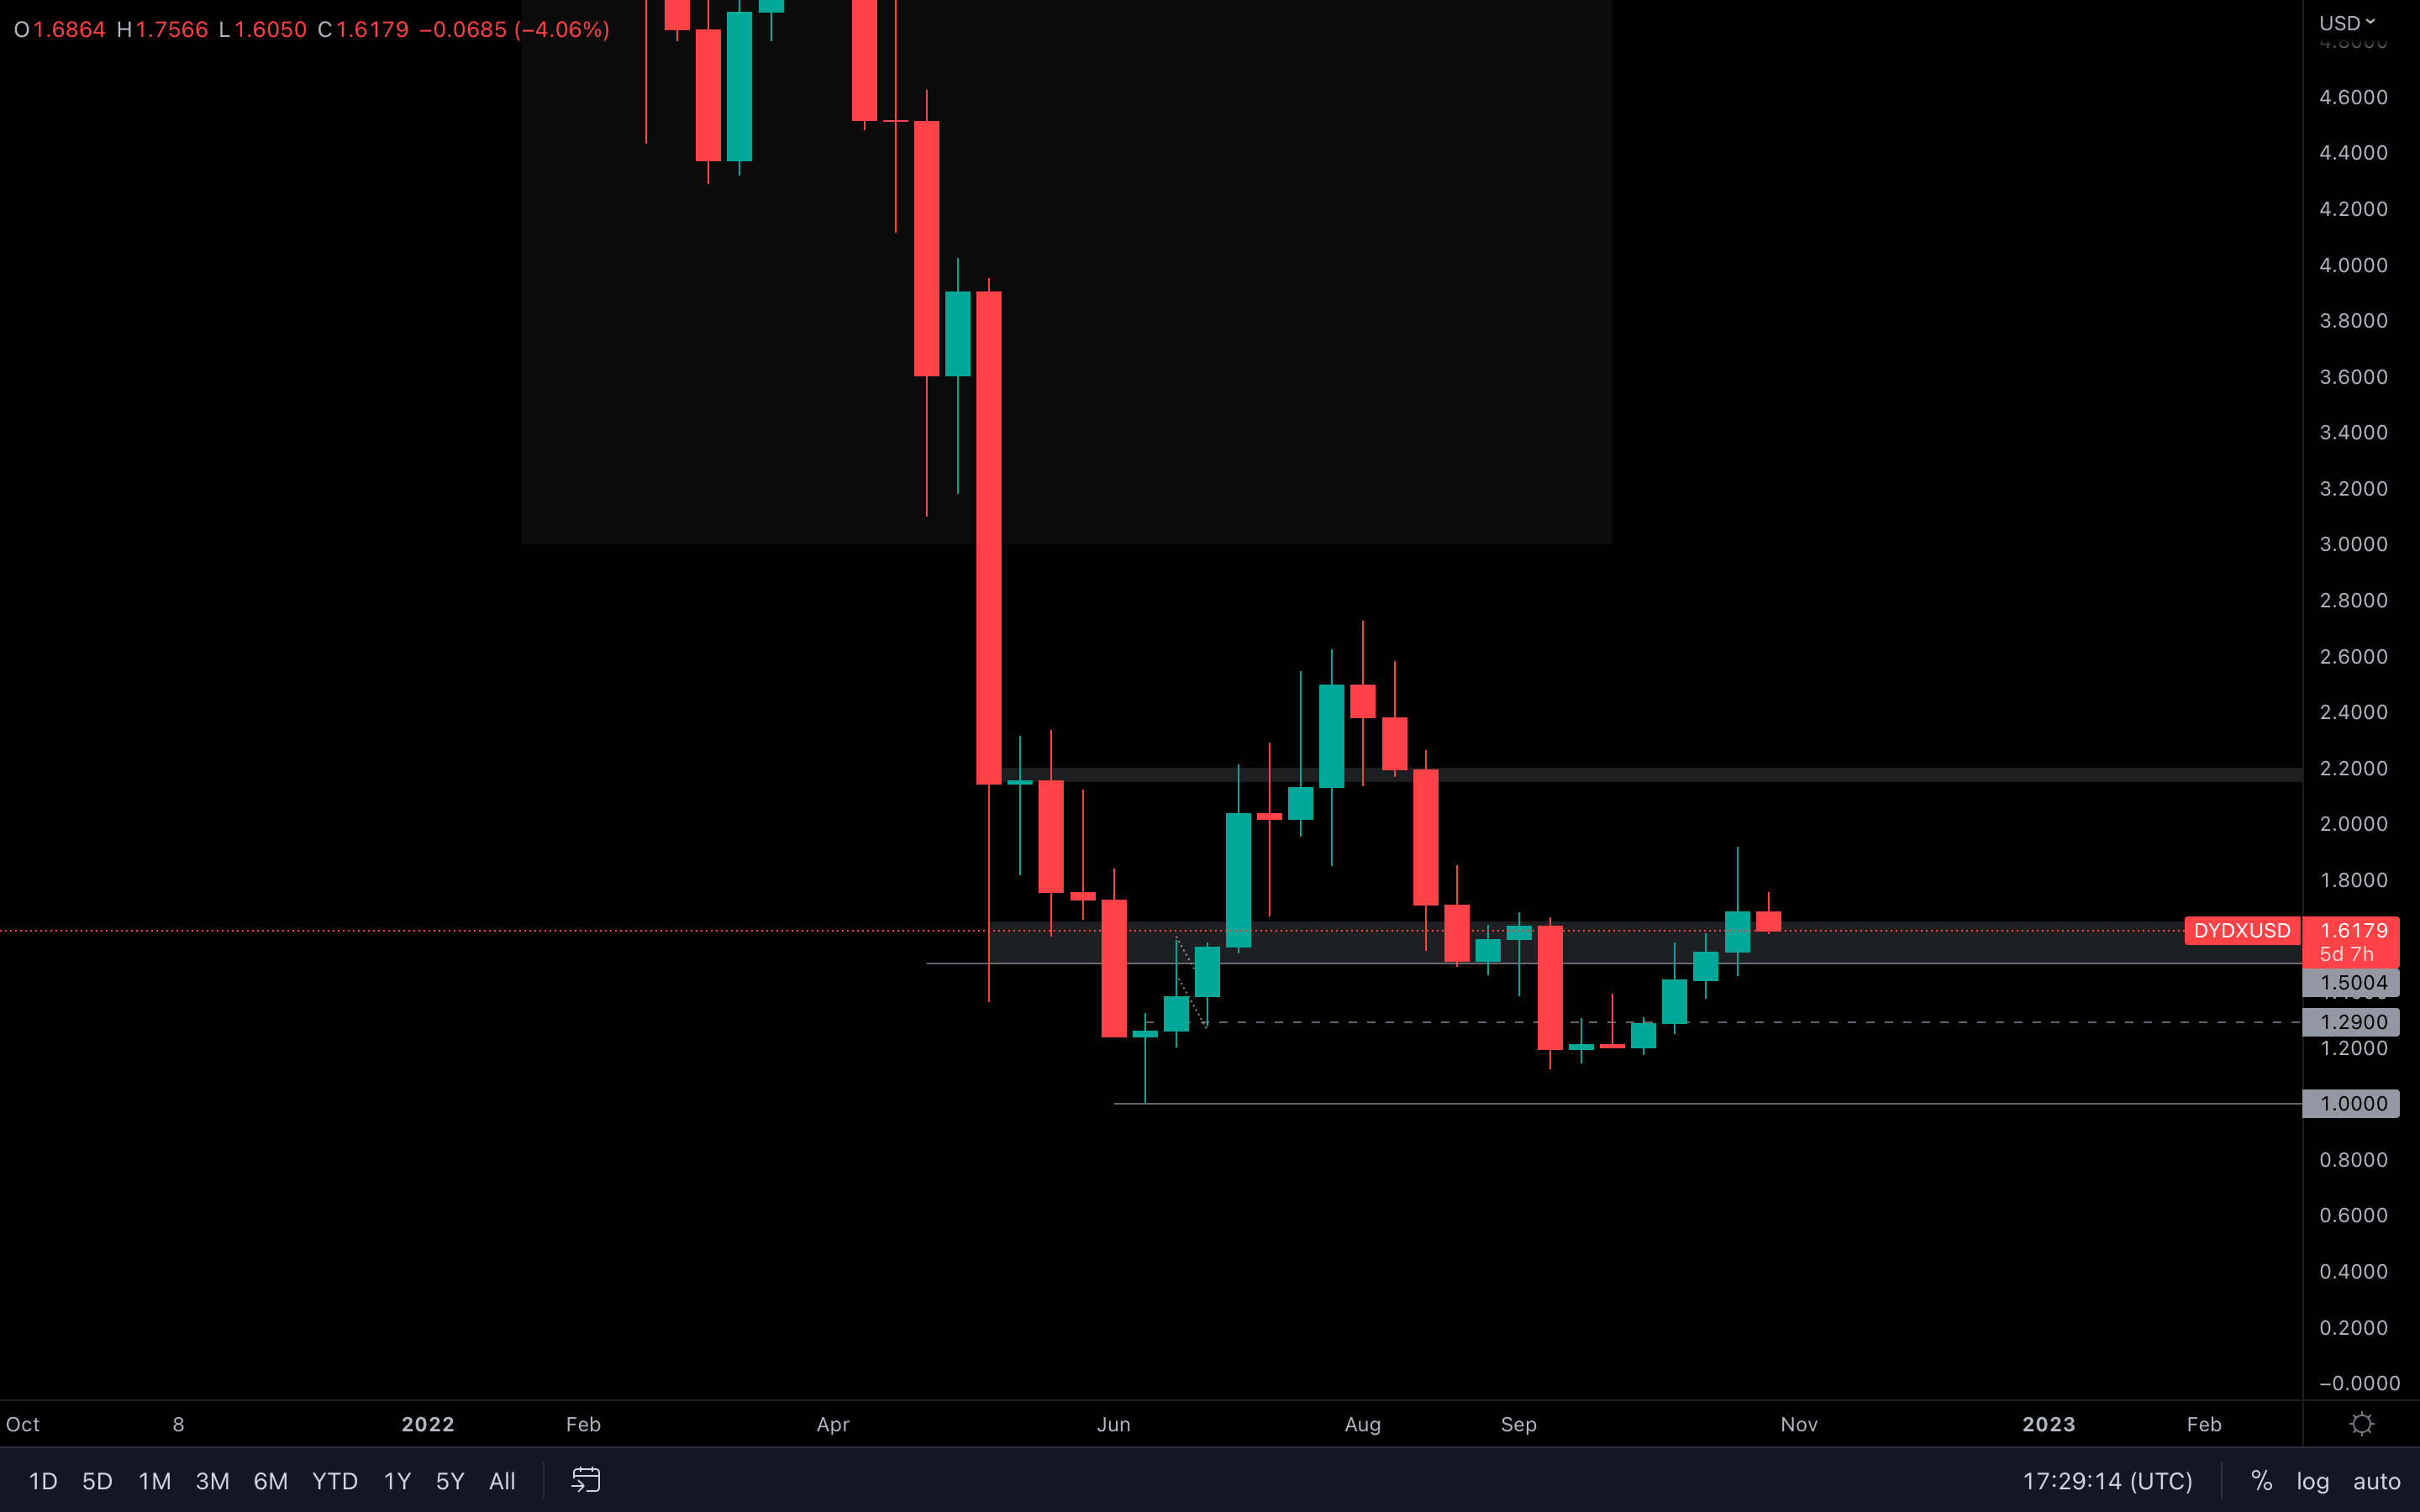 (Weekly chart was used)
dYdX has experienced a ~29% increase in October and has actually closed a bullish engulfing candle on the monthly timeframe. The asset has also closed about its $1.50 - $1.60 prior resistance area on the weekly timeframe, which means $1.50 acts as support now.
(Weekly chart was used)
dYdX has experienced a ~29% increase in October and has actually closed a bullish engulfing candle on the monthly timeframe. The asset has also closed about its $1.50 - $1.60 prior resistance area on the weekly timeframe, which means $1.50 acts as support now.
It might be a bit optimistic to say, but since dYdX has reclaimed $1.50 and even invalidated the previous weekly lower high (registered back in September), then $2.20 can be tested sometime during November.
Summary
Whilst there are a number of macro headwinds on the horizon, we have seen risk appetite improve amongst the largest Bitcoin wallet holders who have looked to increase their exposure. A number of the metrics are showing signs of a bottom formation currently, therefore a $17,000 to $19,000 Bitcoin may be a good zone to begin DCA’ing (assuming we get there). However, a flush out below $17,000 can’t be ruled out, even though the odds of this happening have decreased slightly in recent weeks.Recommended from Cryptonary


