Save 23% ($351) & Get a Free 1-1 Call with our Team ⏰ : 0d 2h 59m 43s

Disclaimer: Not financial nor investment advice. You are responsible for any capital-related decisions you make, and only you are accountable for the results.
Summary for September ’22
- Total Market Cap – -5.17%
- Altcoins Market Cap – -6.92%
TLDR
- The Exchange Net Position Change shows that Bitcoin may see a potential flush out in price after a large number of coins inflowed to Exchanges.
- The MVRV Z-Score is showing that both Bitcoin and Ether are currently in “value territories” that may represent good long-term buying opportunities.
Total Market Cap
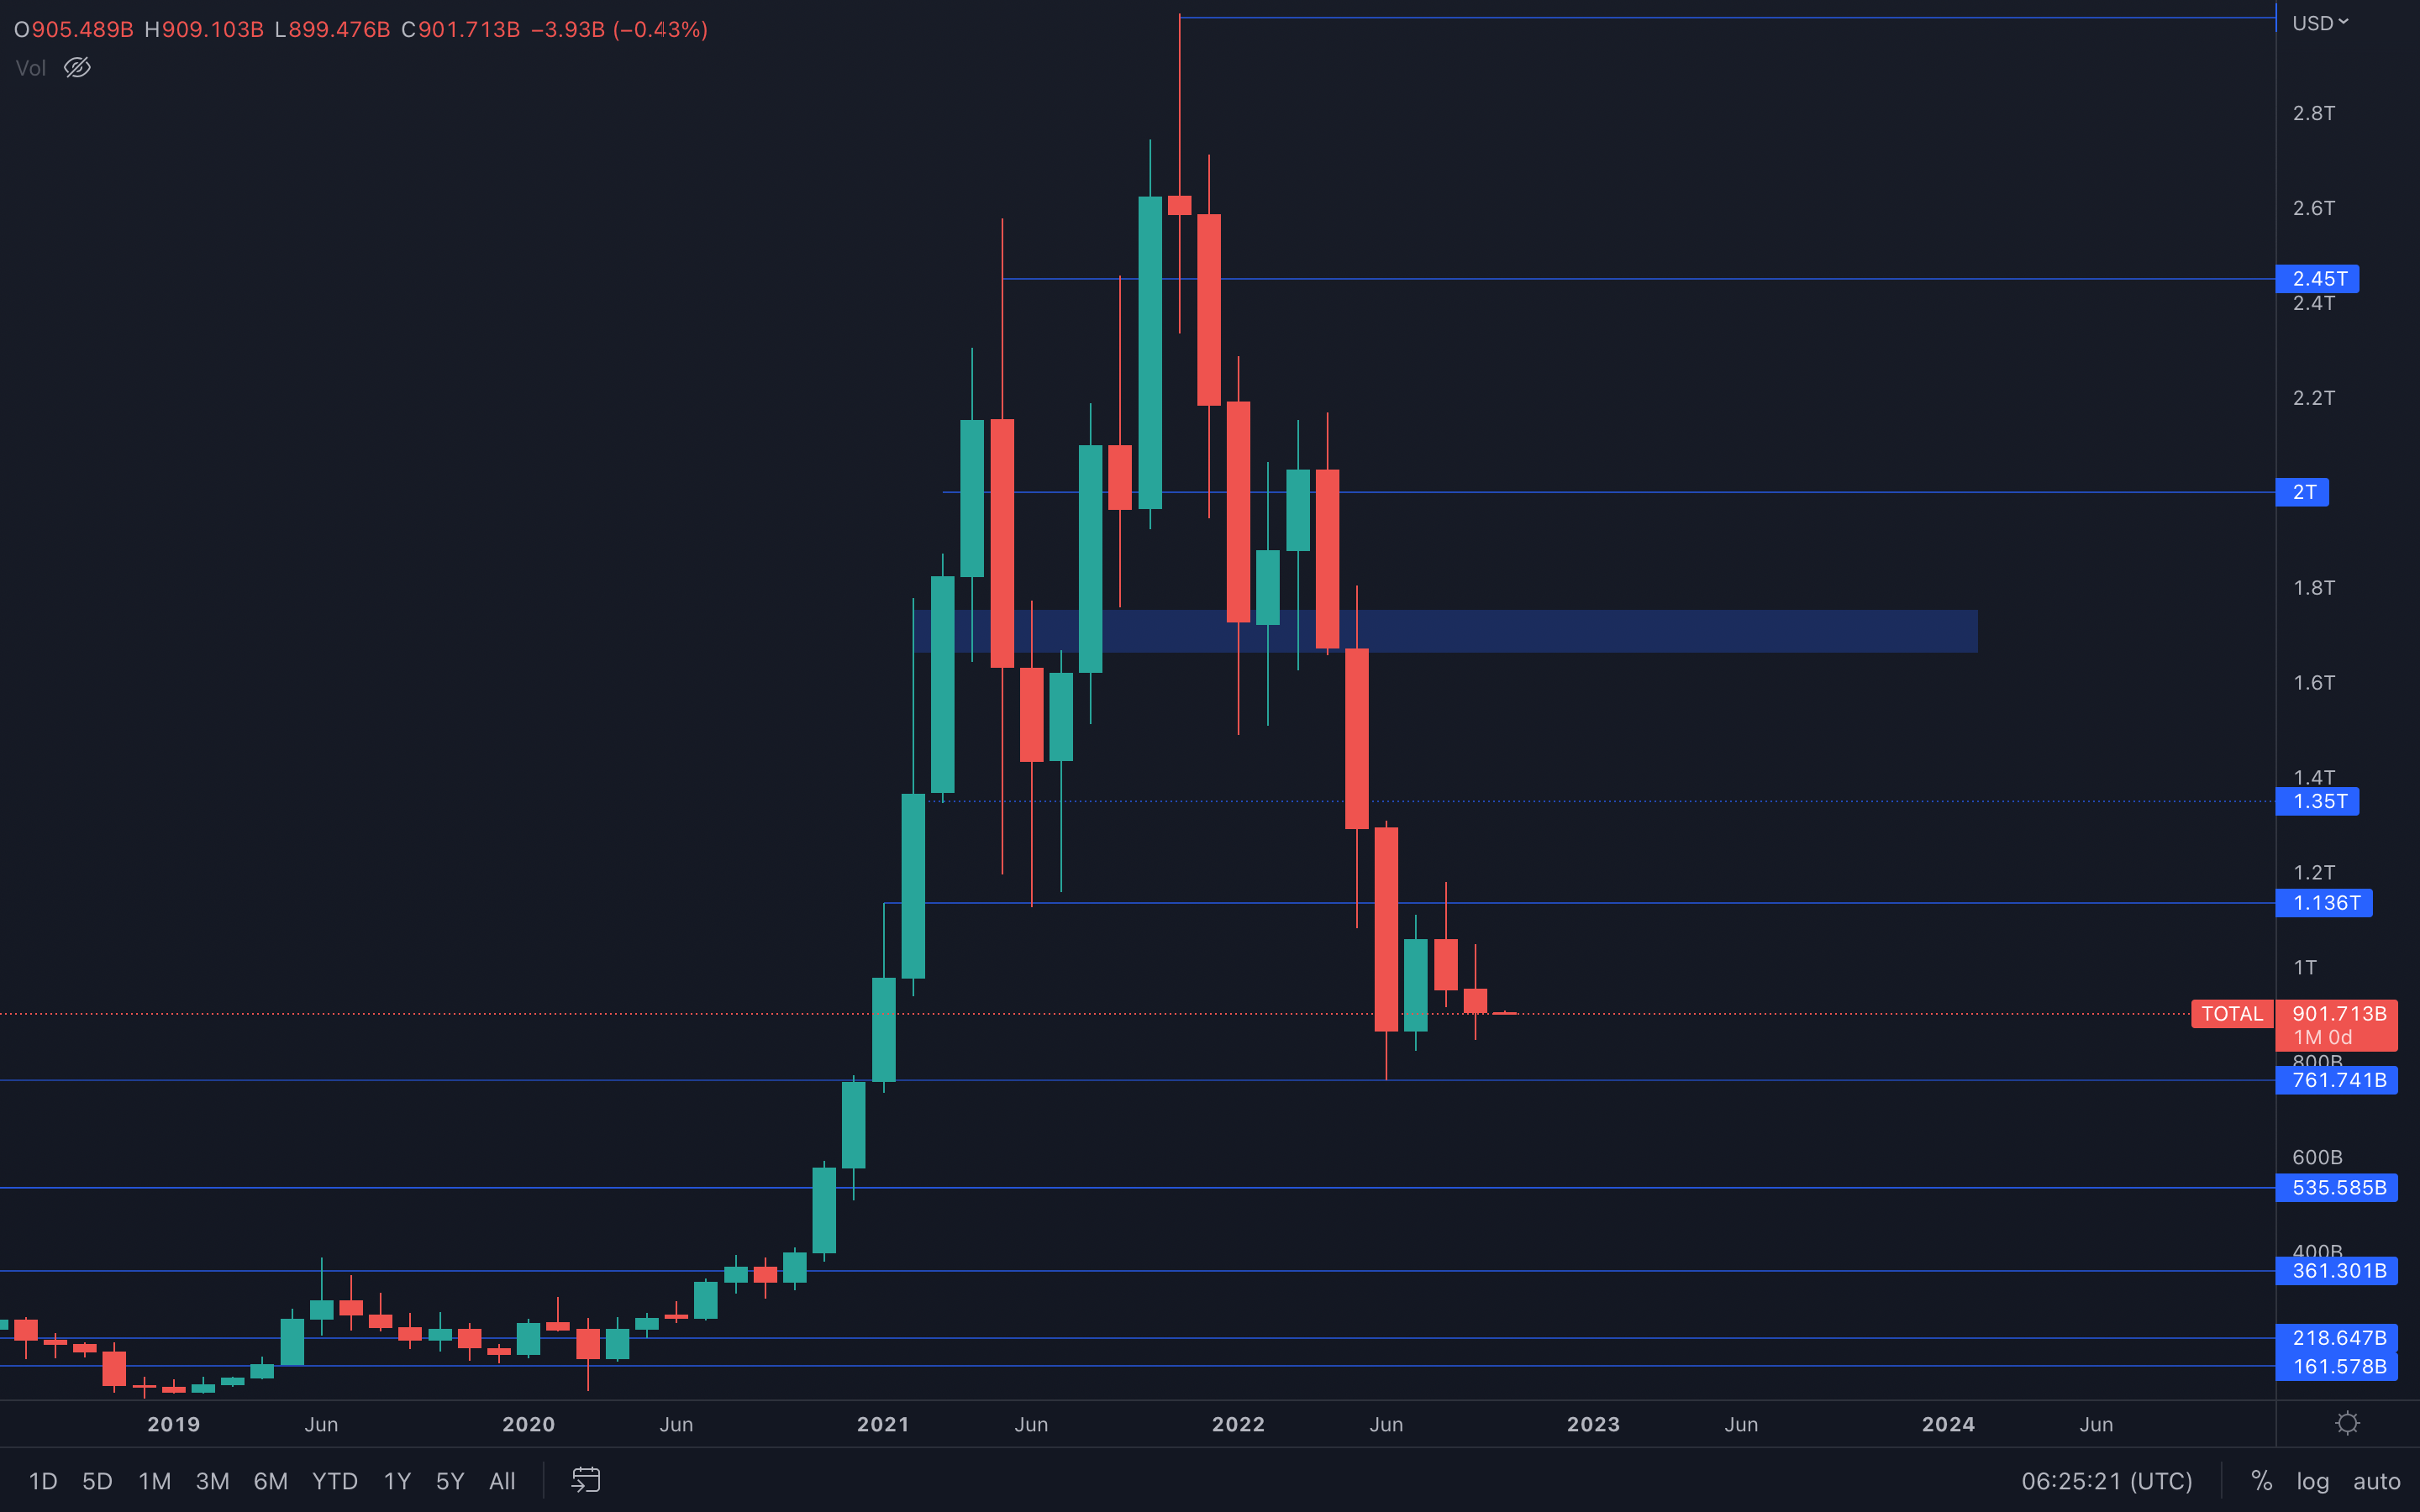 It seems we have another bearish September on our hands, keeping the yearly tradition intact. However, last month was quite silent compared to previous months, there wasn't much volume present which might suggest a bit of indecisiveness - or does it?
Deducing where the price of the Total MCap index will head toward is left to a simple statement - after a monthly loss & rejection from the $1.136T level, the index is now on a path to its closest support level, sitting at $761B.
Another small thing to mention is that October has seen bullish momentum over the years and has typically been a bullish month overall. The following question remains - is this bias strong enough to remain intact, or will buyers be unable to move prices higher due to their minuscule pressure in the markets, closing October bearish?
P.S: I believe October will close bearish.
Altcoins Market Cap
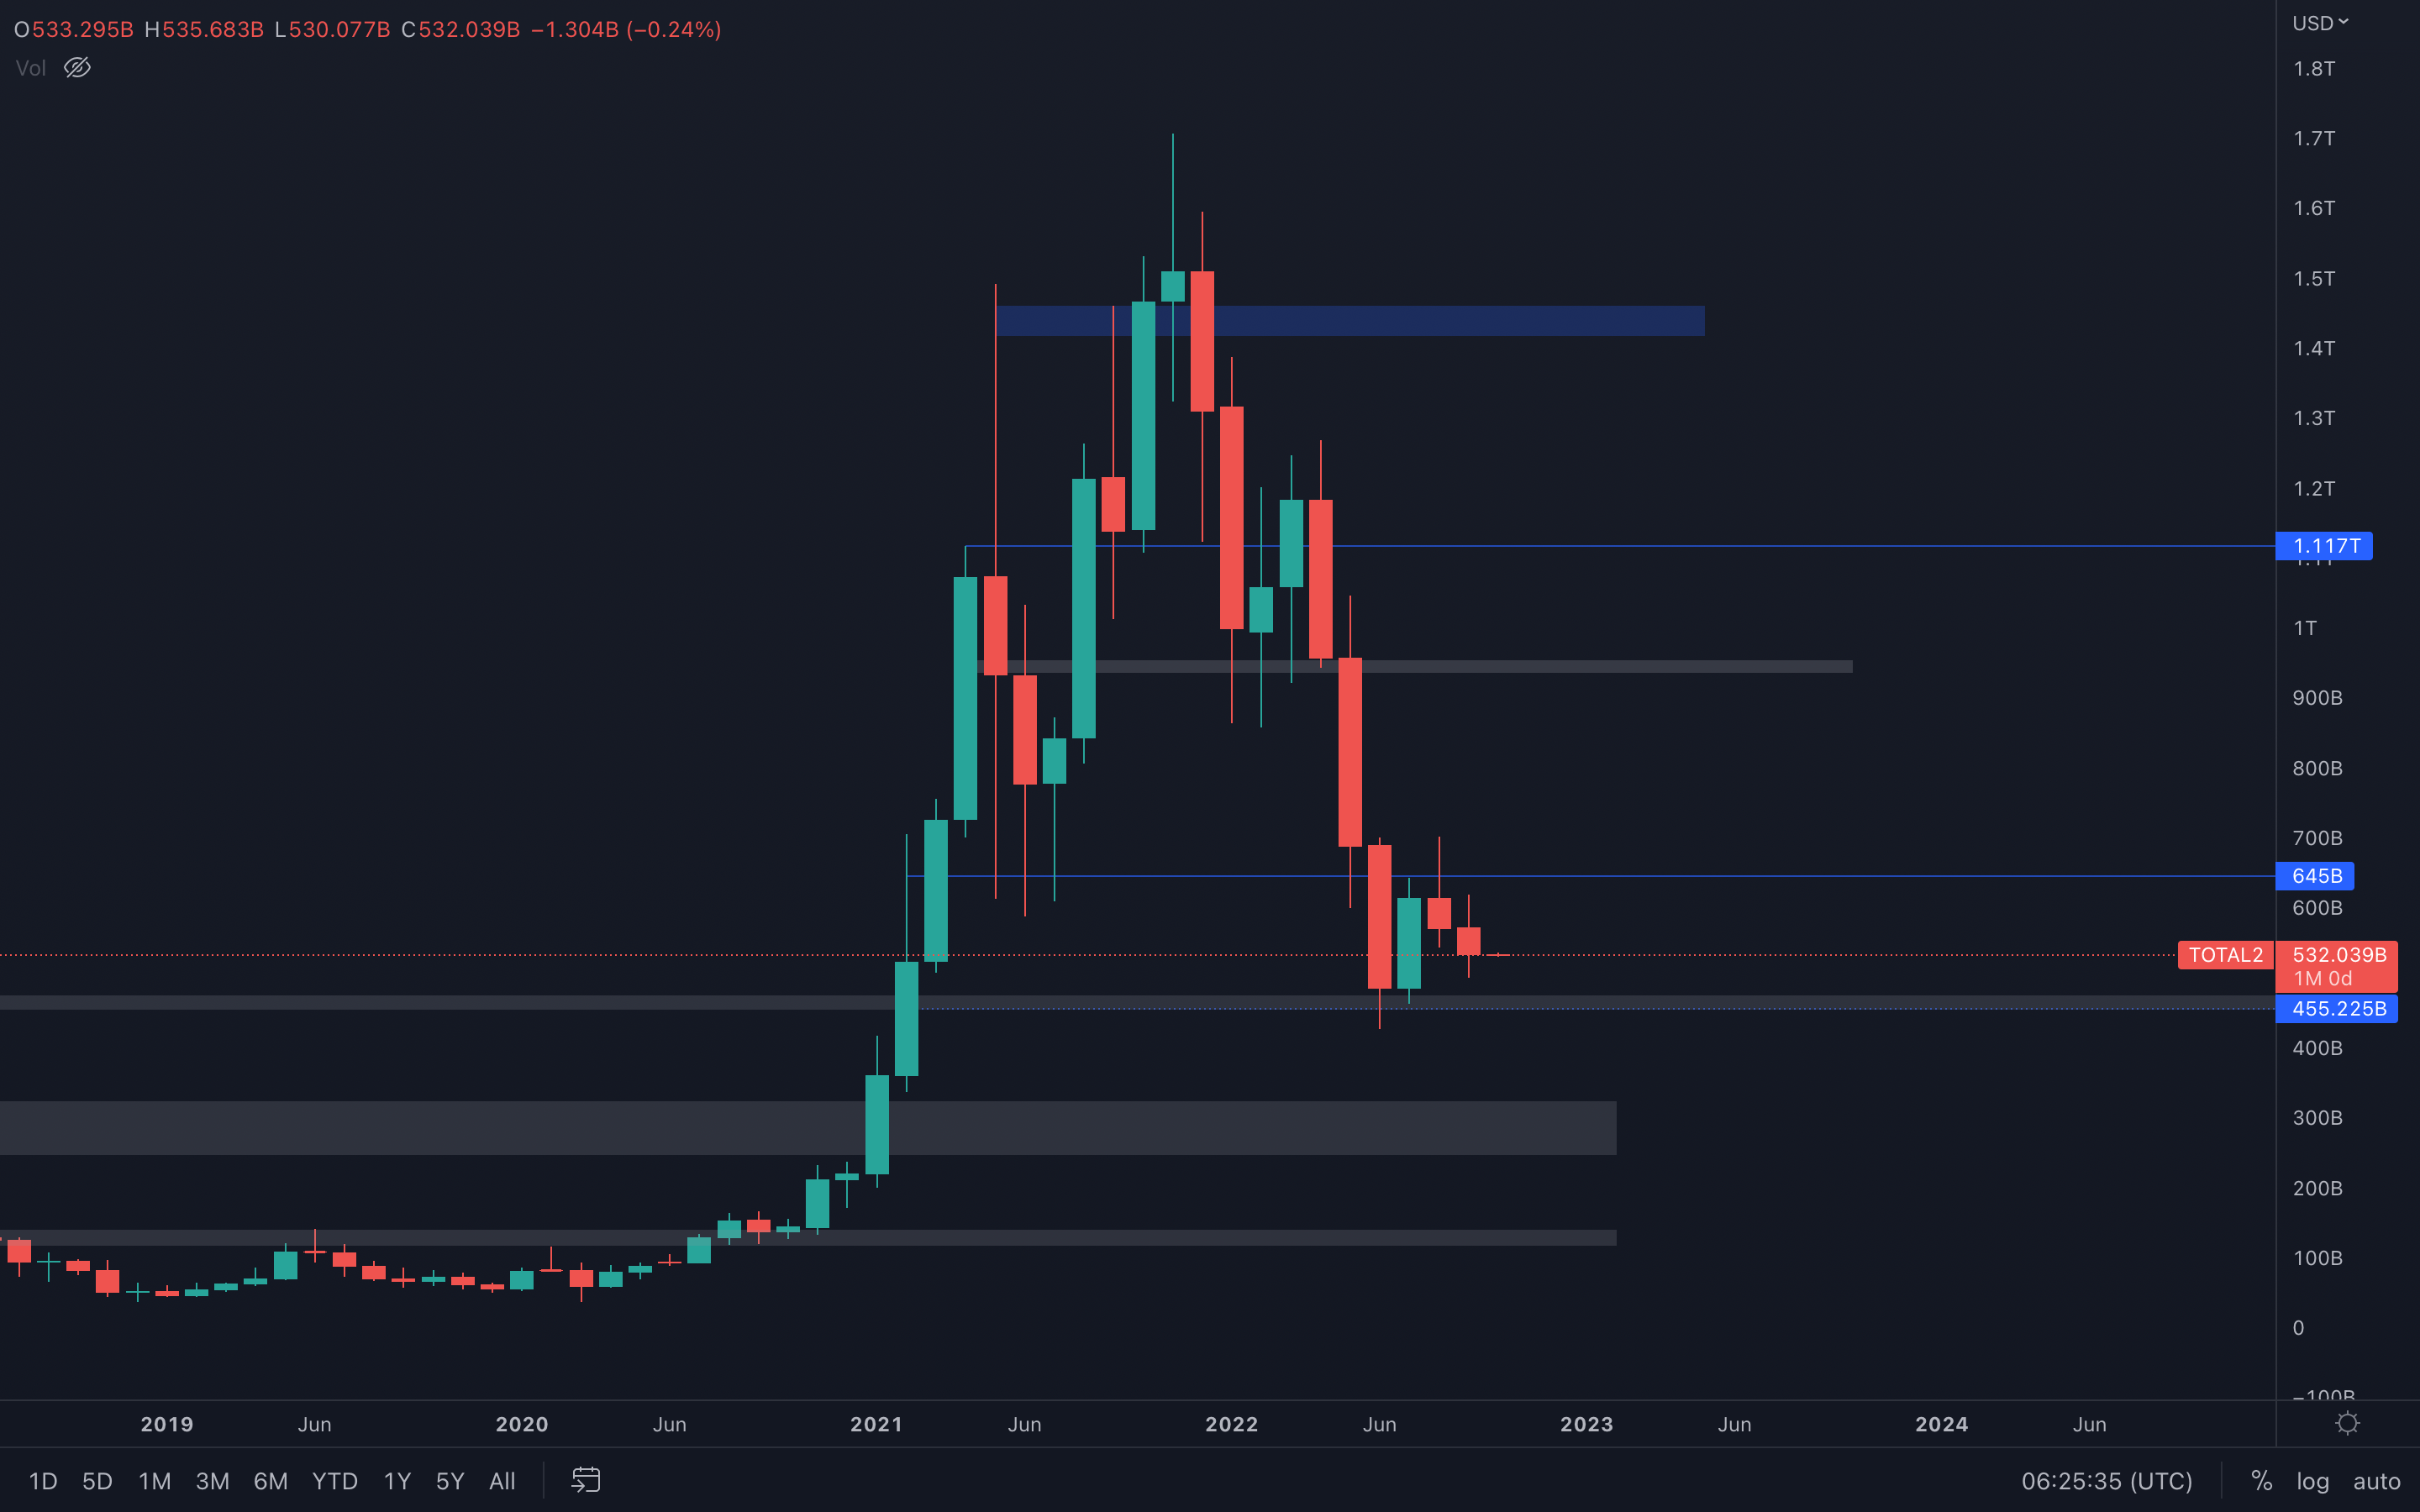 It's like we're looking at the same chart all over again, aren't we?
The similarities between the Altcoins MCap index and the Total MCap index are obvious, which suggests that the same outcome can be expected for the second index - after a loss & rejection from the $645B level, the index is on a path toward its closest support level, sitting at $455B.
Bitcoin - Technical & On-Chain Analysis
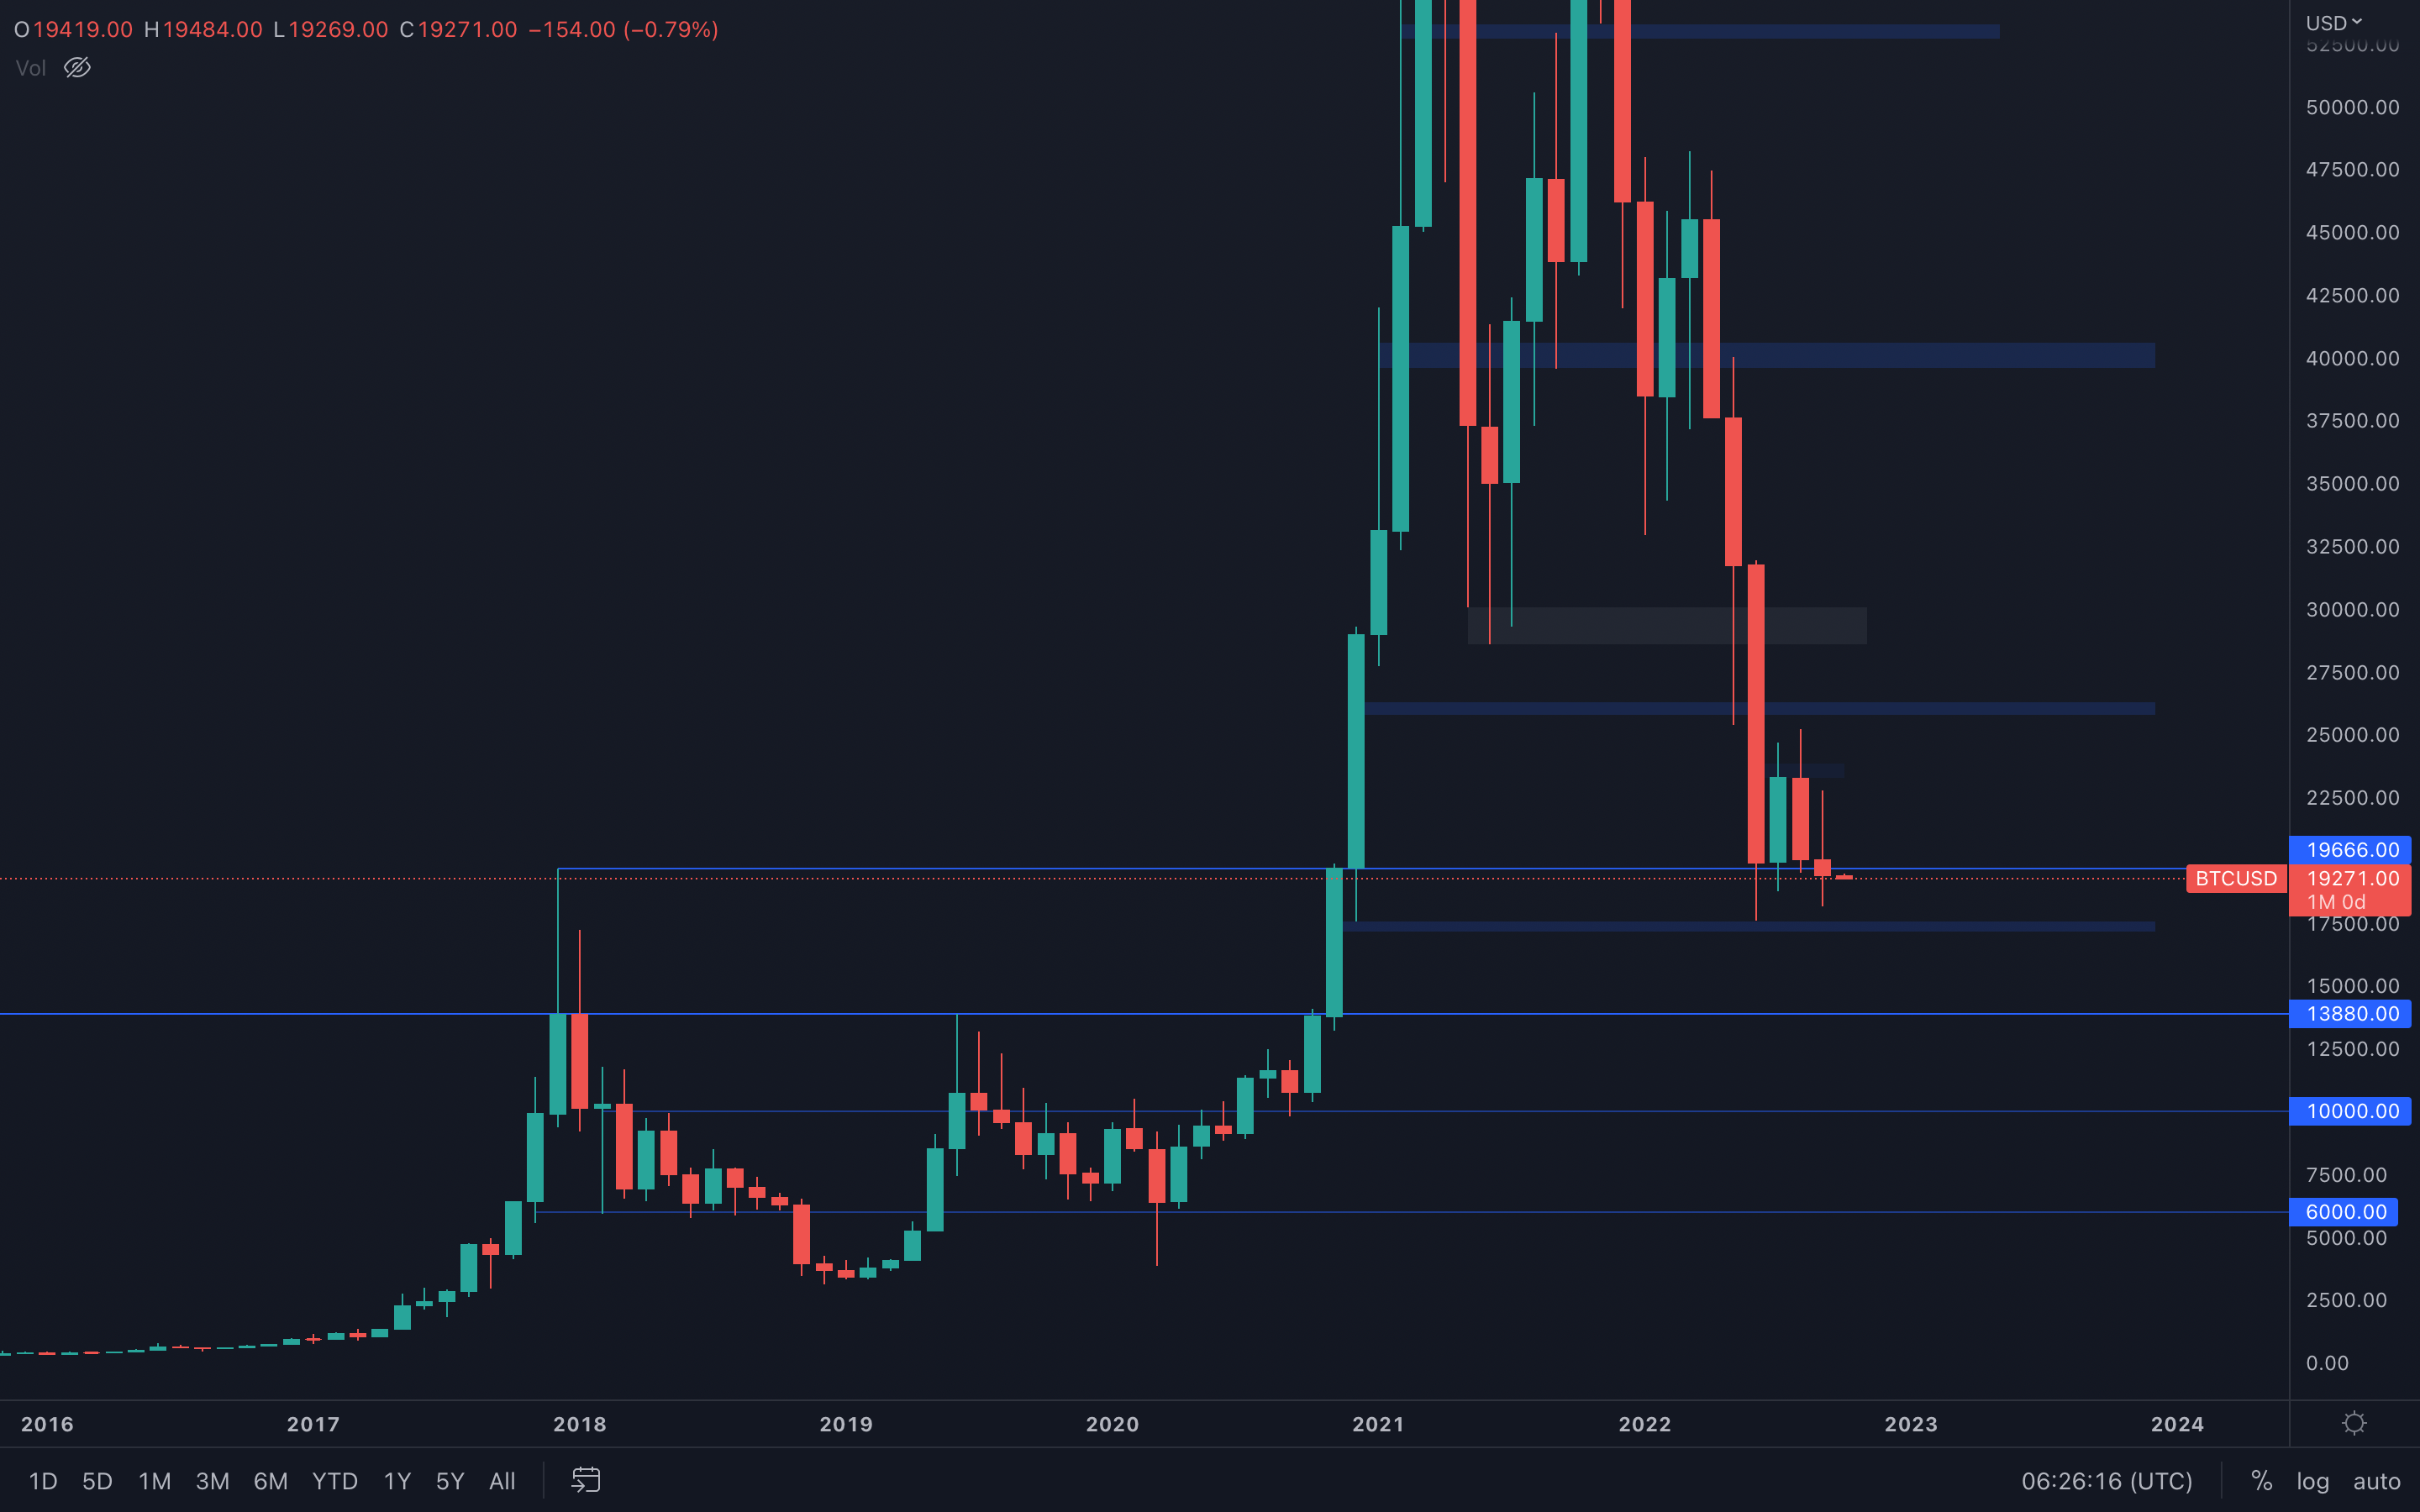 Does this count as a monthly closure under a previous all-time high?
Technically, yes.
Does this count as a monthly closure under a previous all-time high?
Technically, yes.
Bitcoin has closed a monthly candle under its 2017 all-time high. Even though the actual candle closure is sitting at $13,880, Bitcoin has still closed under the 2017 bull-run wick that created the famous "$20k all-time high". Wicks are to be counted for as well and from a technical standpoint, this event will most likely lead to a $17,500 support test, something we mentioned in previous weekly analysis reports as well.
With that said, we should be expecting a $17,500 support test this month, if not even lower prices unless the market gains traction through buyers finally stepping in and invalidating this scenario by closing October above the 2017 all-time high (wick).
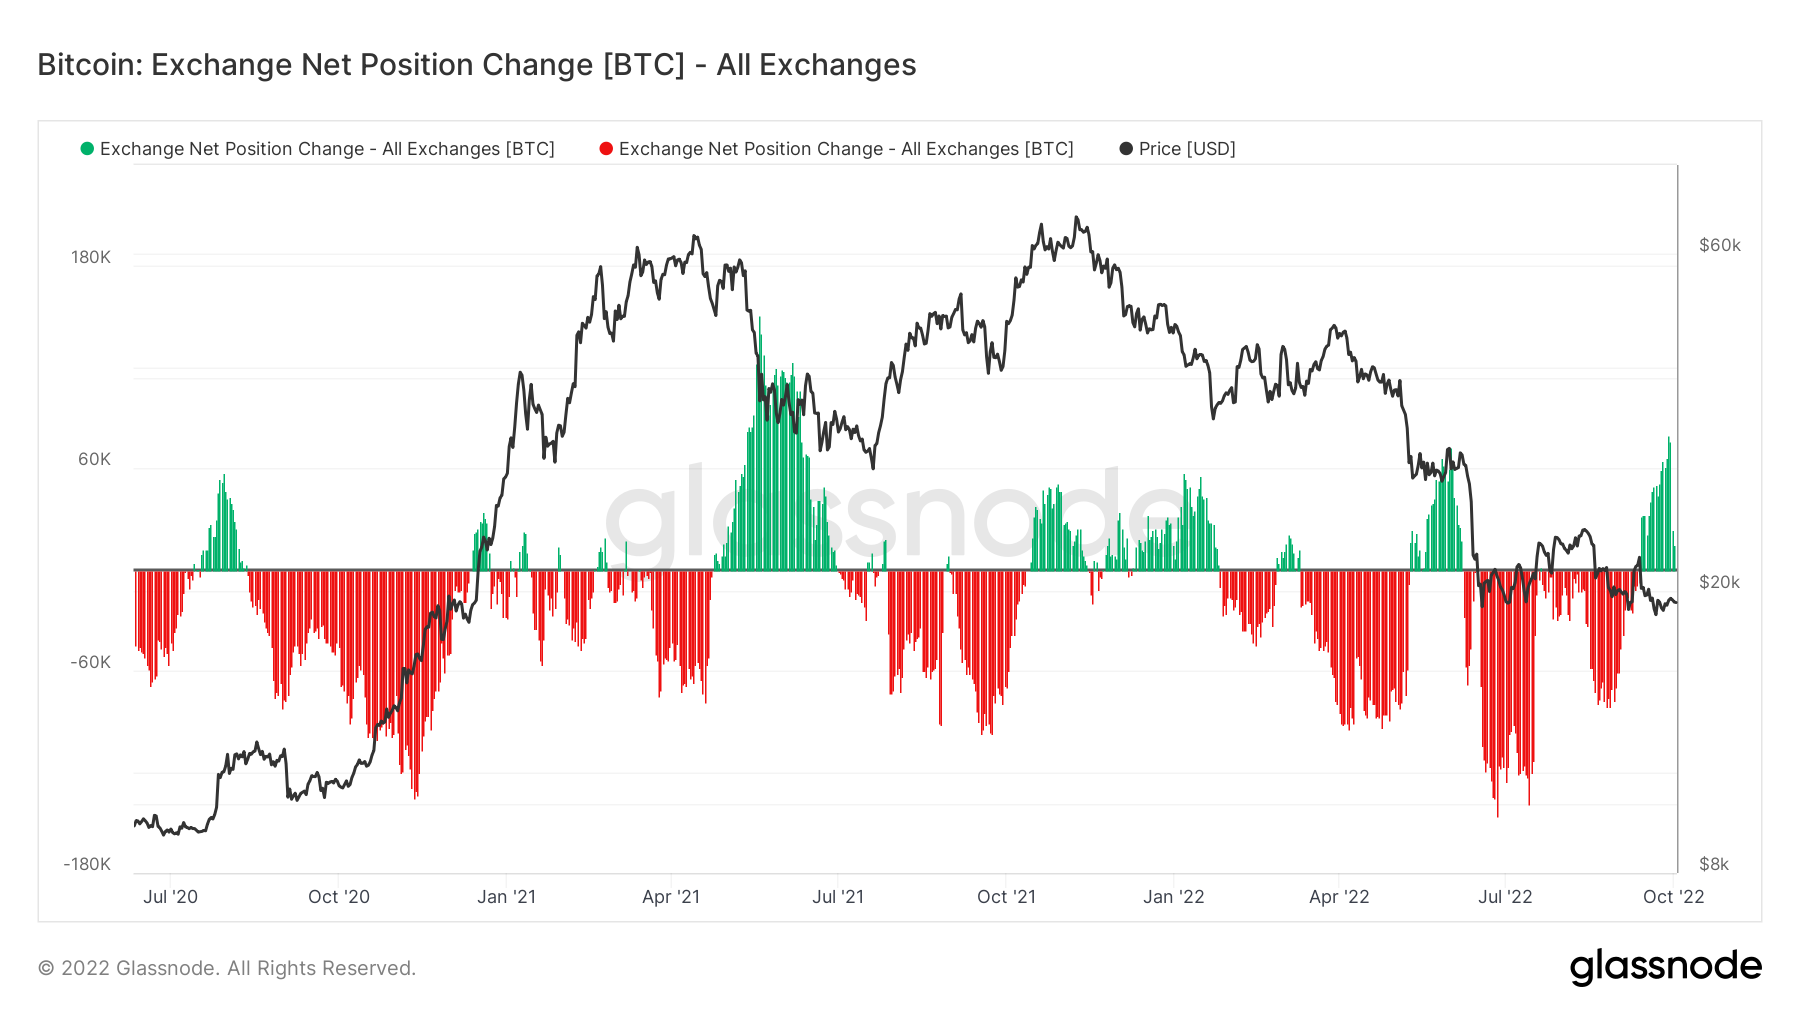
Metric 1 – Exchange Net Position Change
The Exchange Net Position Change shows the 30d change of supply of Bitcoin held in Exchange wallets. The green spikes indicate a net inflow of coins to Exchanges – coins are likely to be sold. We can see from the two last major green spikes; January 2022 and mid to late May 2022, the price of Bitcoin fell significantly following the peak of coin inflows. We can now see that in the last few weeks, this metric has once again shown a large green spike. Could this mean we’re vulnerable to another sell-off? Perhaps this is something we should be aware of when allocating capital over the next few weeks.
Bitcoin – Exchange Net Position Change
 Metric 2 – MVRV Z-Score
The MVRV Z-Score is used to assess when Bitcoin is over/undervalued relative to its “fair value”. We can see that Bitcoin is currently in its long-term macro “buy” zone (the green area). Previously, this metric has always been a good buy when entering into this zone, however, the question remains; can the price go lower and push this metric towards the bottom of the band? This is what happened in Q4 2018 when Bitcoin was priced at $4,000, but it did fall further to $3,500, which pushed this metric to the bottom of the green zone. It is possible that this may happen again, but all-in-all, the current price would represent an acceptable long-term buy for Bitcoin.
Bitcoin – MVRV Z-Score

Ether - Technical & On-Chain Analysis
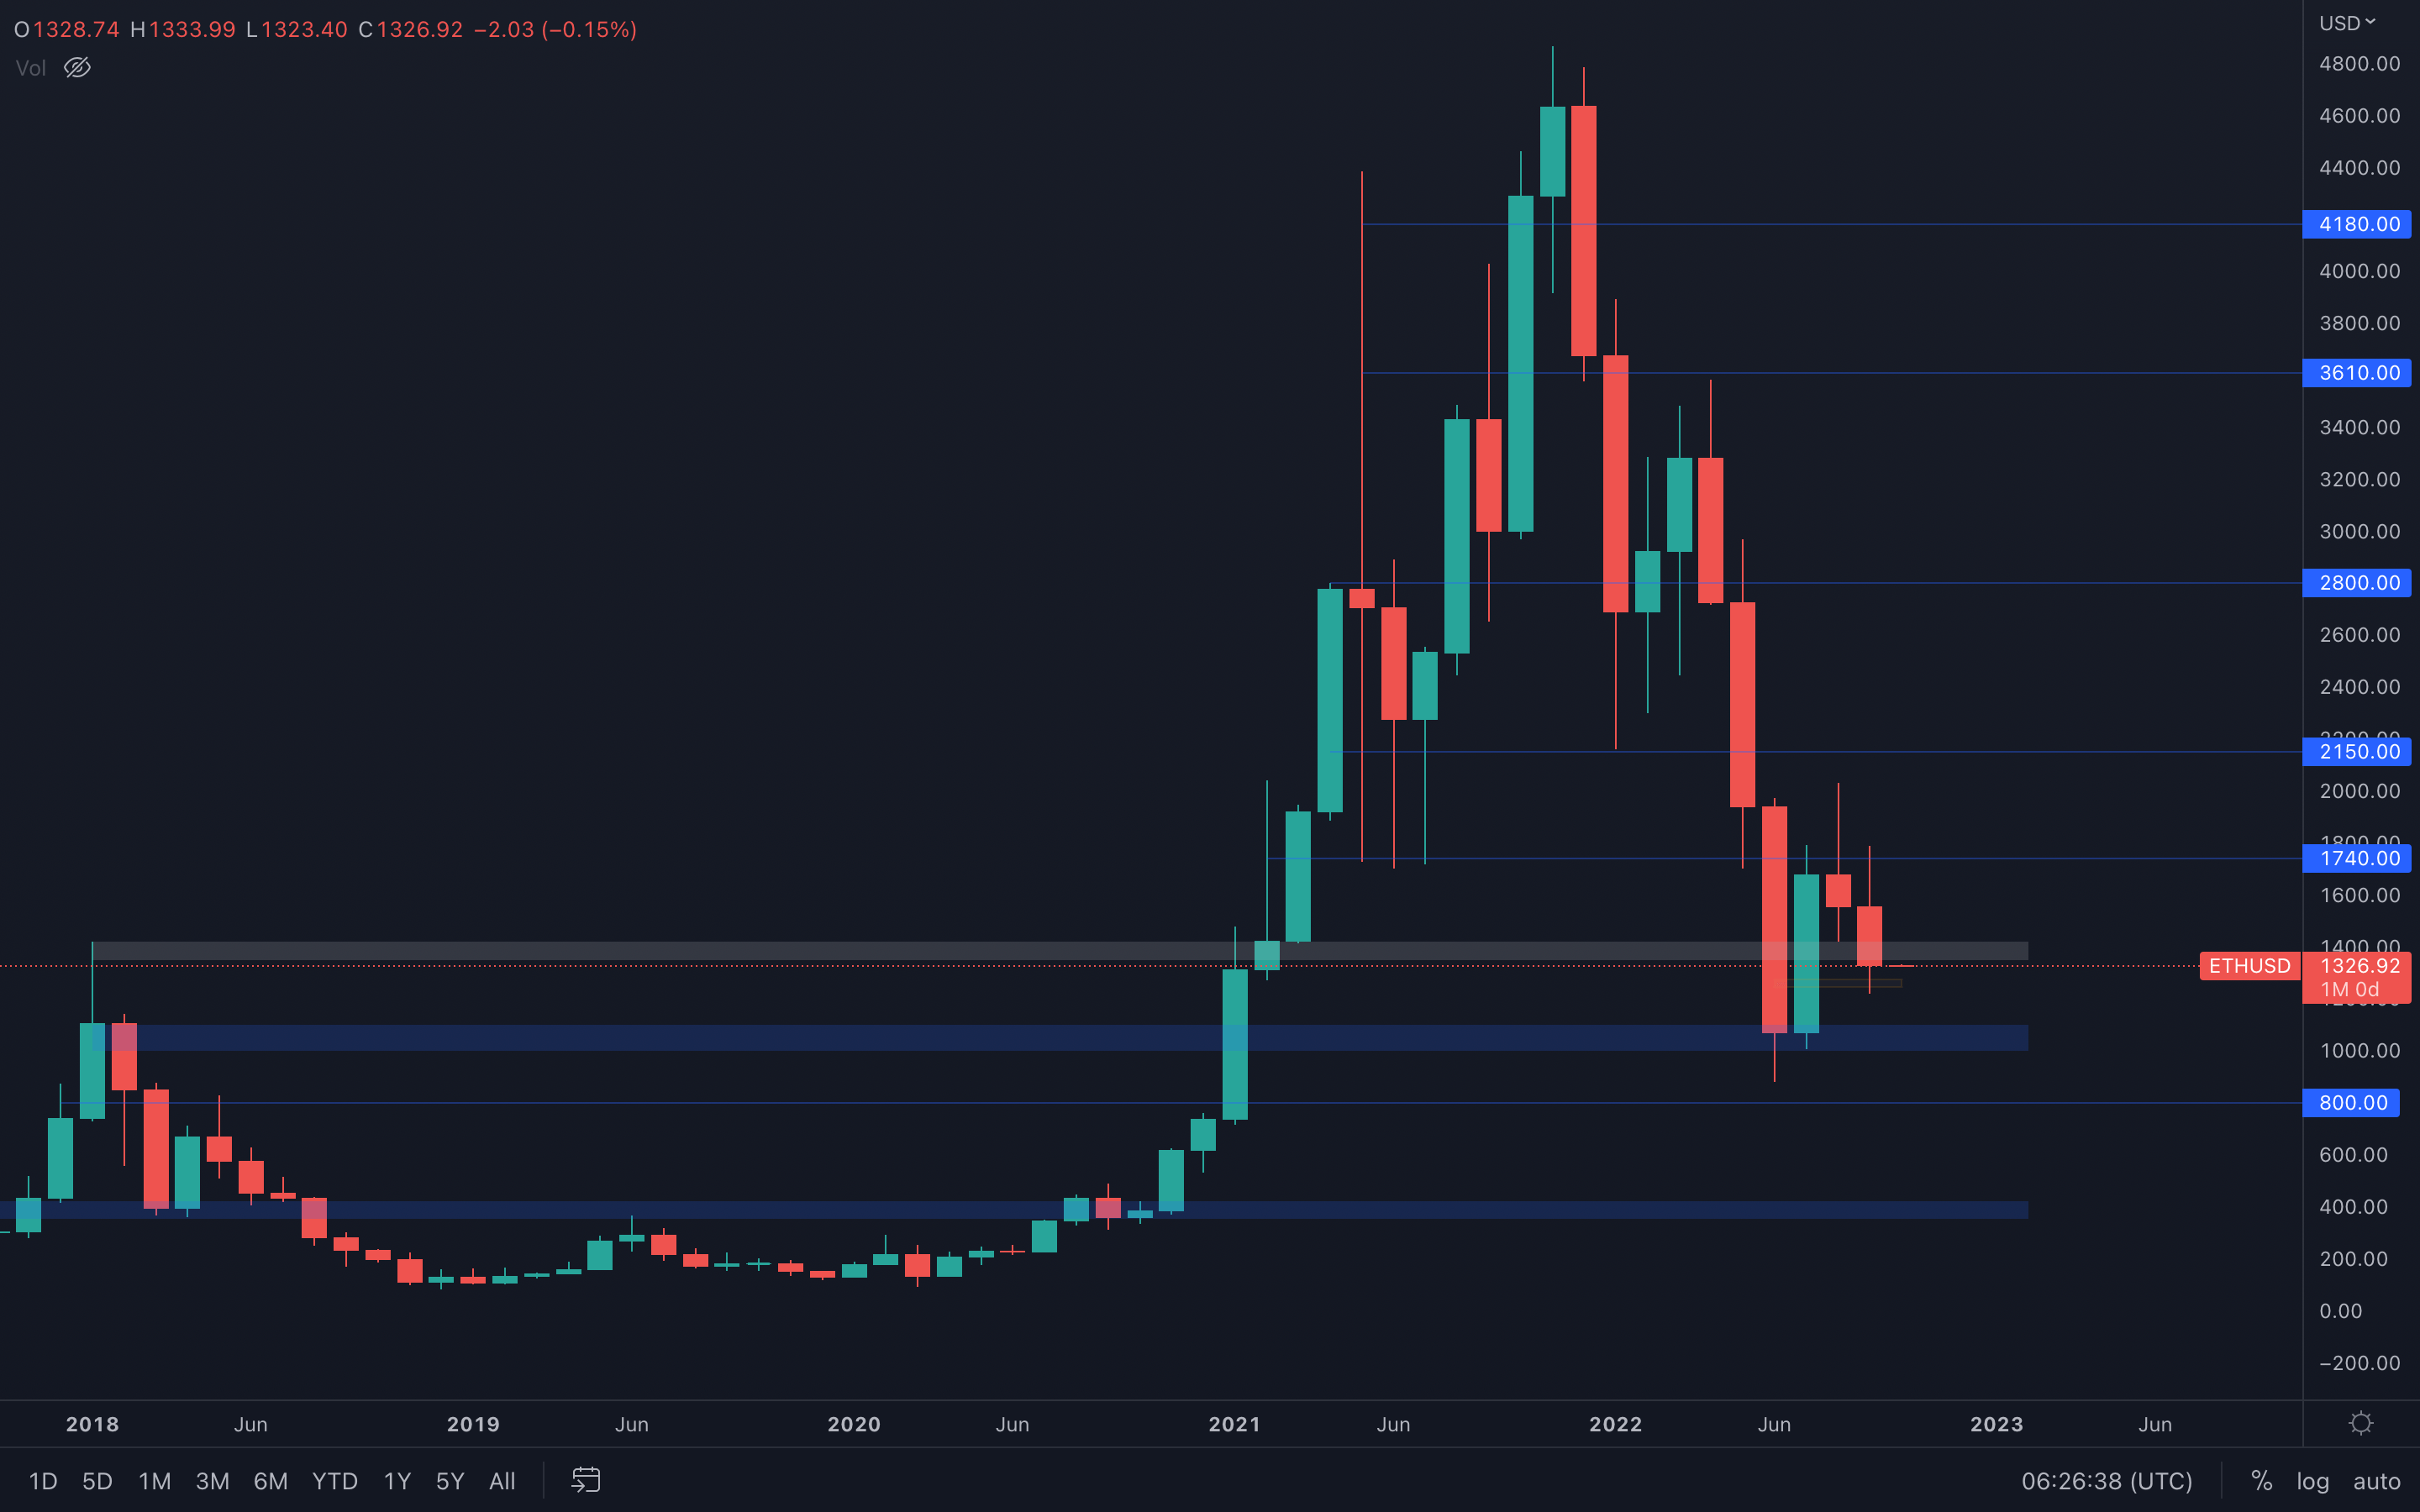 Ether has closed under its previous all-time high as well, actually even more aggressively compared to Bitcoin, which means the same outcome can be mentioned here:
Since the 2018 all-time high was lost ($1400), Ether is now on a straight path toward the psychological and technical level of $1000. Will buyers step in again, similar to how they acted back in July or will the notorious $1000 level be finally lost?
☝️☝️ Answer is... ... we cannot know that for sure. The only thing we can do here is to wait, see what happens and react accordingly. We always recommend being prepared for all scenarios. That's financial advice. Don't take it for granted.
Metric 1 – Exchange Net Position Change
The same metric for Ether does not give too many signals in terms of spotting trends. We can see that recently we have seen some large inflows of coins, however, these inflows have begun to subside. Again, could a further sell-off occur if there are a high amount of coins inside Exchange wallets? It’s possible, and something we should be aware of over the coming weeks.
Ether – Exchange Net Position Change
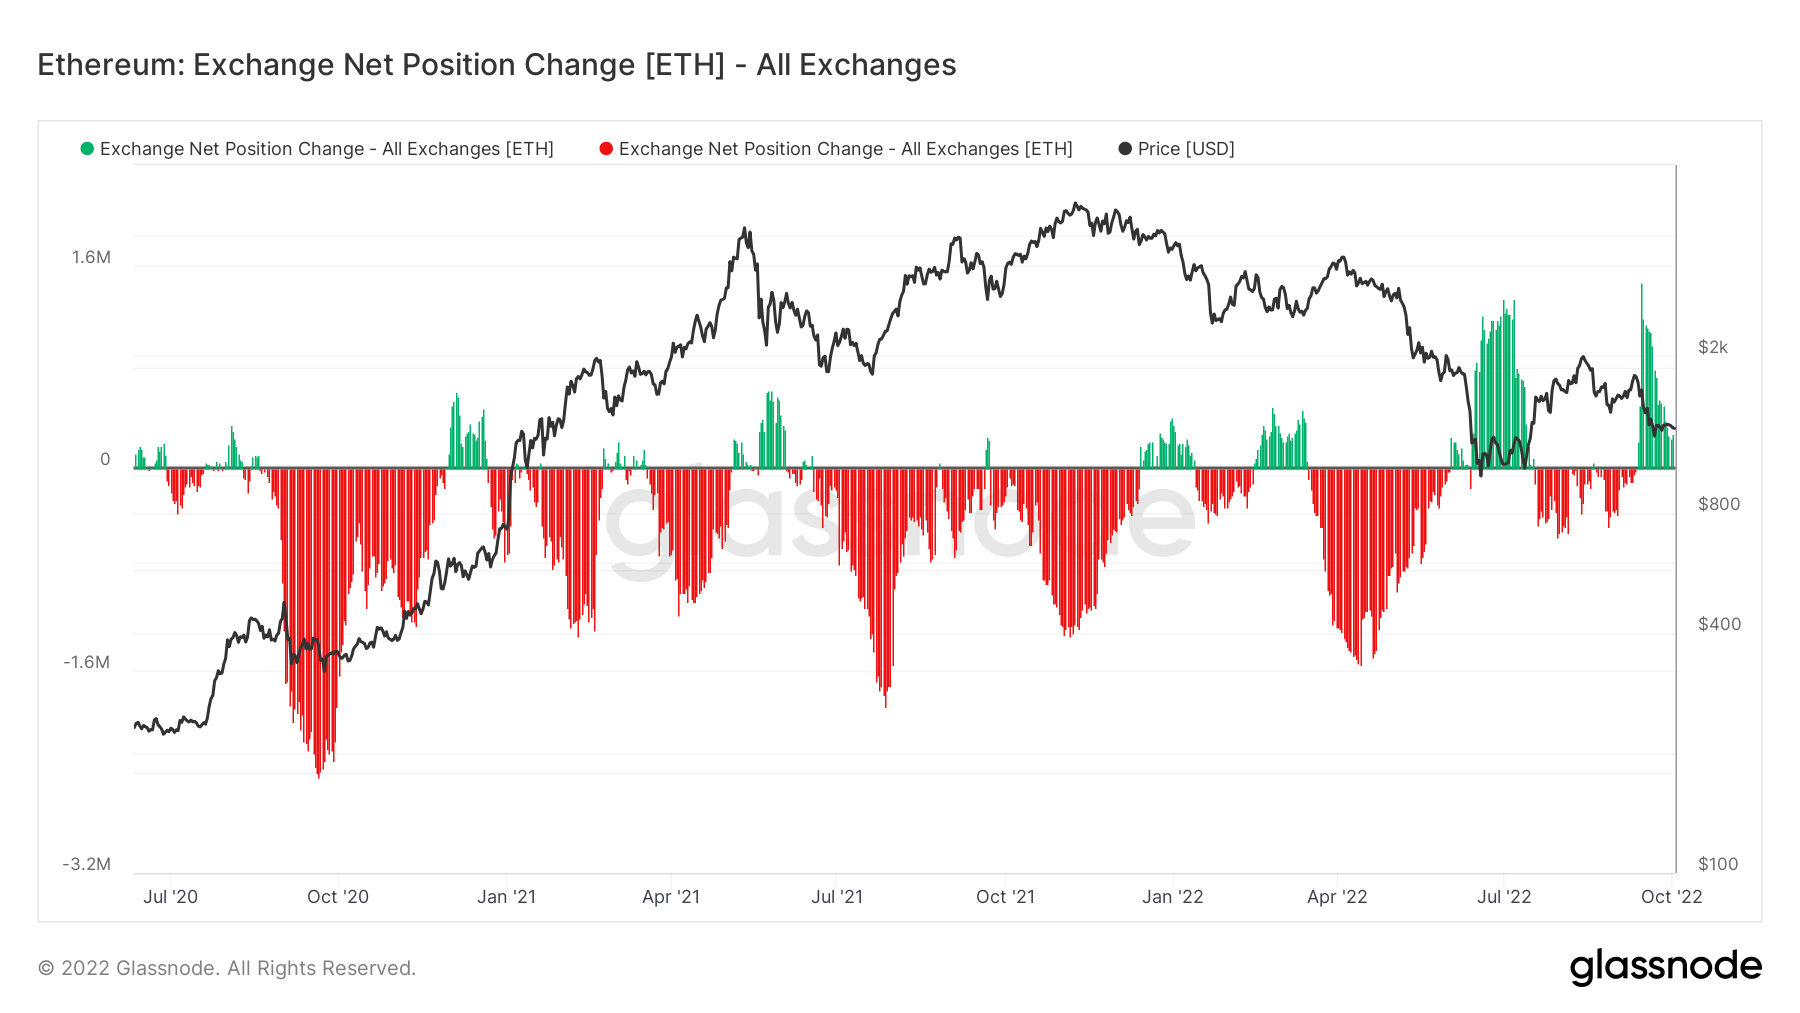
The above two graphs show why we place a stronger focus on the on-chain data for Bitcoin in comparison to Ether. The Bitcoin data is more useful when it comes to predicting what may happen as it displays more clear historical trends, whereas the on-chain data for Ether does not have such strong historical signals that would aid us in predicting future moves.
Metric 2 – MVRV Z-Score
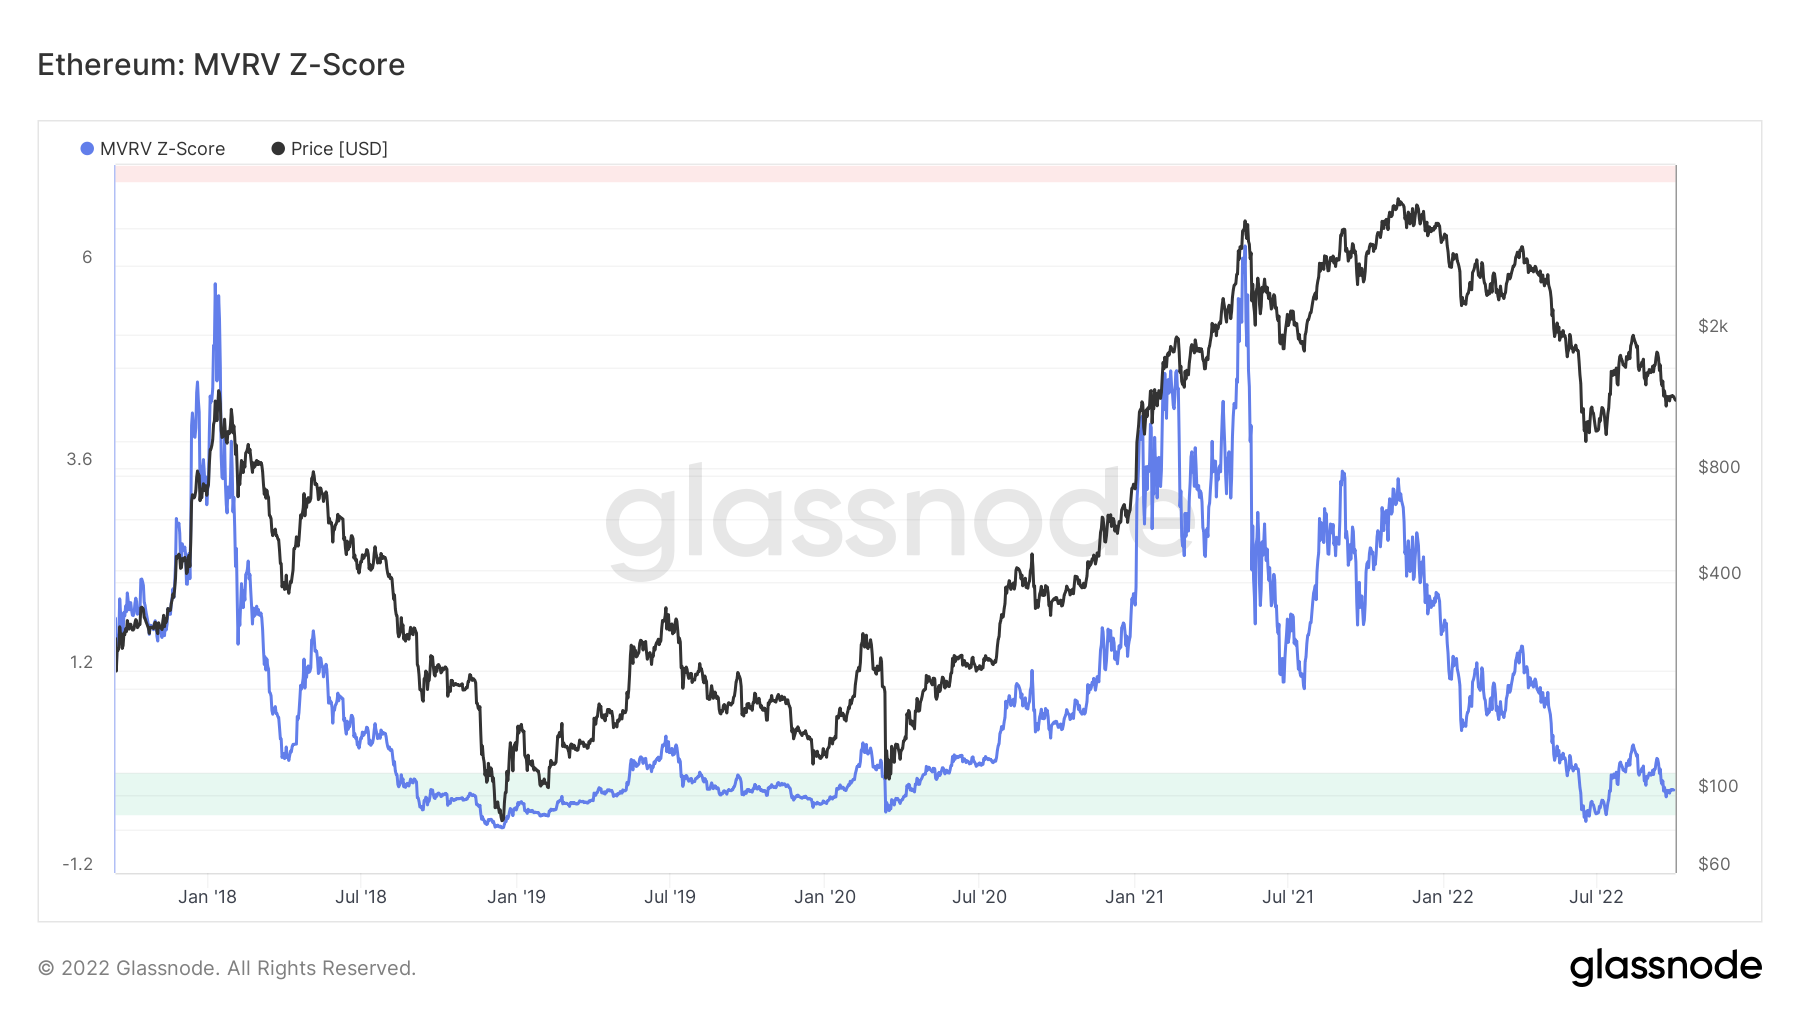
If we now look at the same metric for Ether, we can see that the Z-Score has fallen below the green zone in prior bear market bottoms. Once again, current prices do represent good long-term buys, however, it is possible we do test lower, particularly with the escalating geopolitical tensions that we have currently.
DOT
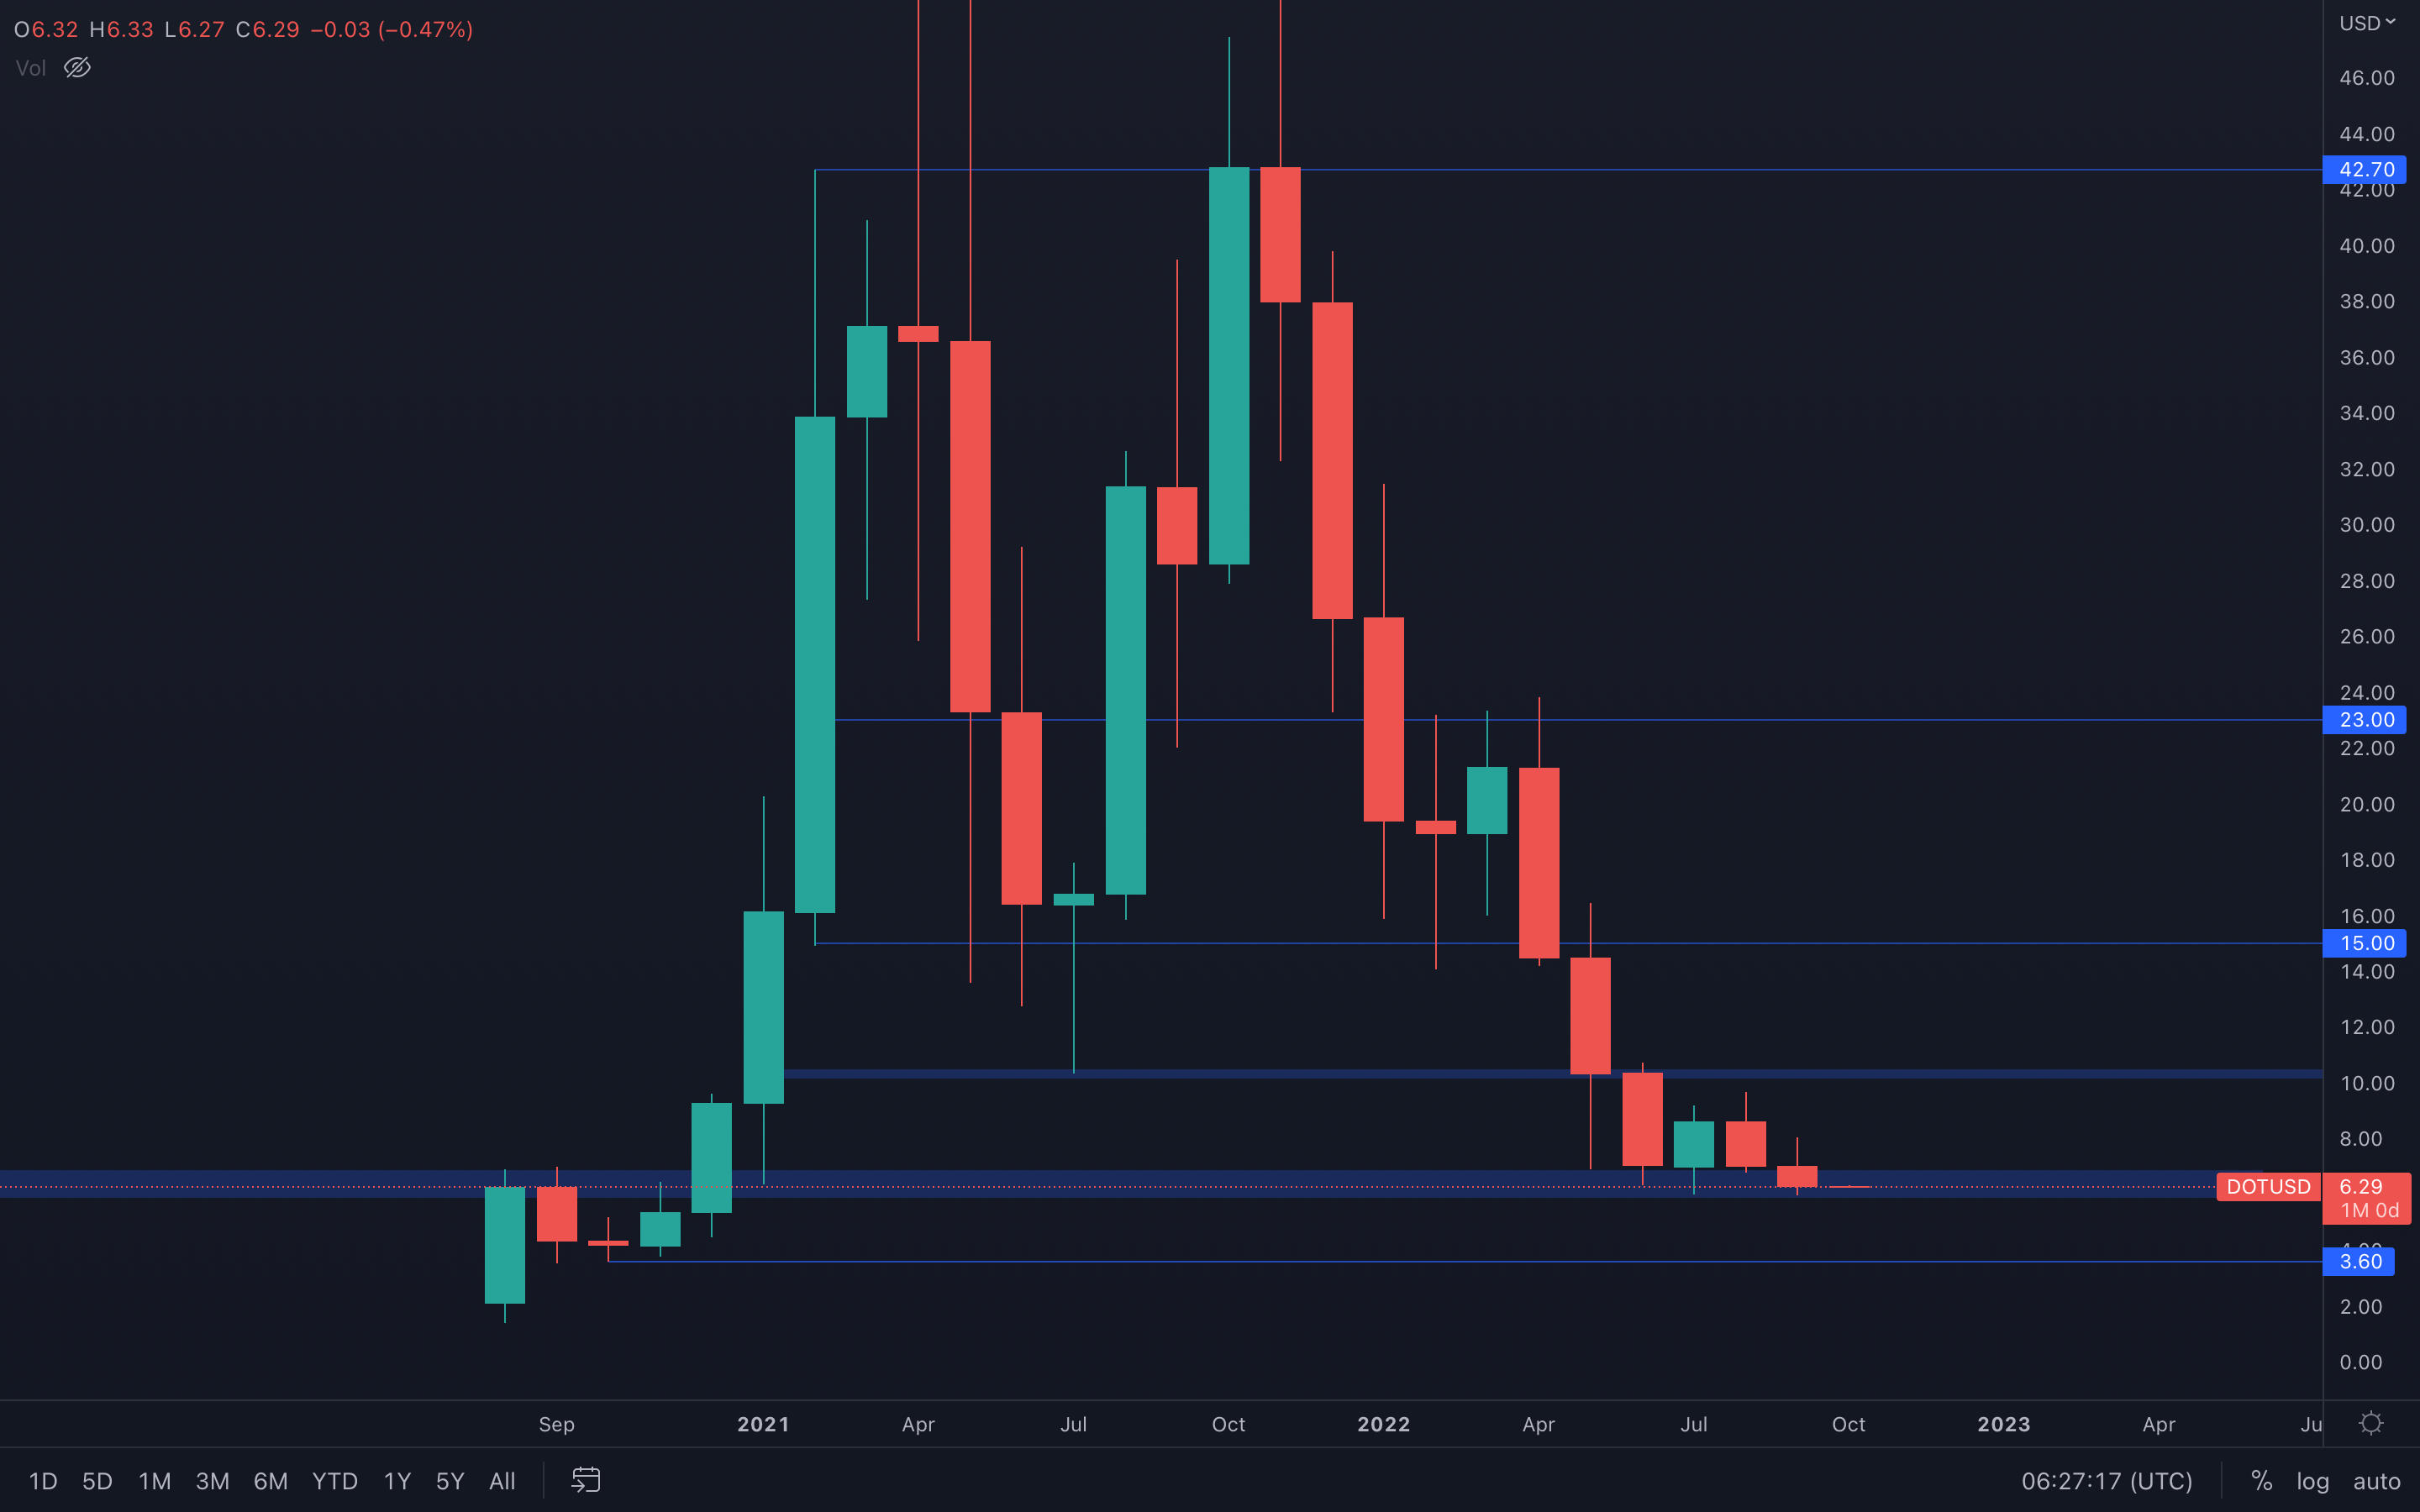 September has been quite silent for DOT as well, closing into the $7 - $6 support area which suggests that the asset can experience buying pressure this month. Why is that, you might ask?
Closing a candle into support is never reliable. It leaves options on the table, such as bouncing from that support level, losing the respective level, or even consolidating between two levels, in this case between $7 and $6. This implies there isn't a path that has a higher probability of success, it's just multiple scenarios with the same probabilities.
With that said, DOT is in a "wait & see zone". We need more data to confirm a direction, but since the $6 level isn't lost yet, we cannot assume prices will head lower than that.
SNX
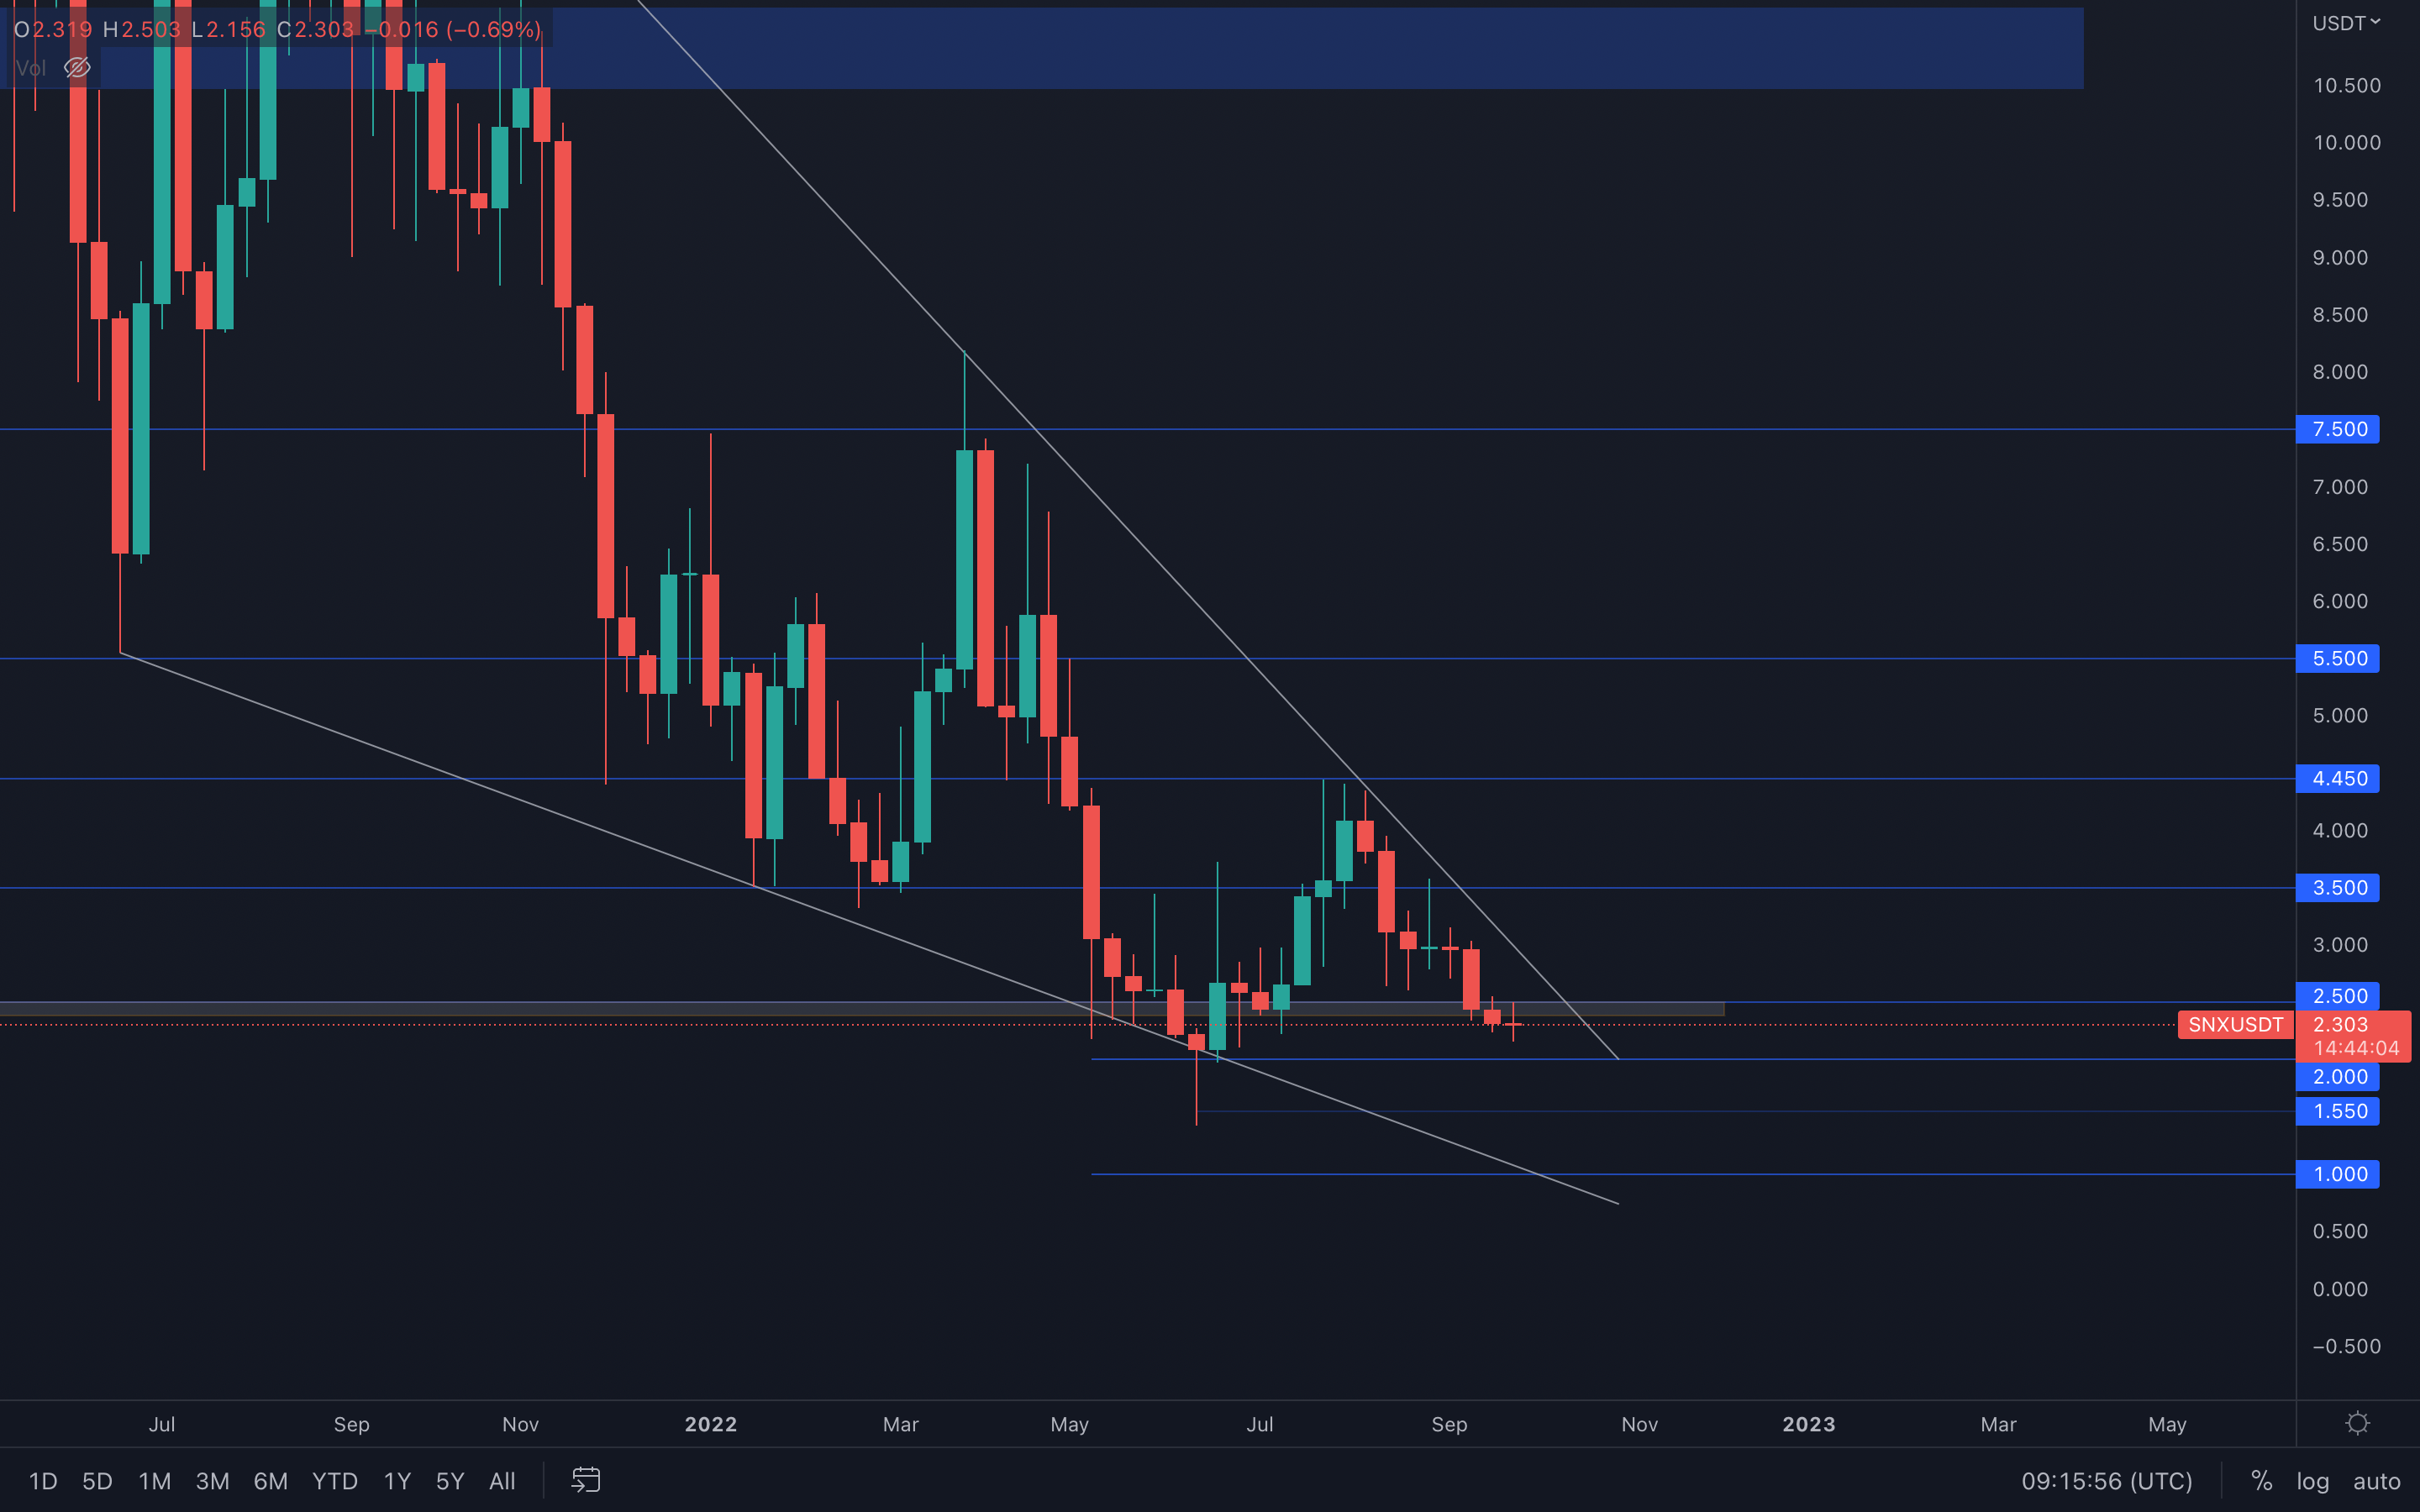
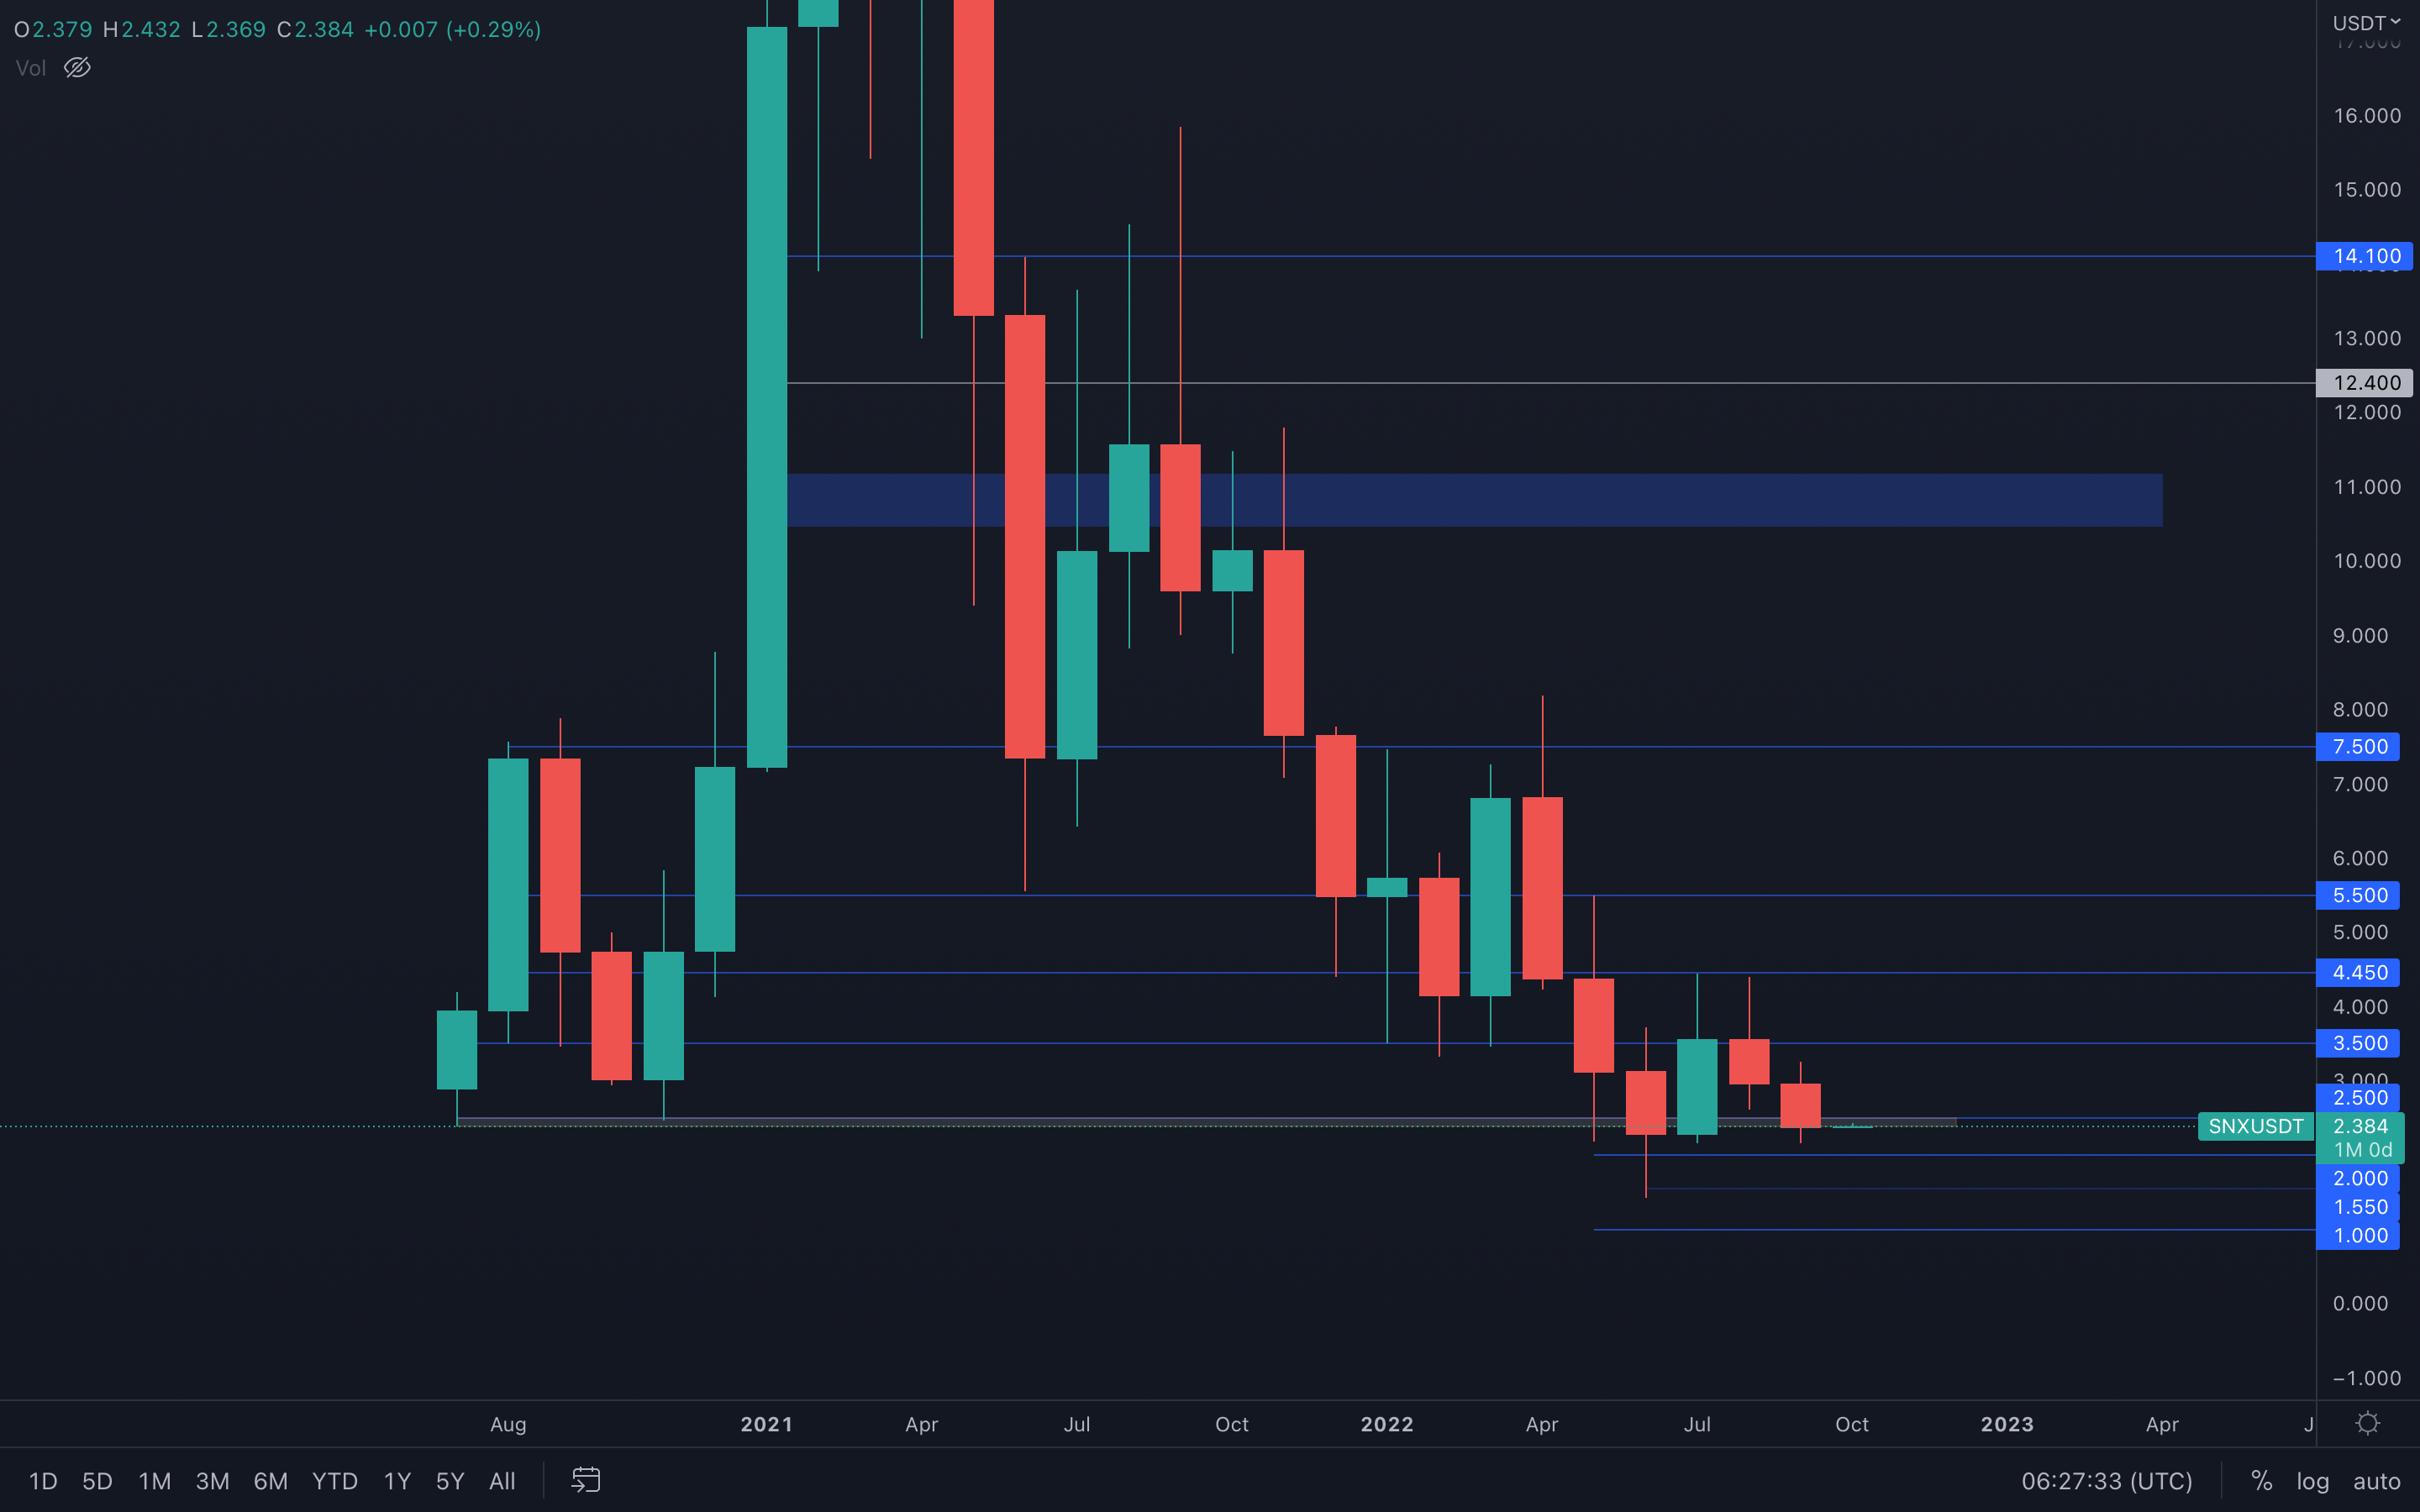 SNX has found itself under its $2.50 support level once more, both on the monthly and weekly timeframes. The asset has lost ~20% in September and is likely to lose more, after taking a look at the weekly timeframe.
What can be seen in the weekly timeframe is that SNX closed under its $2.50 support level two weeks ago, after which the asset has retested the level, flipping it into resistance. We can now see that SNX is getting rejected from said level - this will lead to a $2 support test in the coming week(s).
Check the chart below for context:
SNX - Weekly timeframe
RUNE
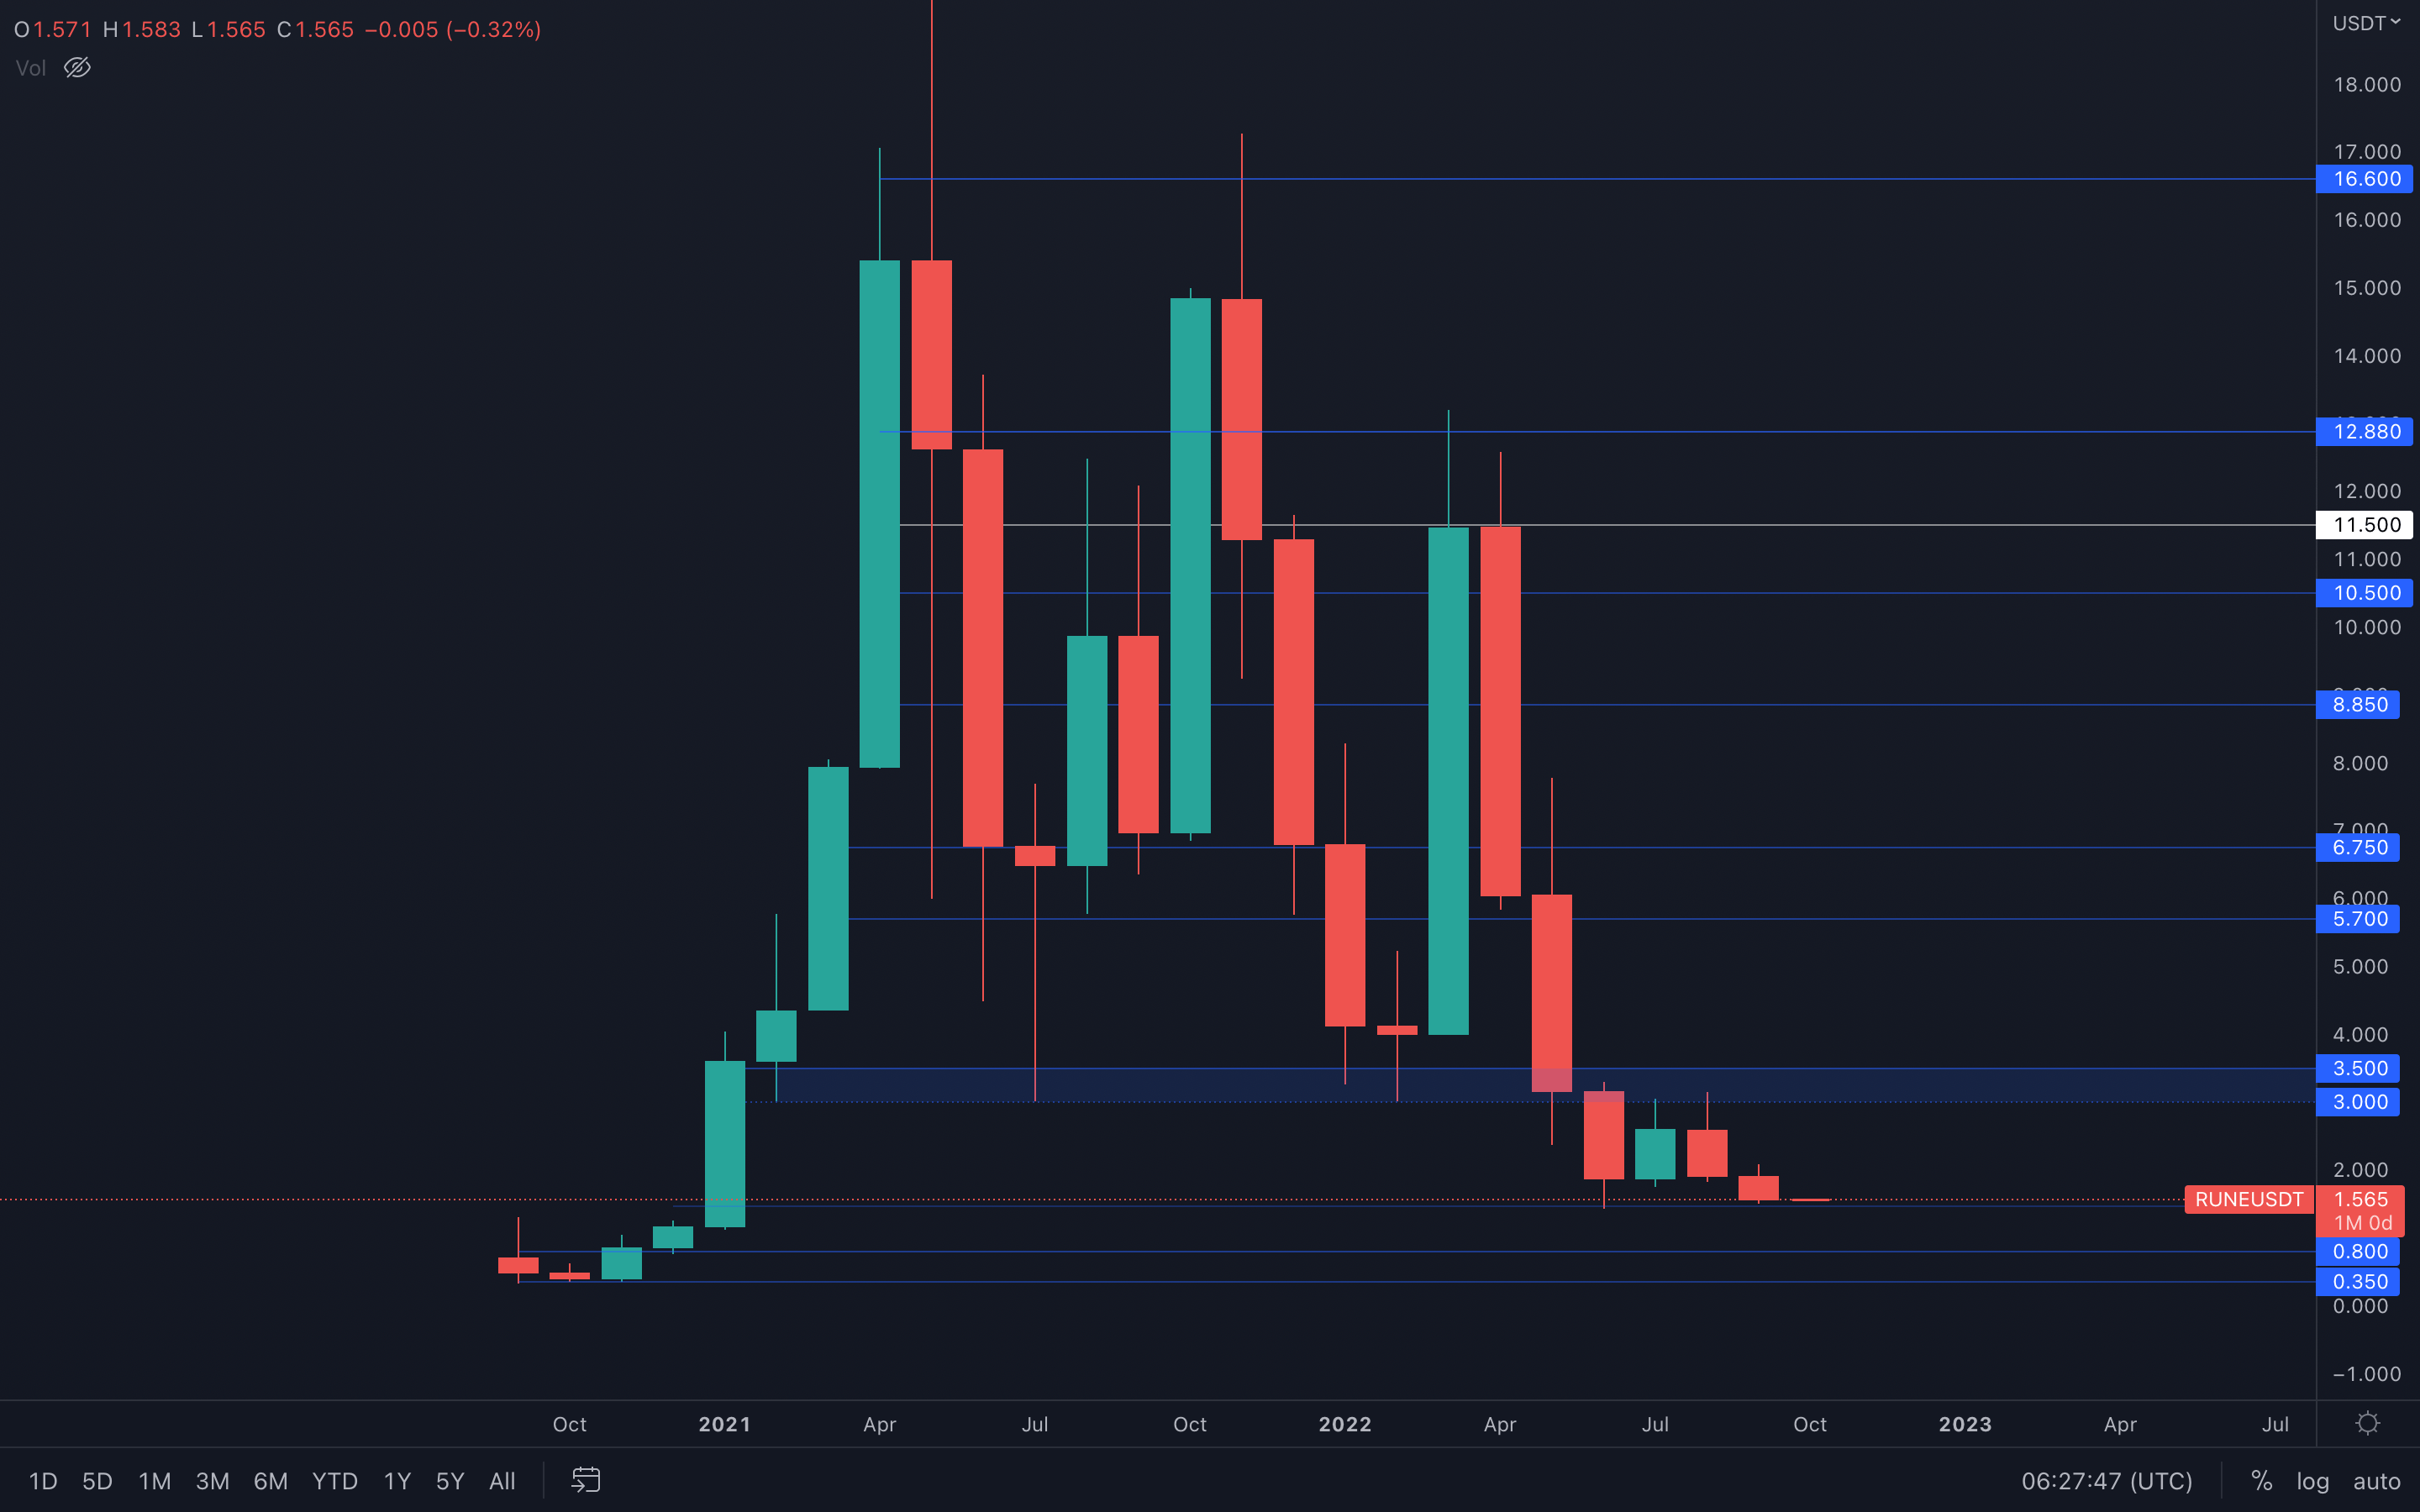 We've been expecting a proper $1.50 support test for some time now and it has now occurred. RUNE closed September just above its $1.50 level, which suggests that we cannot assume the asset is going to head lower than that.
For now, RUNE needs a weekly closure under $1.50 to confirm a move toward $1.10. Until that happens, we should expect this level to hold, ultimately leading to a small increase in price. The majors will play a big role in RUNE's price action this October, so we should place more of our attention there instead of here.
SOL
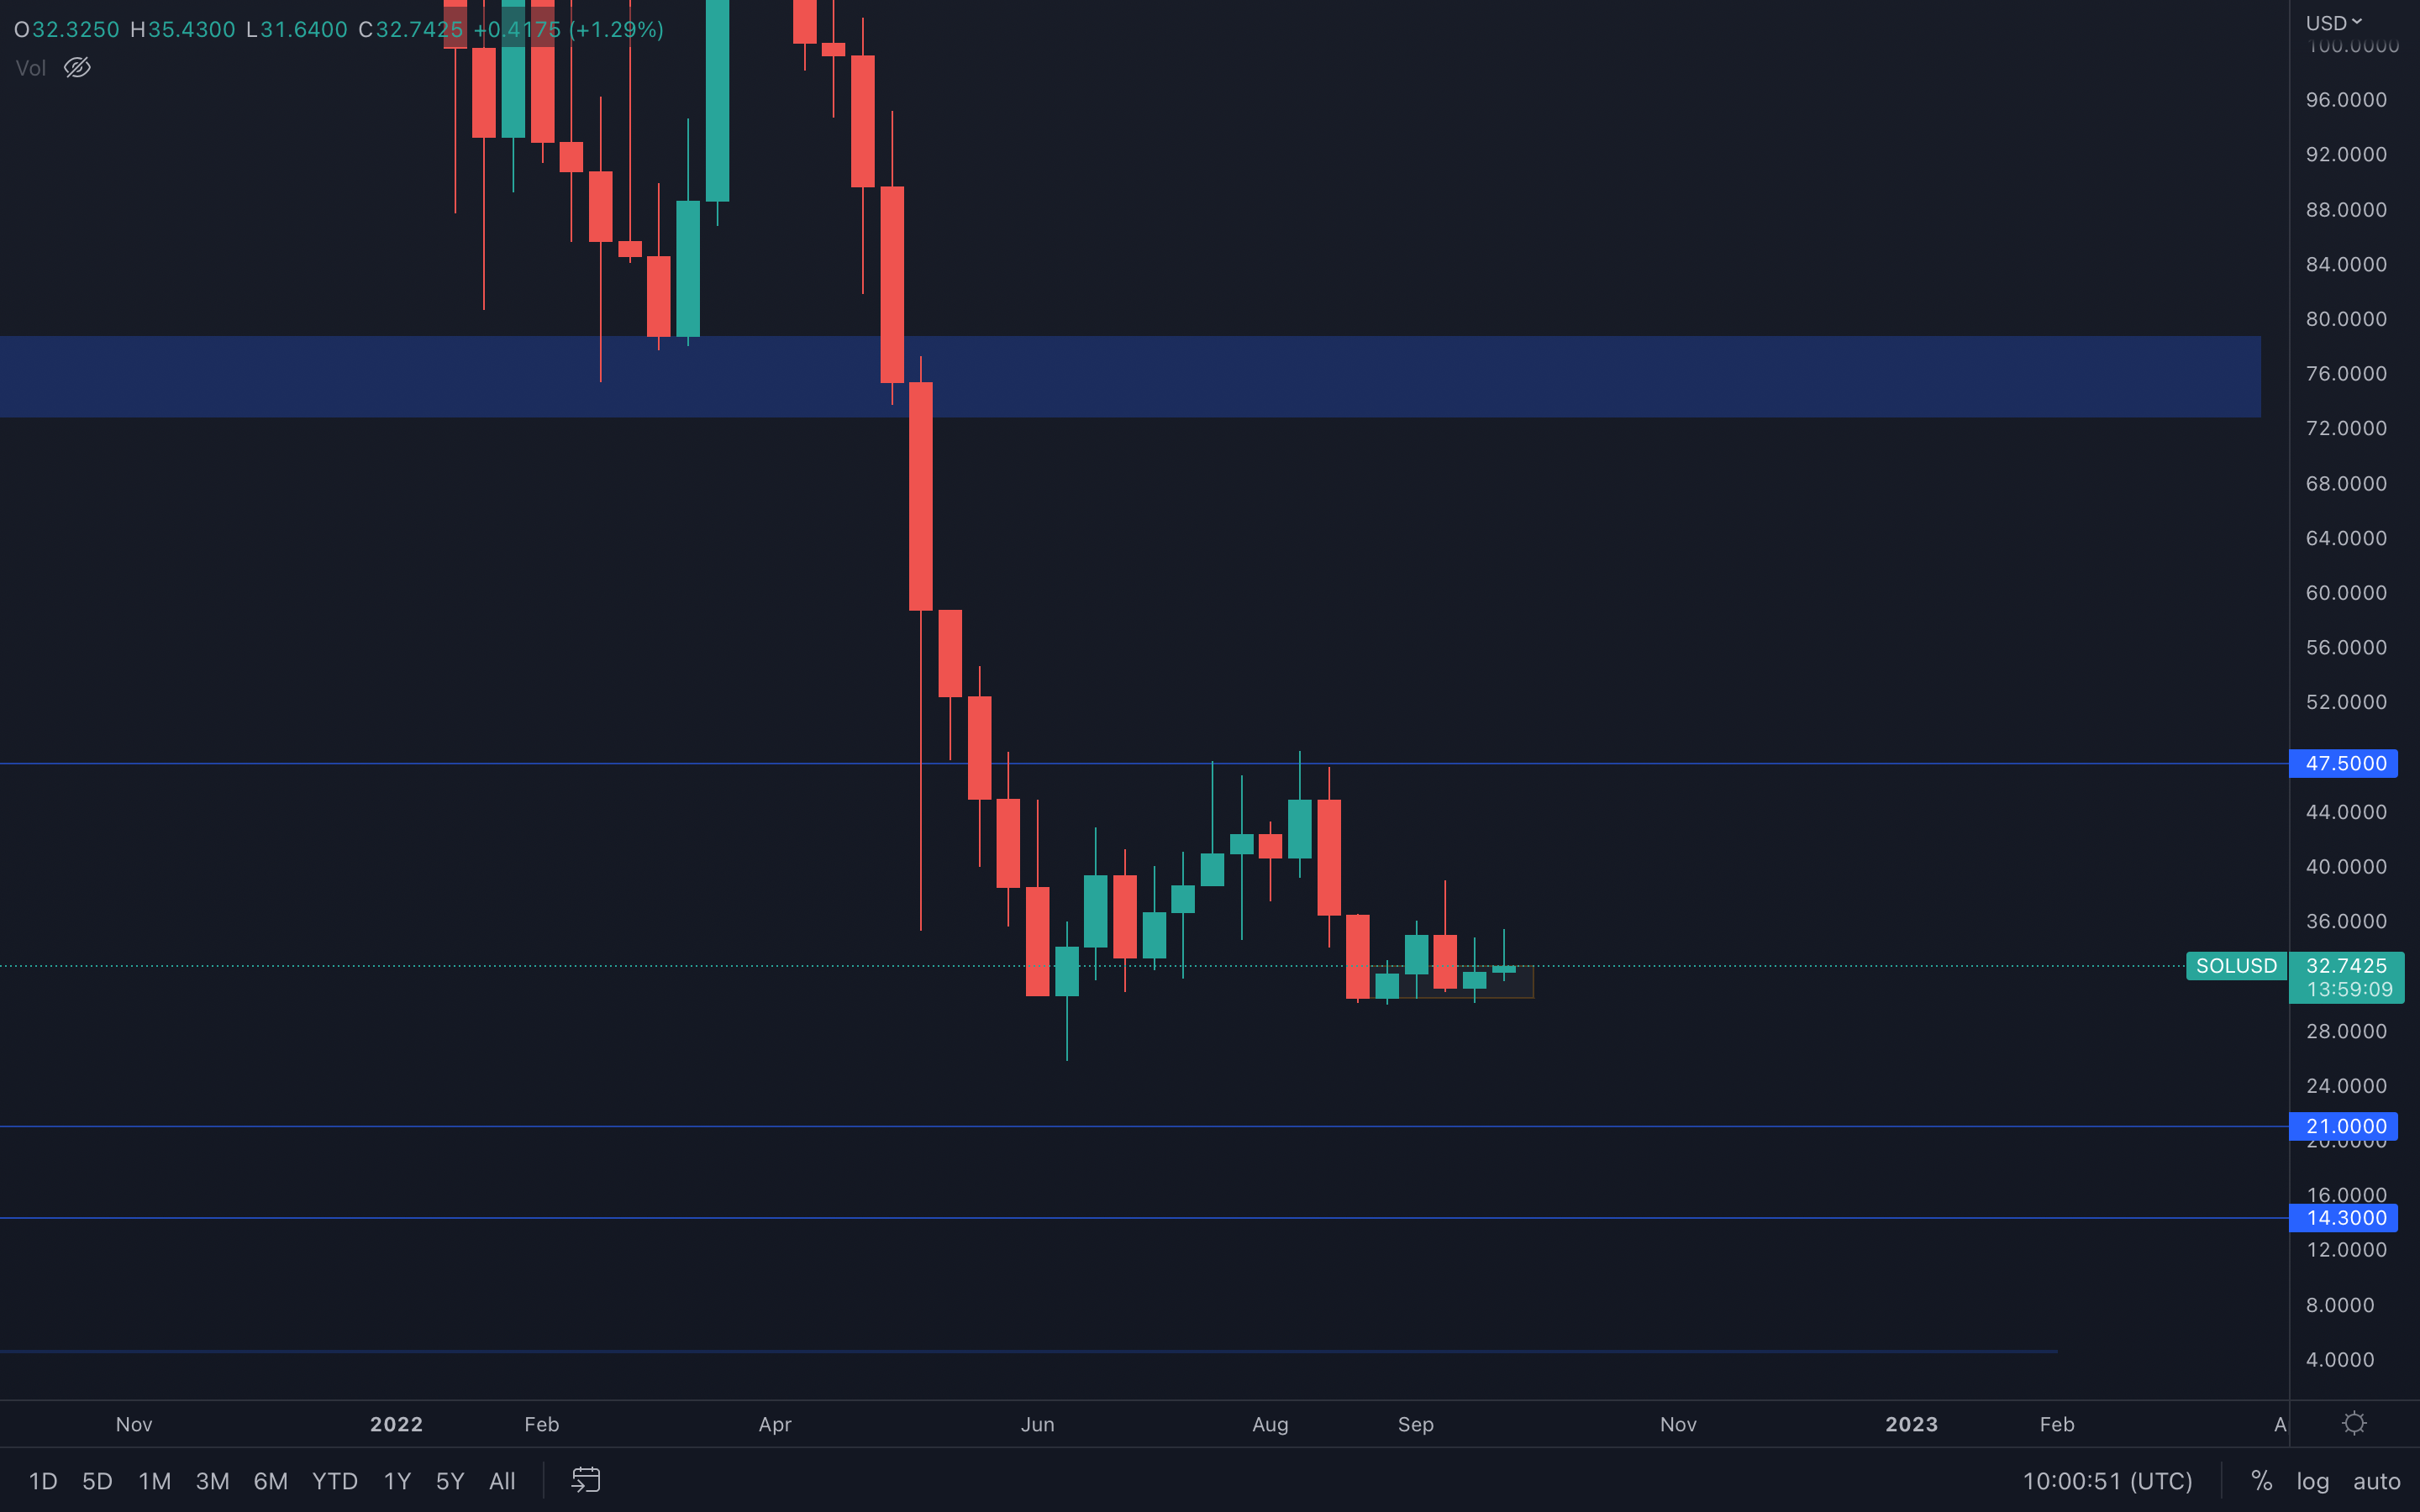
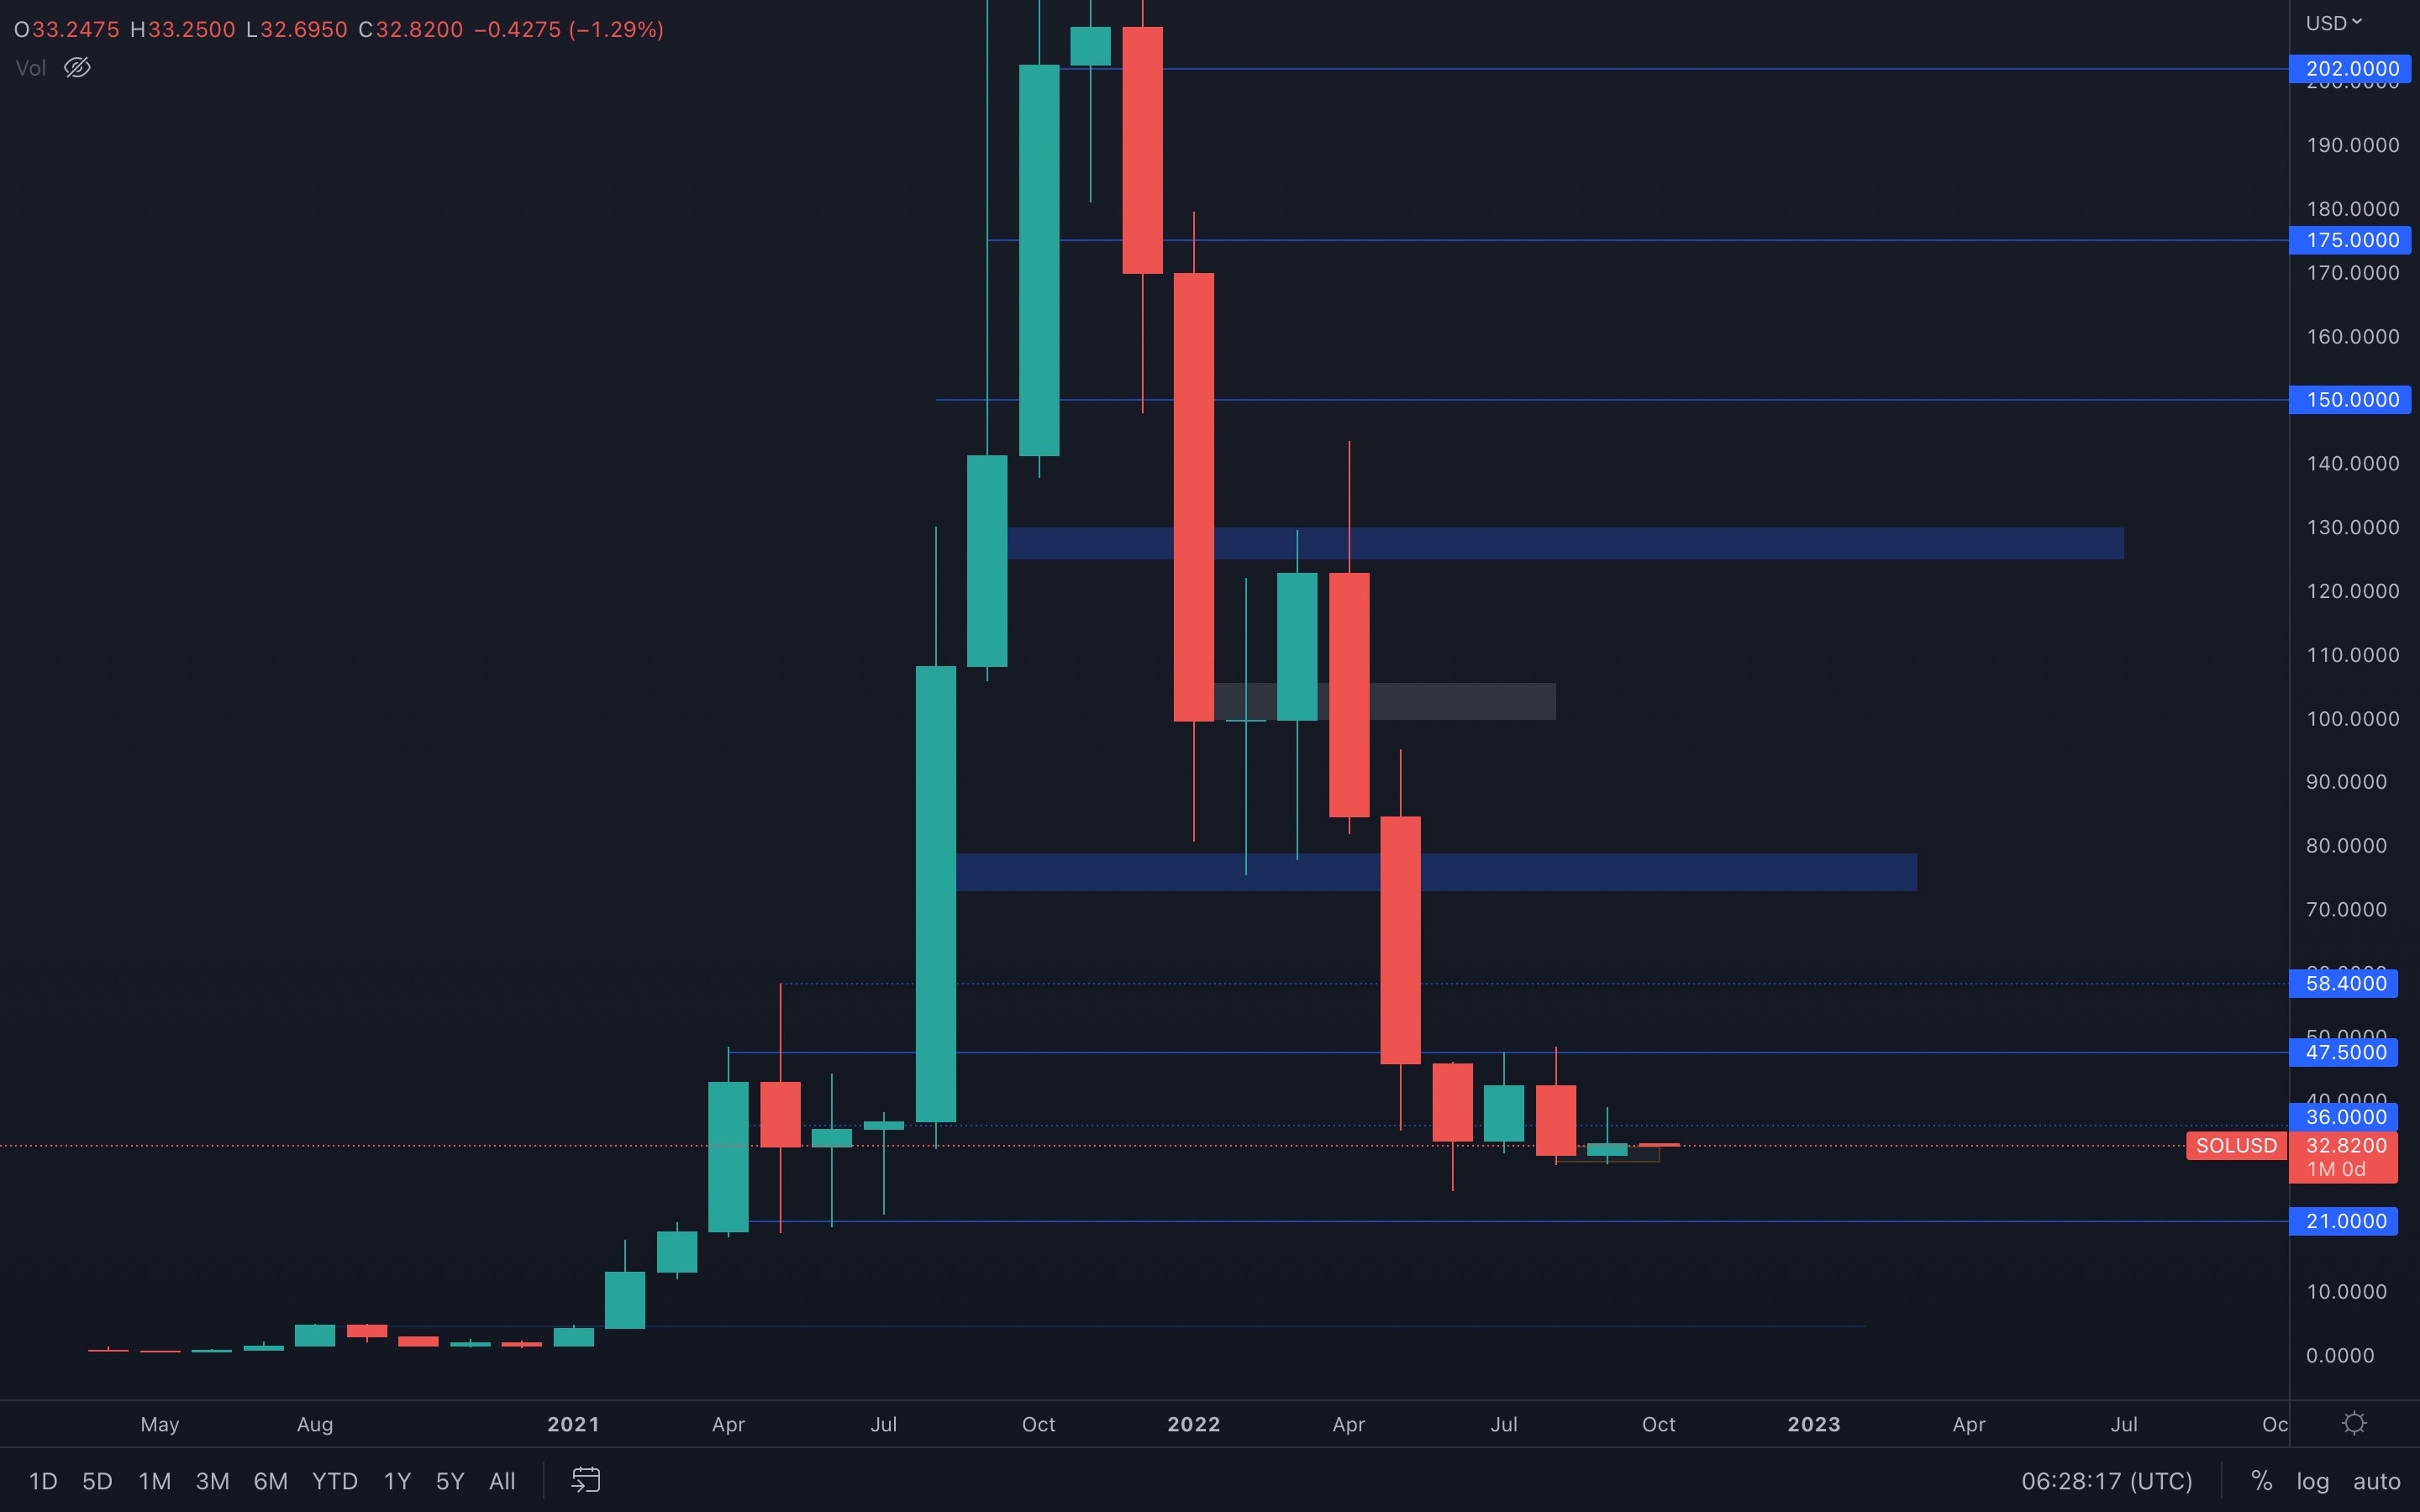 Surprisingly, SOL closed bullish last month, which suggests we can see higher prices this October. The asset has also held a daily/weekly local support perfectly - and we're talking precision here.
We can see that during September, SOL experienced increased buying pressure which pushed the asset to $39, marking a weekly high. This now acts as a potential target for SOL and since September has closed bullish, suggesting buyers are still present, then a $39 test can be expected this month.
Below is the weekly SOL chart for context:
SOL - Weekly timeframe
SRM
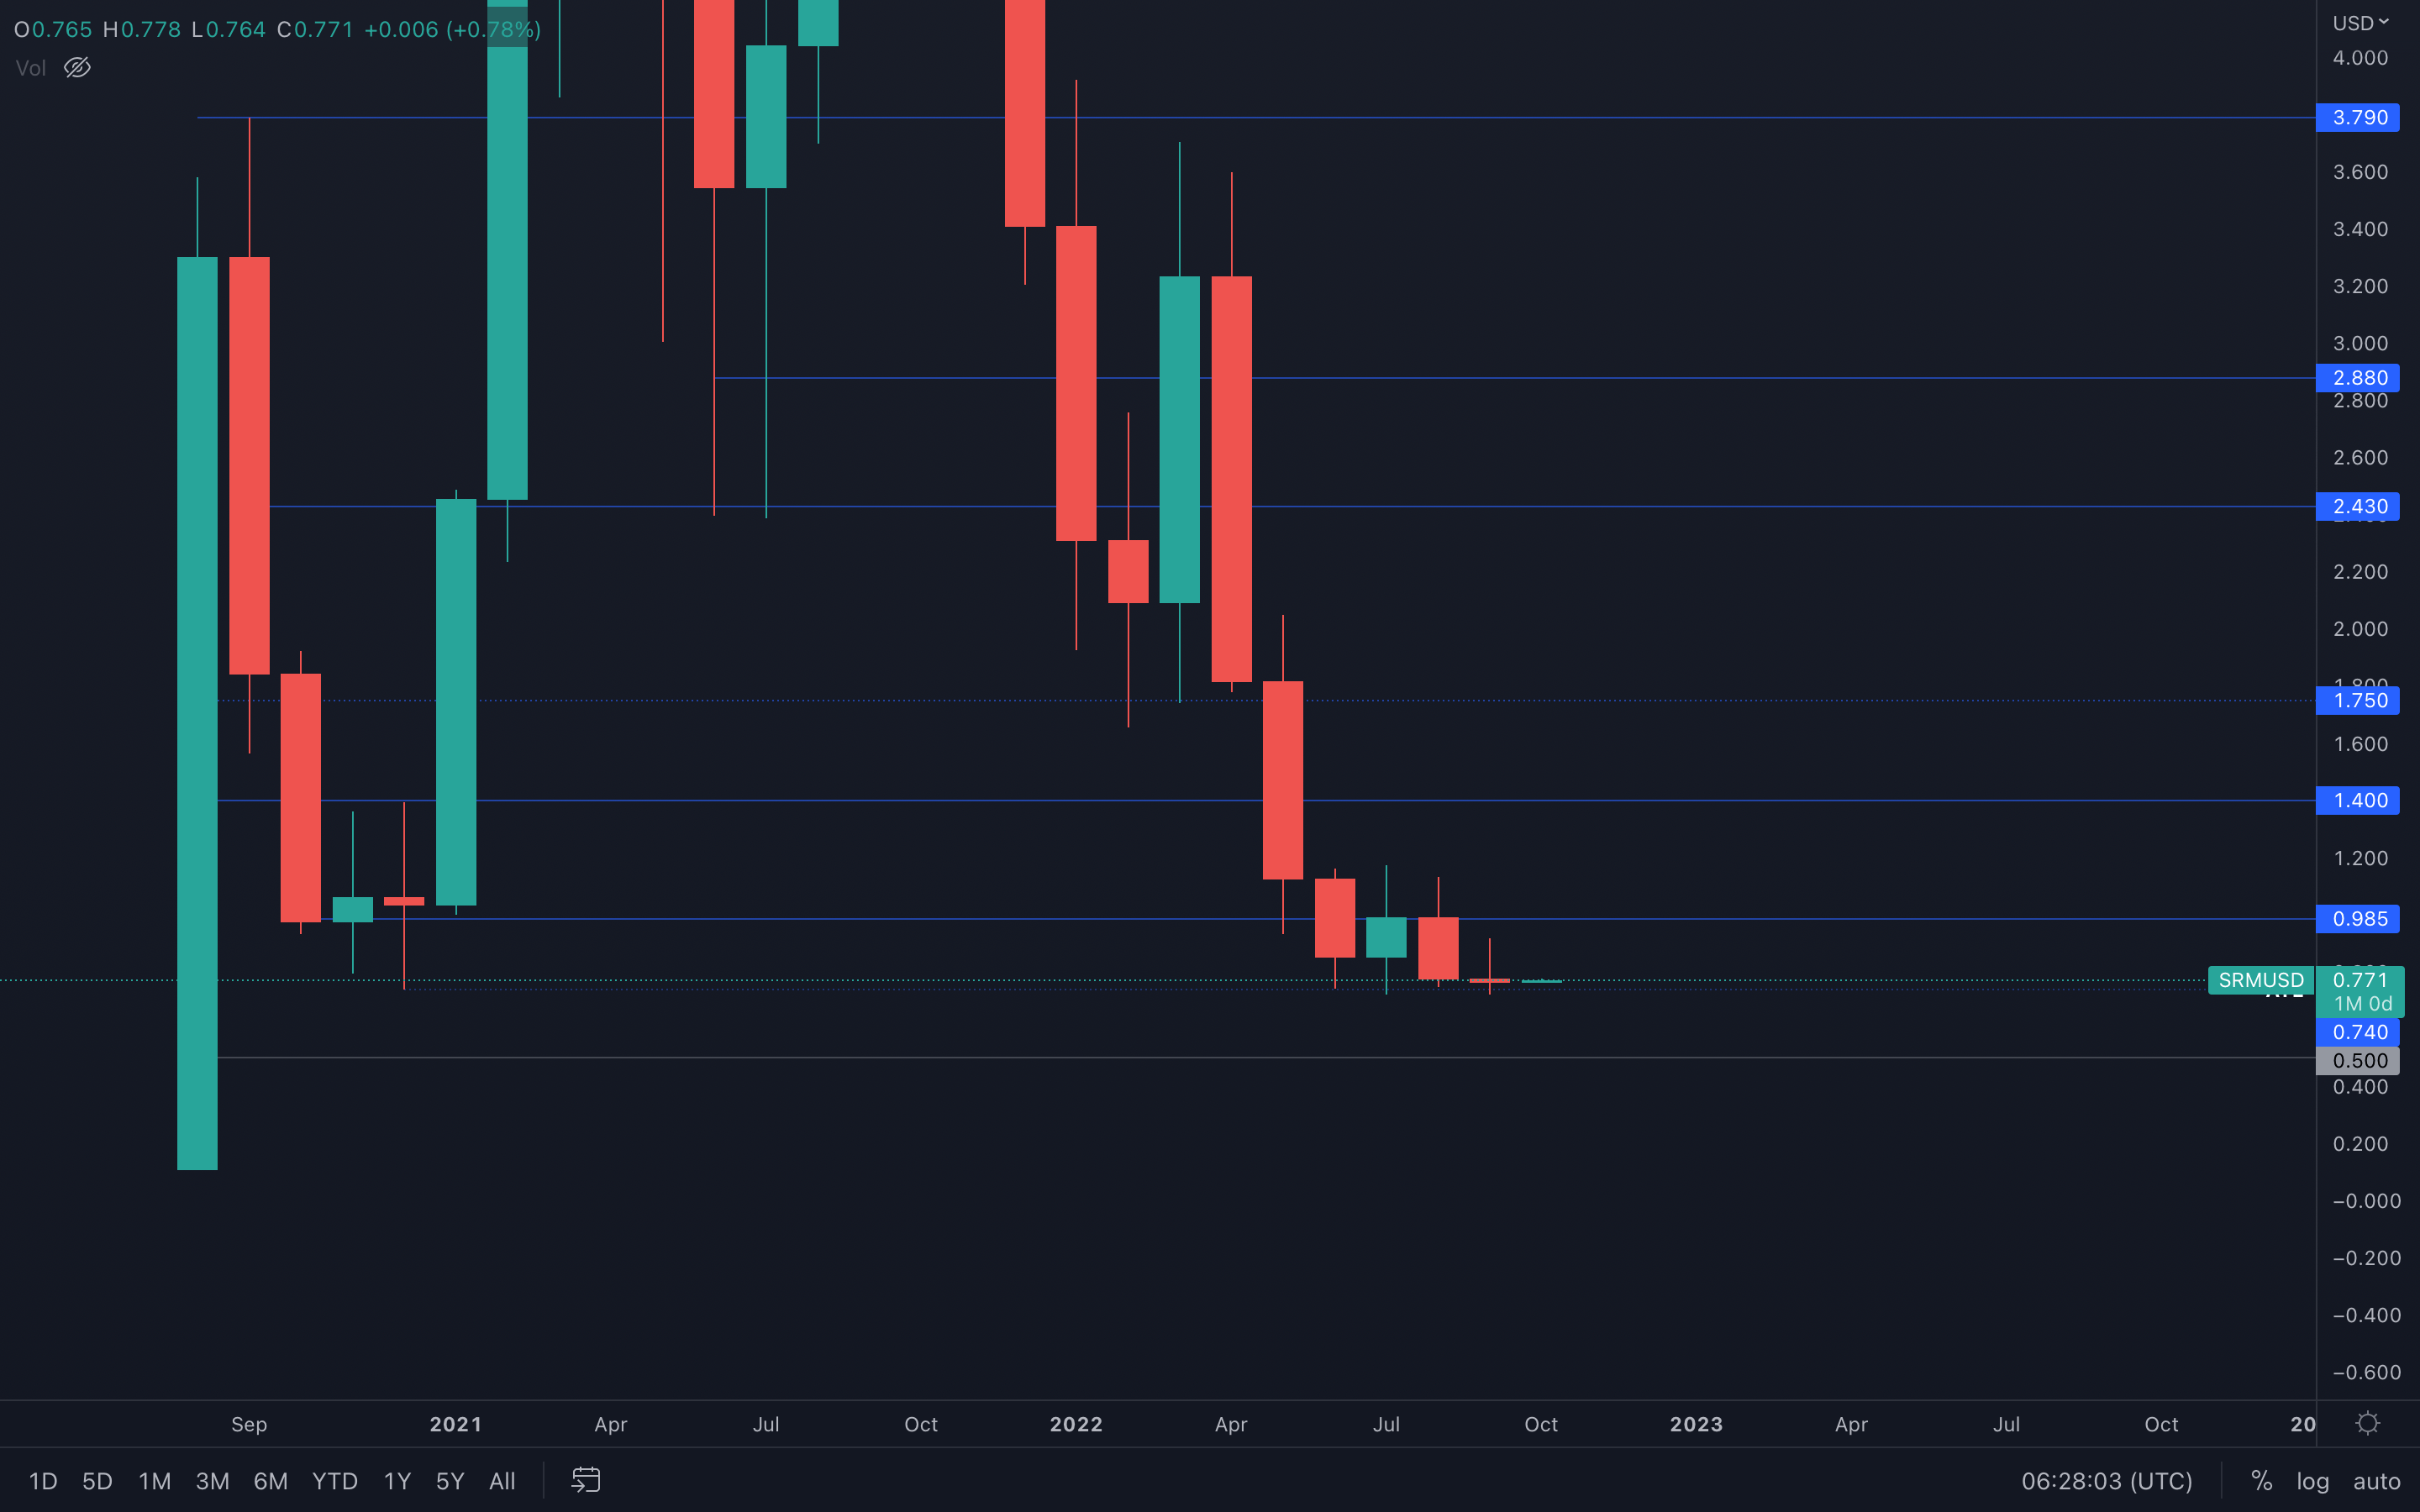 SRM has closed an even lower monthly candle closure than in previous months, indicating sellers have the upper hand. The asset can now be seen at all-time low levels and has been trading above the $0.74 level (all-time low) for the past four months.
The above suggests one thing - buyers are present and have interfered at every all-time low test, holding SRM's price above the respective level. Unless the asset loses the $0.74 level, then higher prices can be expected for October.
FTT
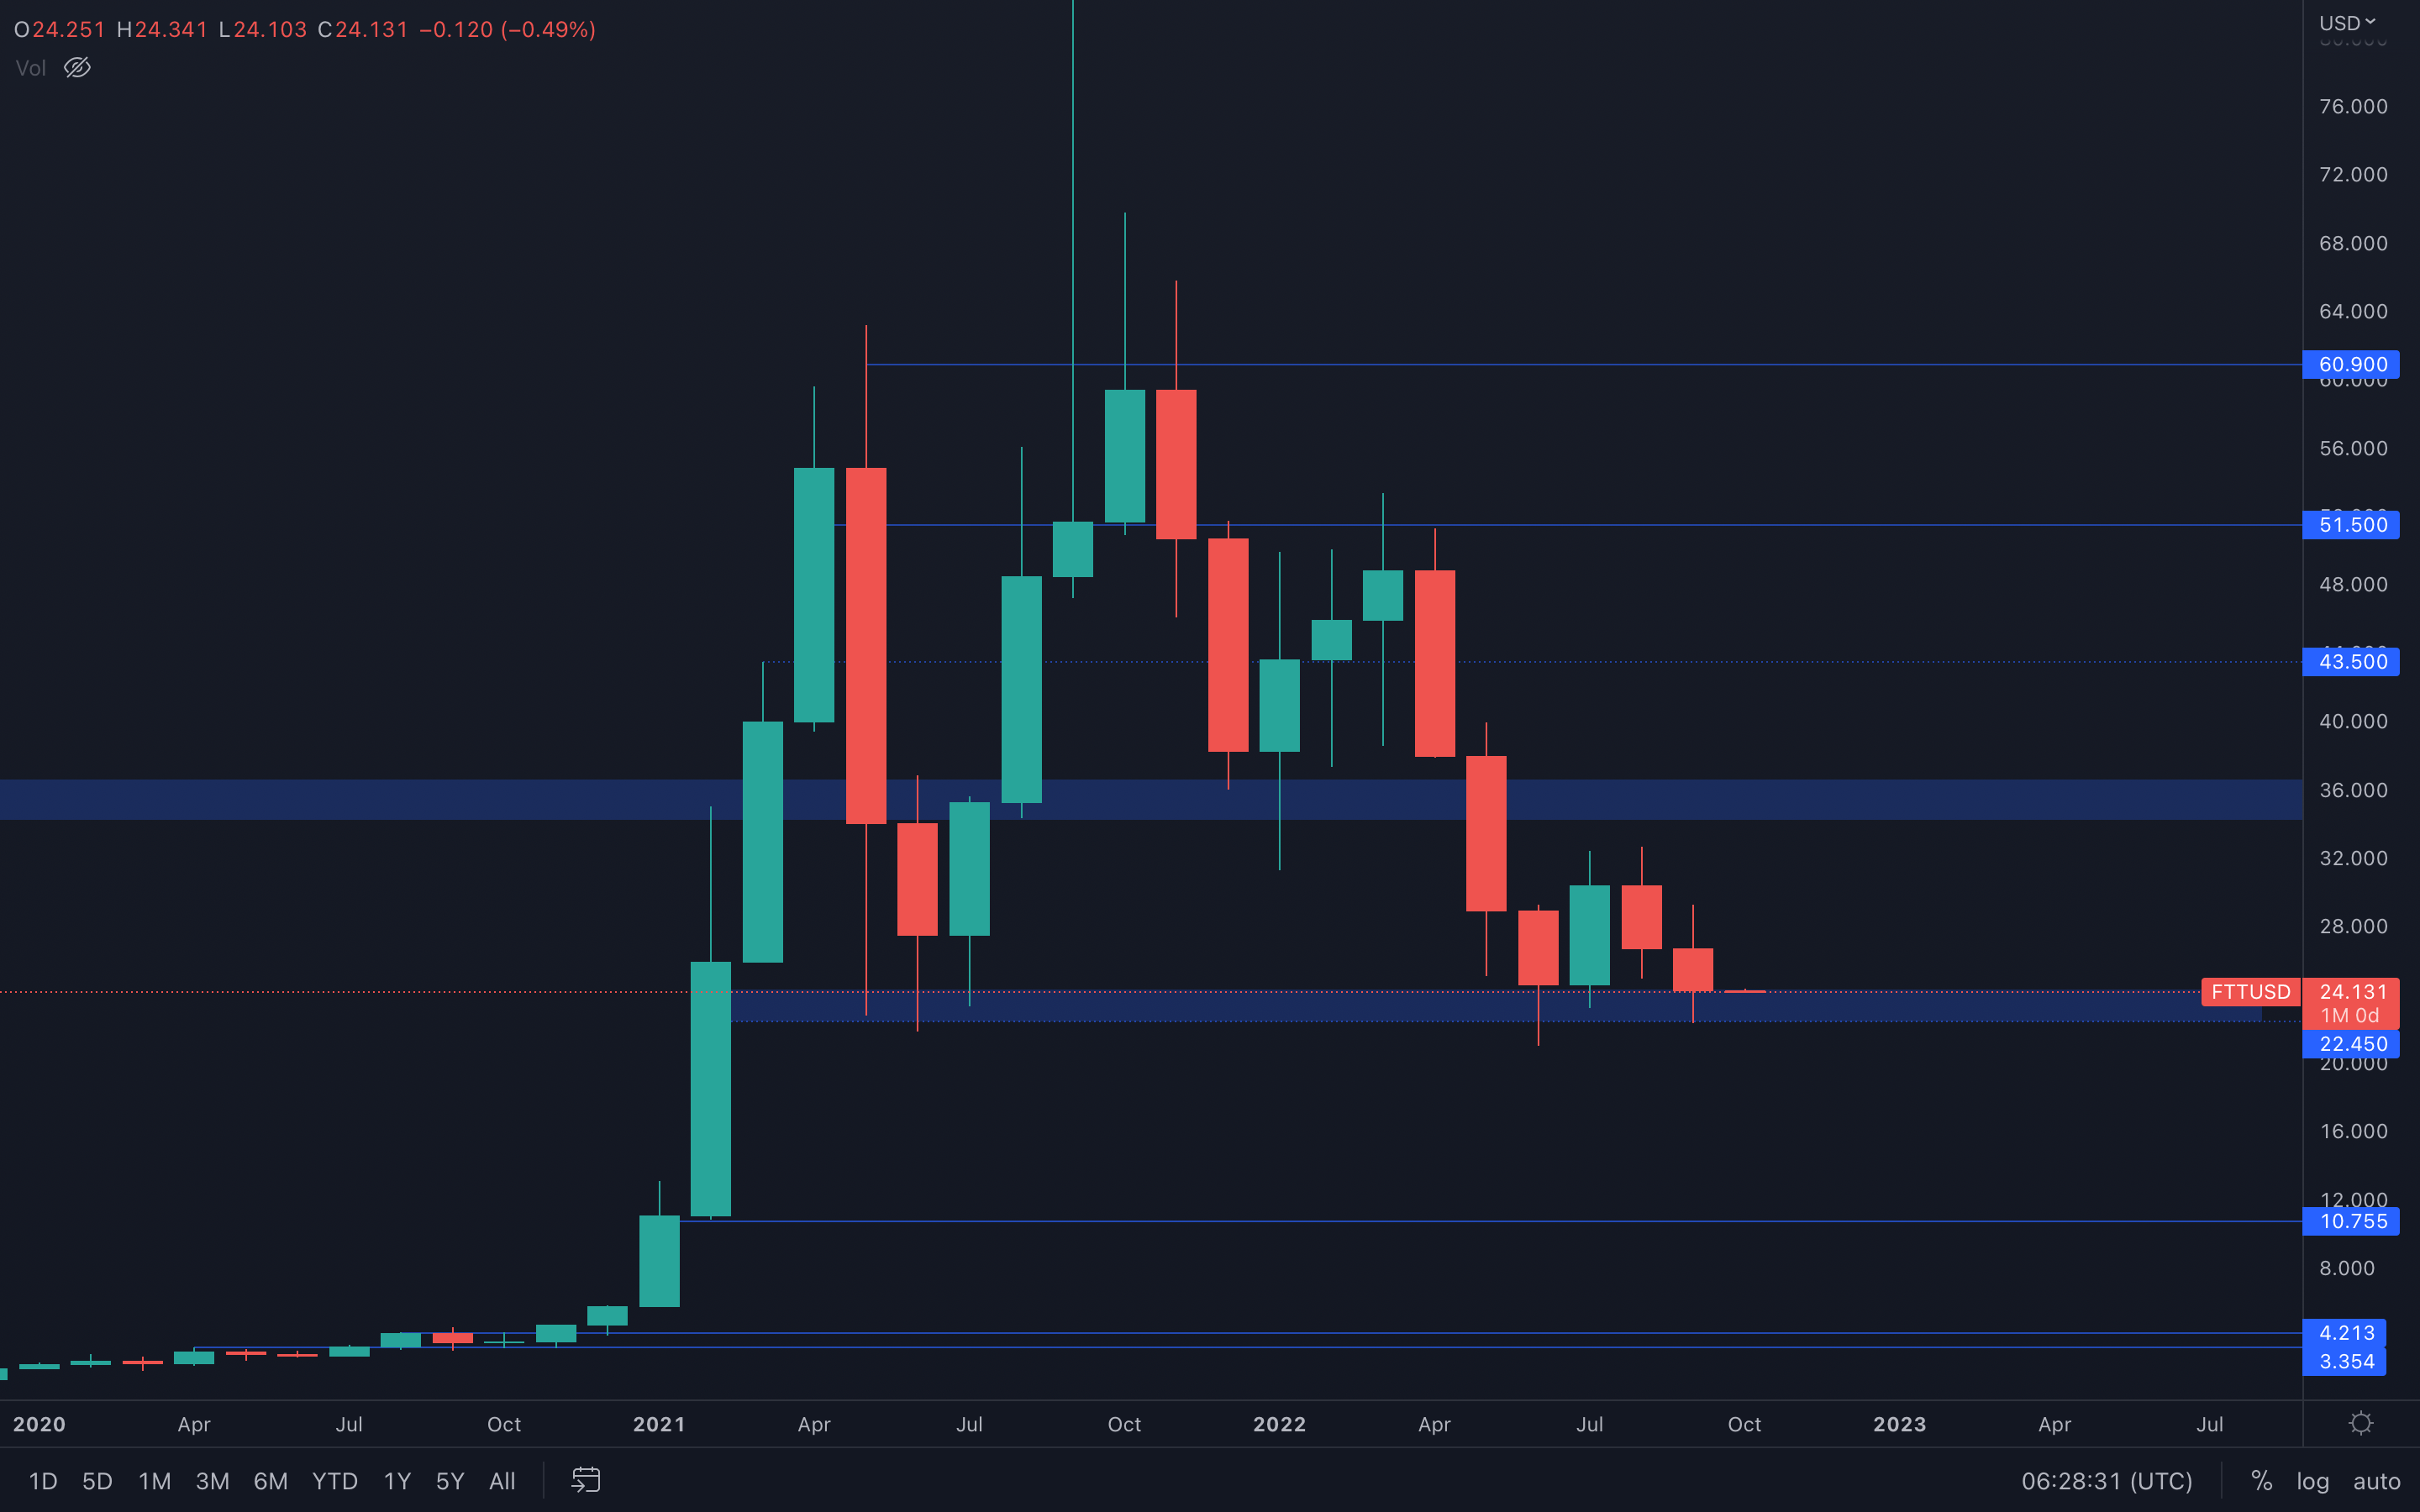 What happened to FTT in September is similar to what happened to DOT - FTT has closed a bearish candle into support - this is now a battle over control between sellers & buyers, which makes choosing a direction indecisive.
We need to understand who is in control right now, but we cannot do that by looking at the monthly timeframe here. For that reason, we dived into the weekly timeframe:
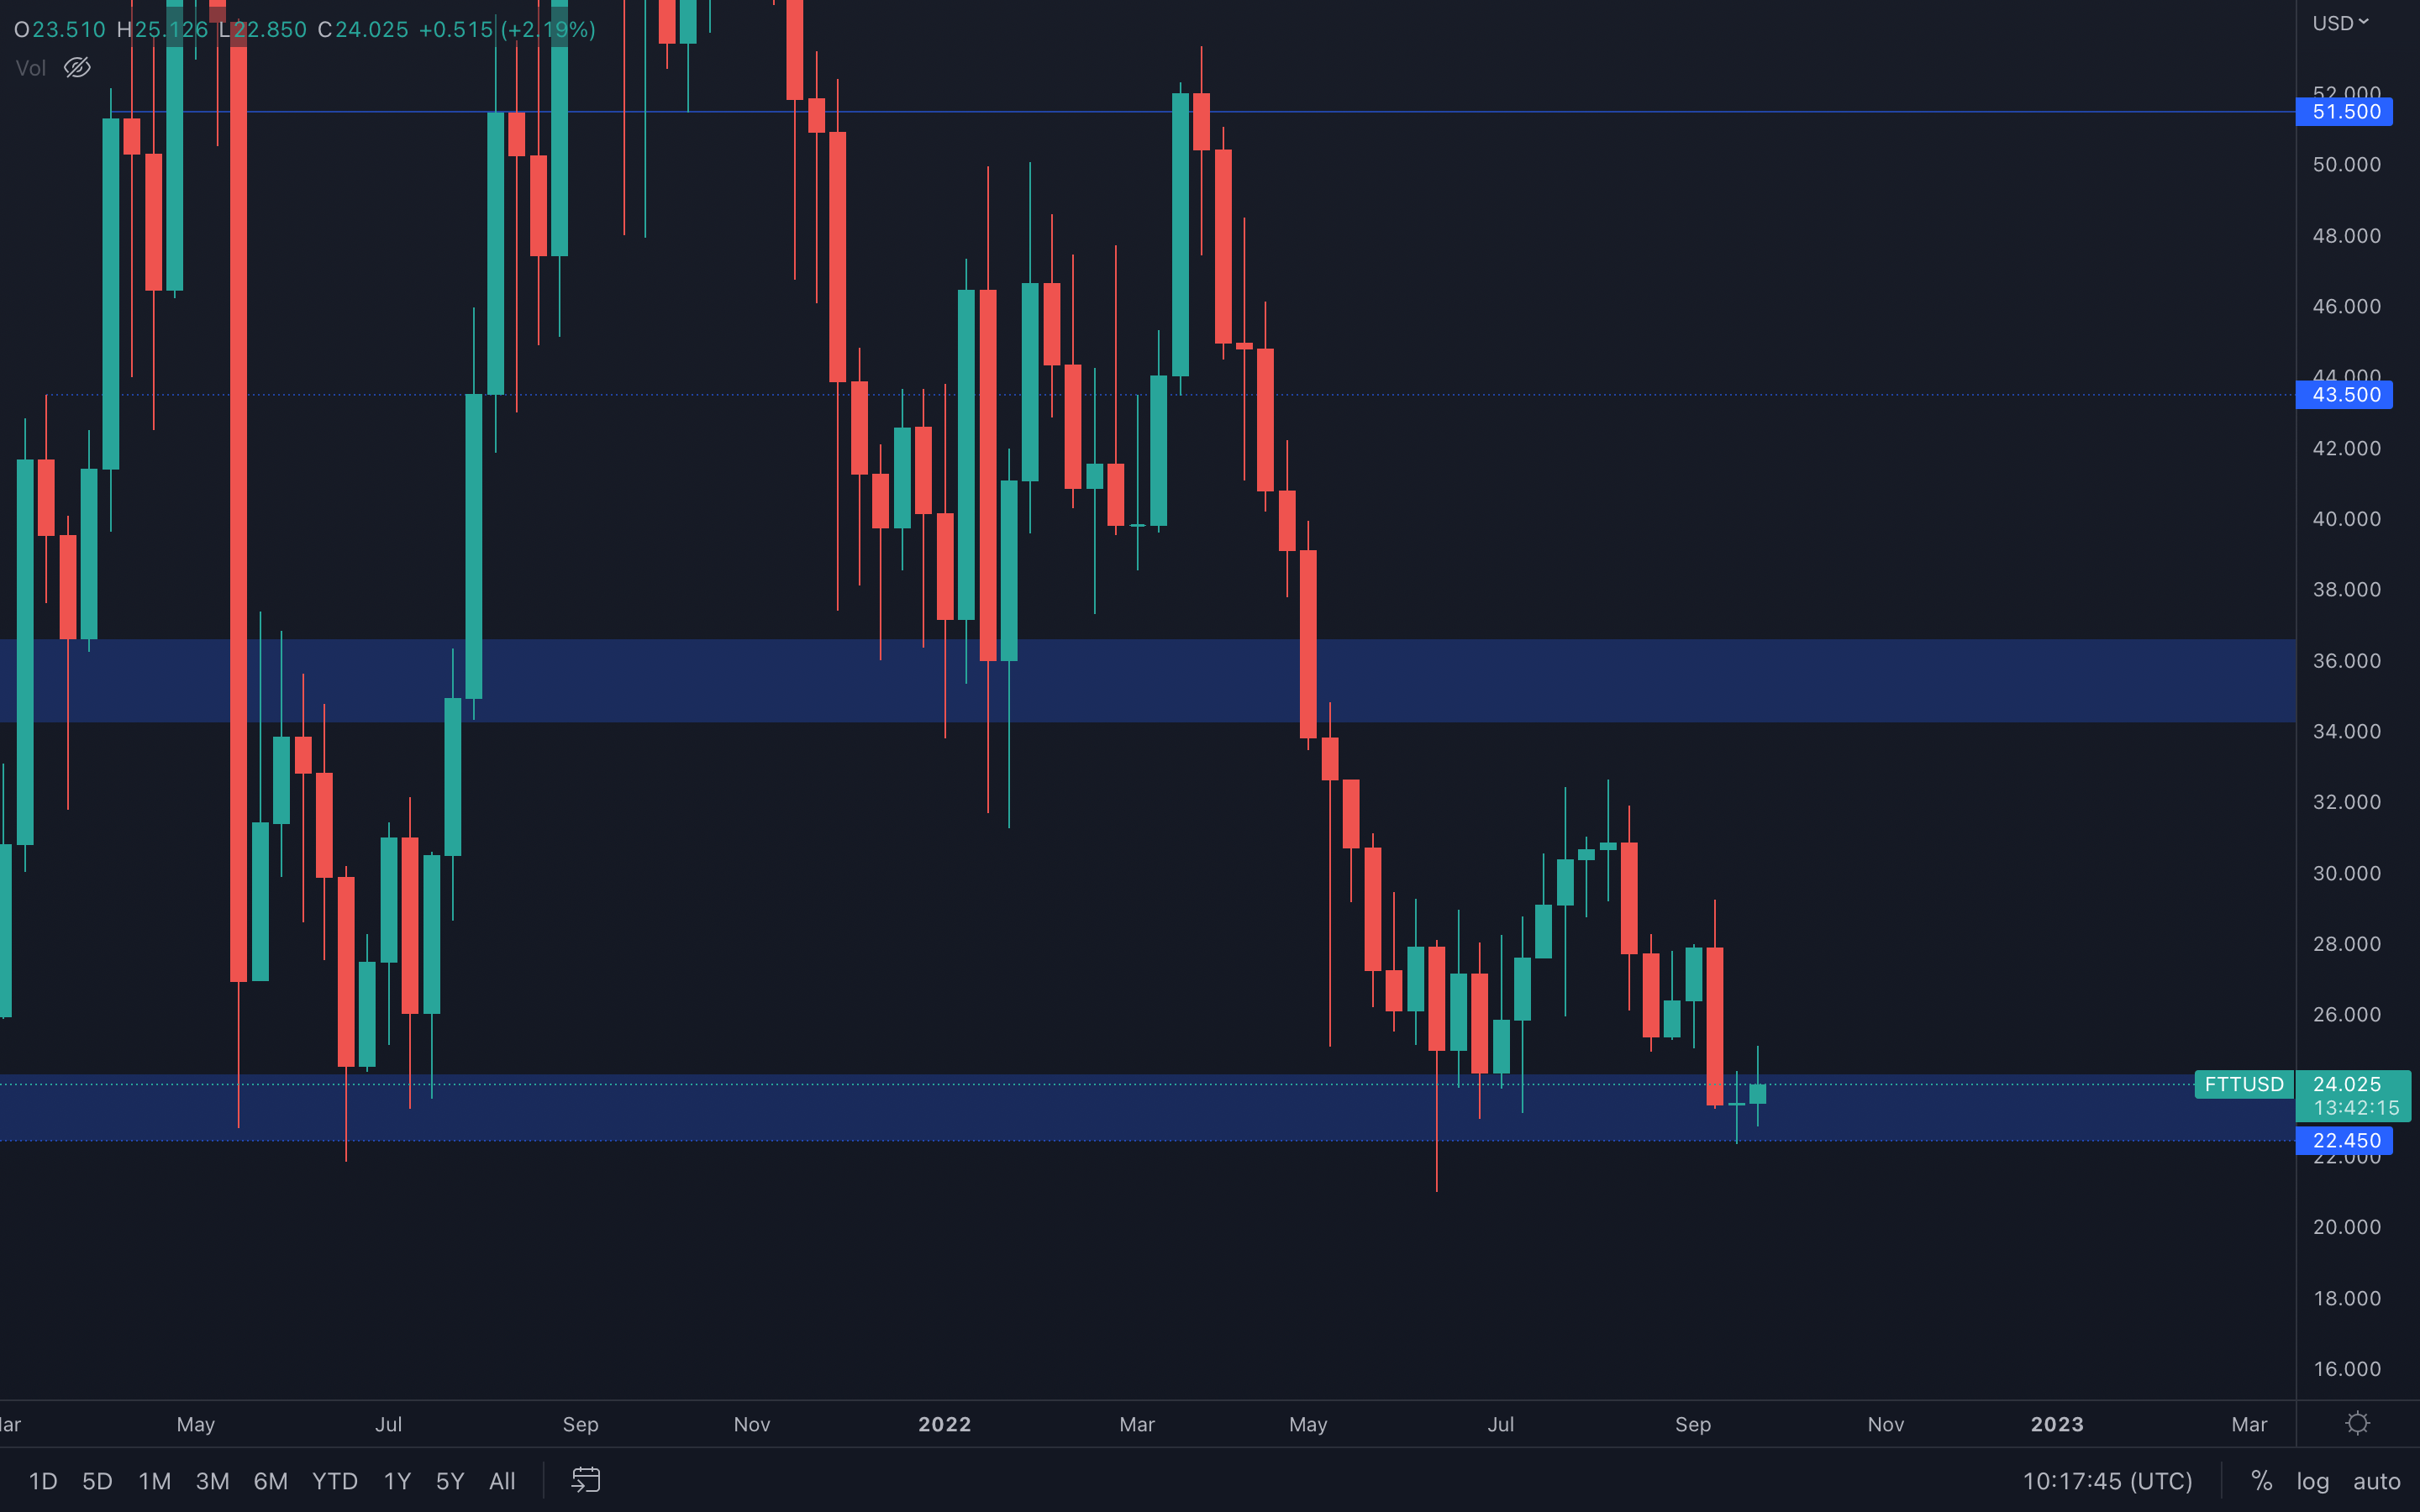
Here, we can see that FTT has perfectly bounced from the bottom of its current support area, which suggests buyers are currently in control. We can experience higher prices in the coming weeks if the buying pressure continues, most likely to the $30 level, which is also the middle of FTT's current range ($36 - $22.45).
In short, we should expect bullish momentum to occur this month toward $30. A weekly loss of $22.45 will push FTT to 1.5 years-old lows.
FTT - Weekly timeframe
MINA
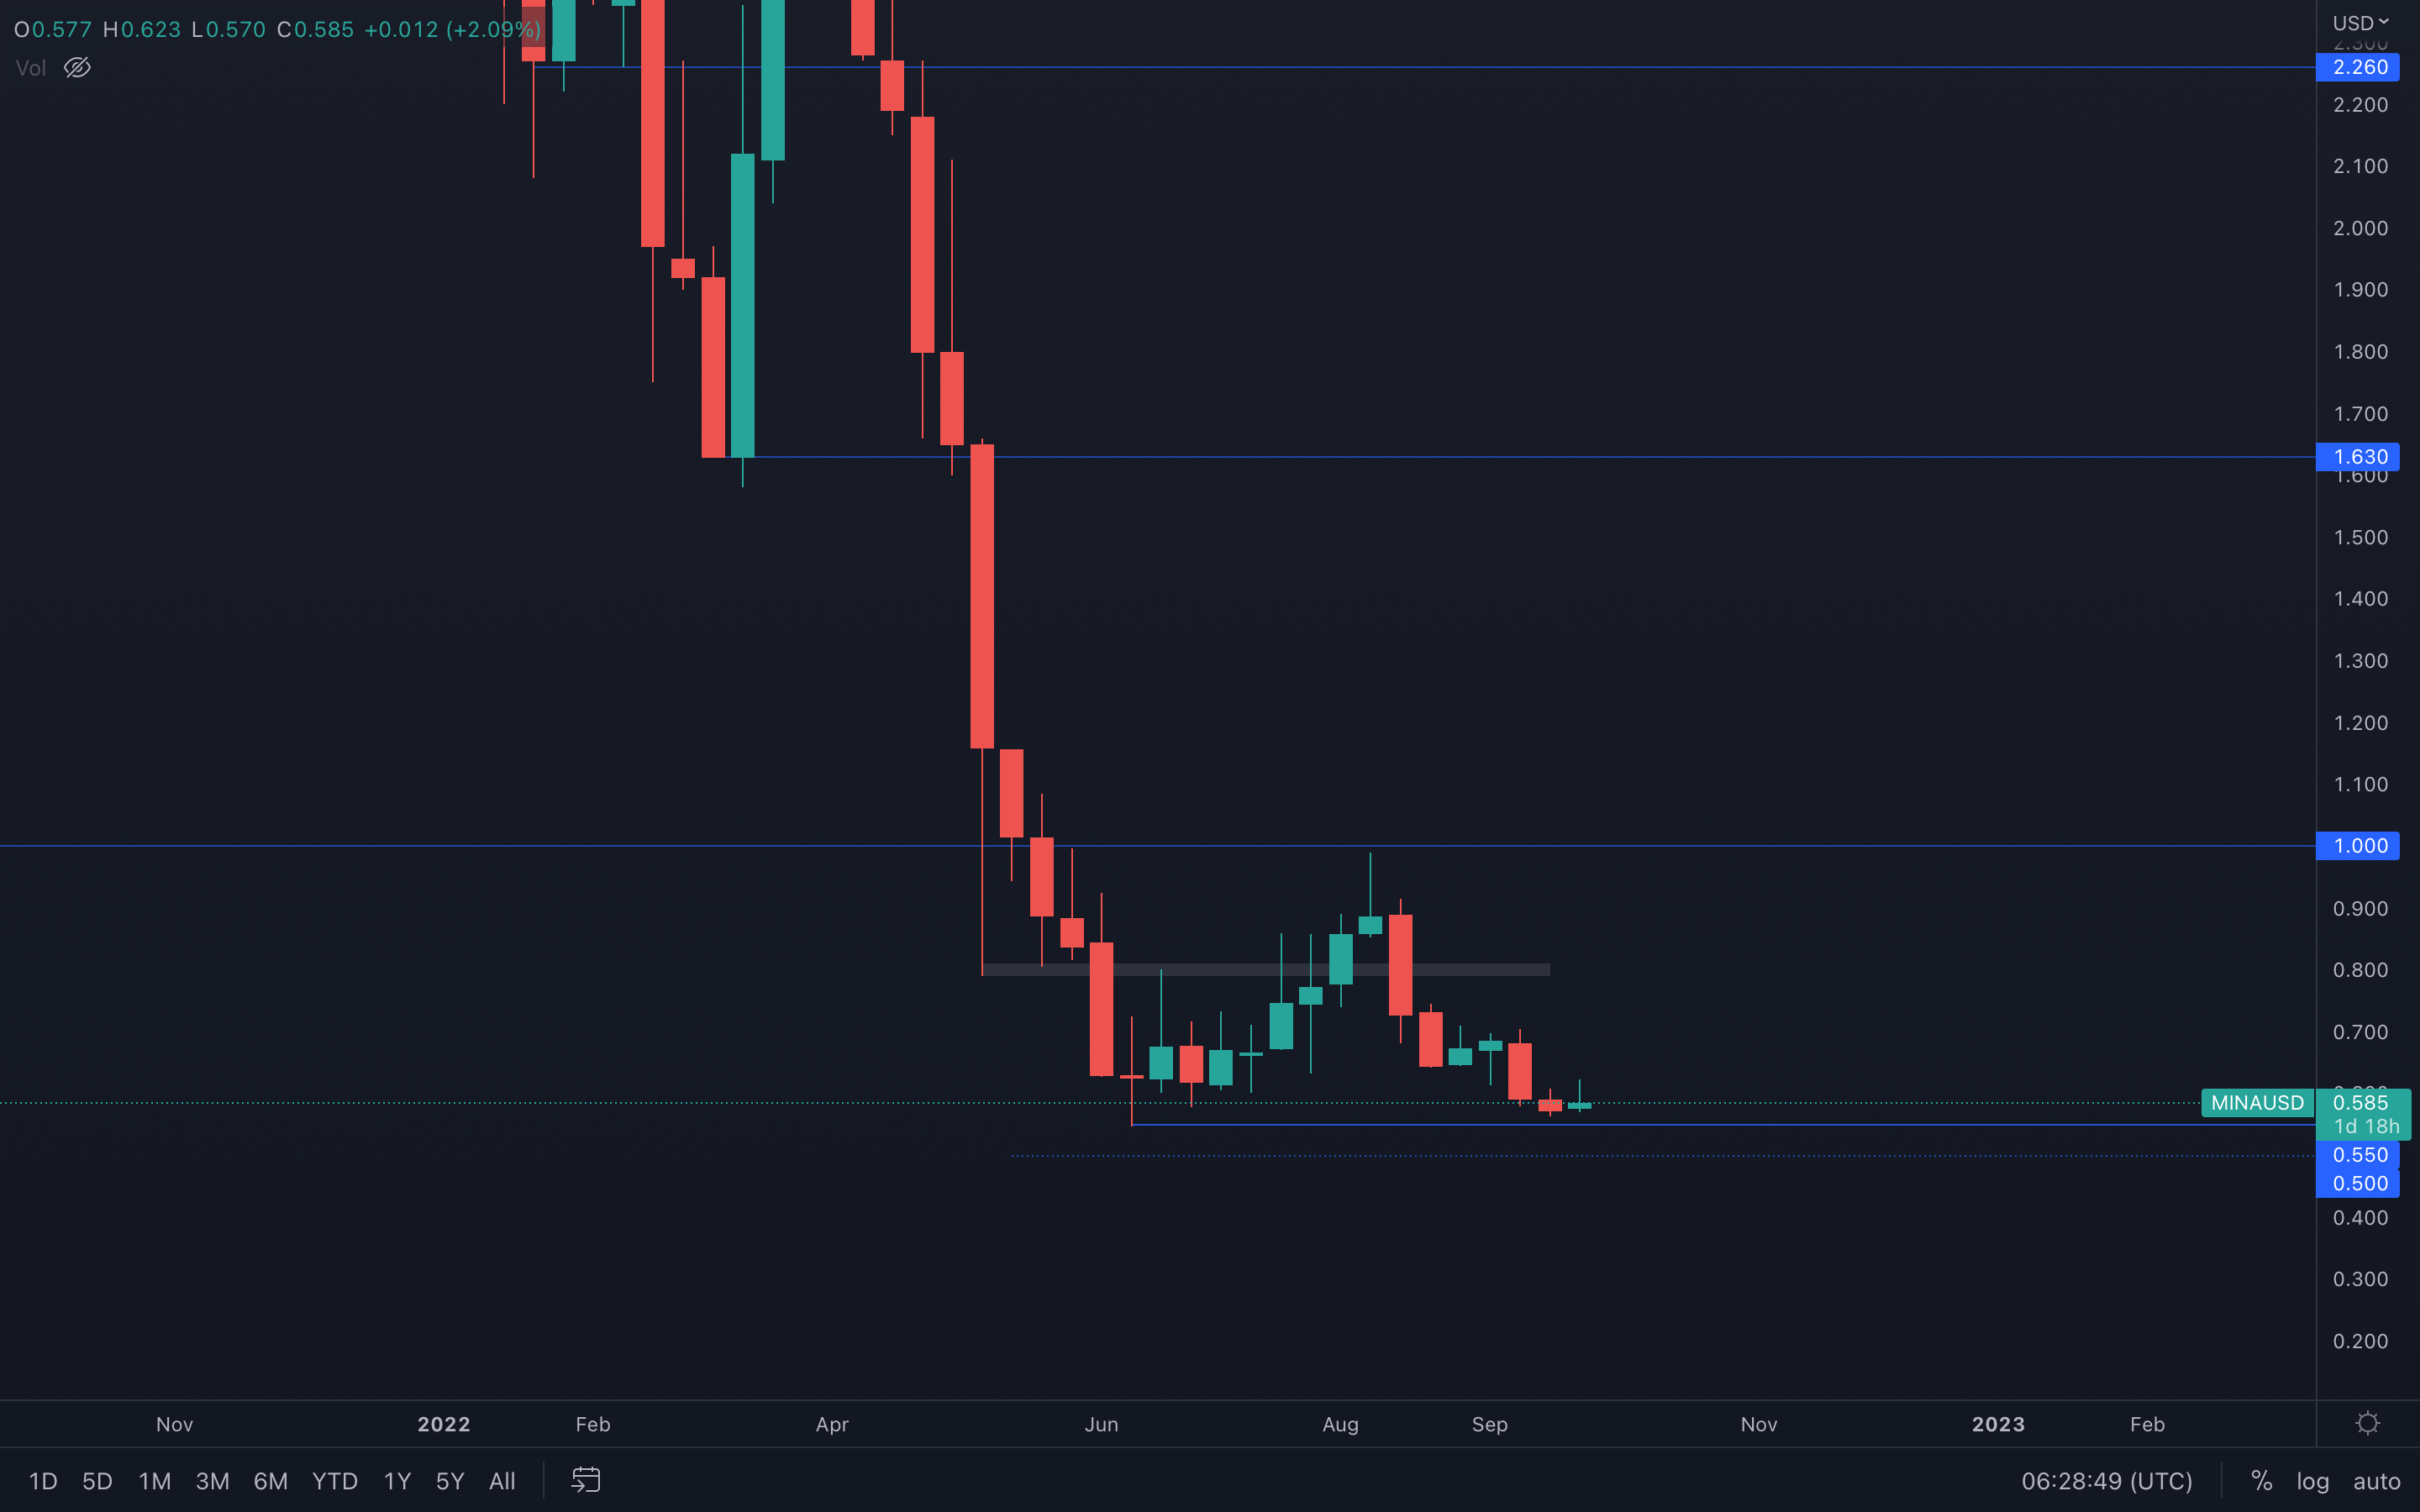 (Weekly chart was used)
MINA has closed an even lower monthly candle than in previous months, indicating sellers are still in control. The asset is now close to its June lows but has seen some buying pressure this week. We can spot that by looking at the candle itself, specifically the wick.
(Weekly chart was used)
MINA has closed an even lower monthly candle than in previous months, indicating sellers are still in control. The asset is now close to its June lows but has seen some buying pressure this week. We can spot that by looking at the candle itself, specifically the wick.
The buying pressure has come down but the candle is still about to close bullish. If MINA can close green this week, then MINA can experience another increase in buying pressure next week or even in the next weeks.
DYDX
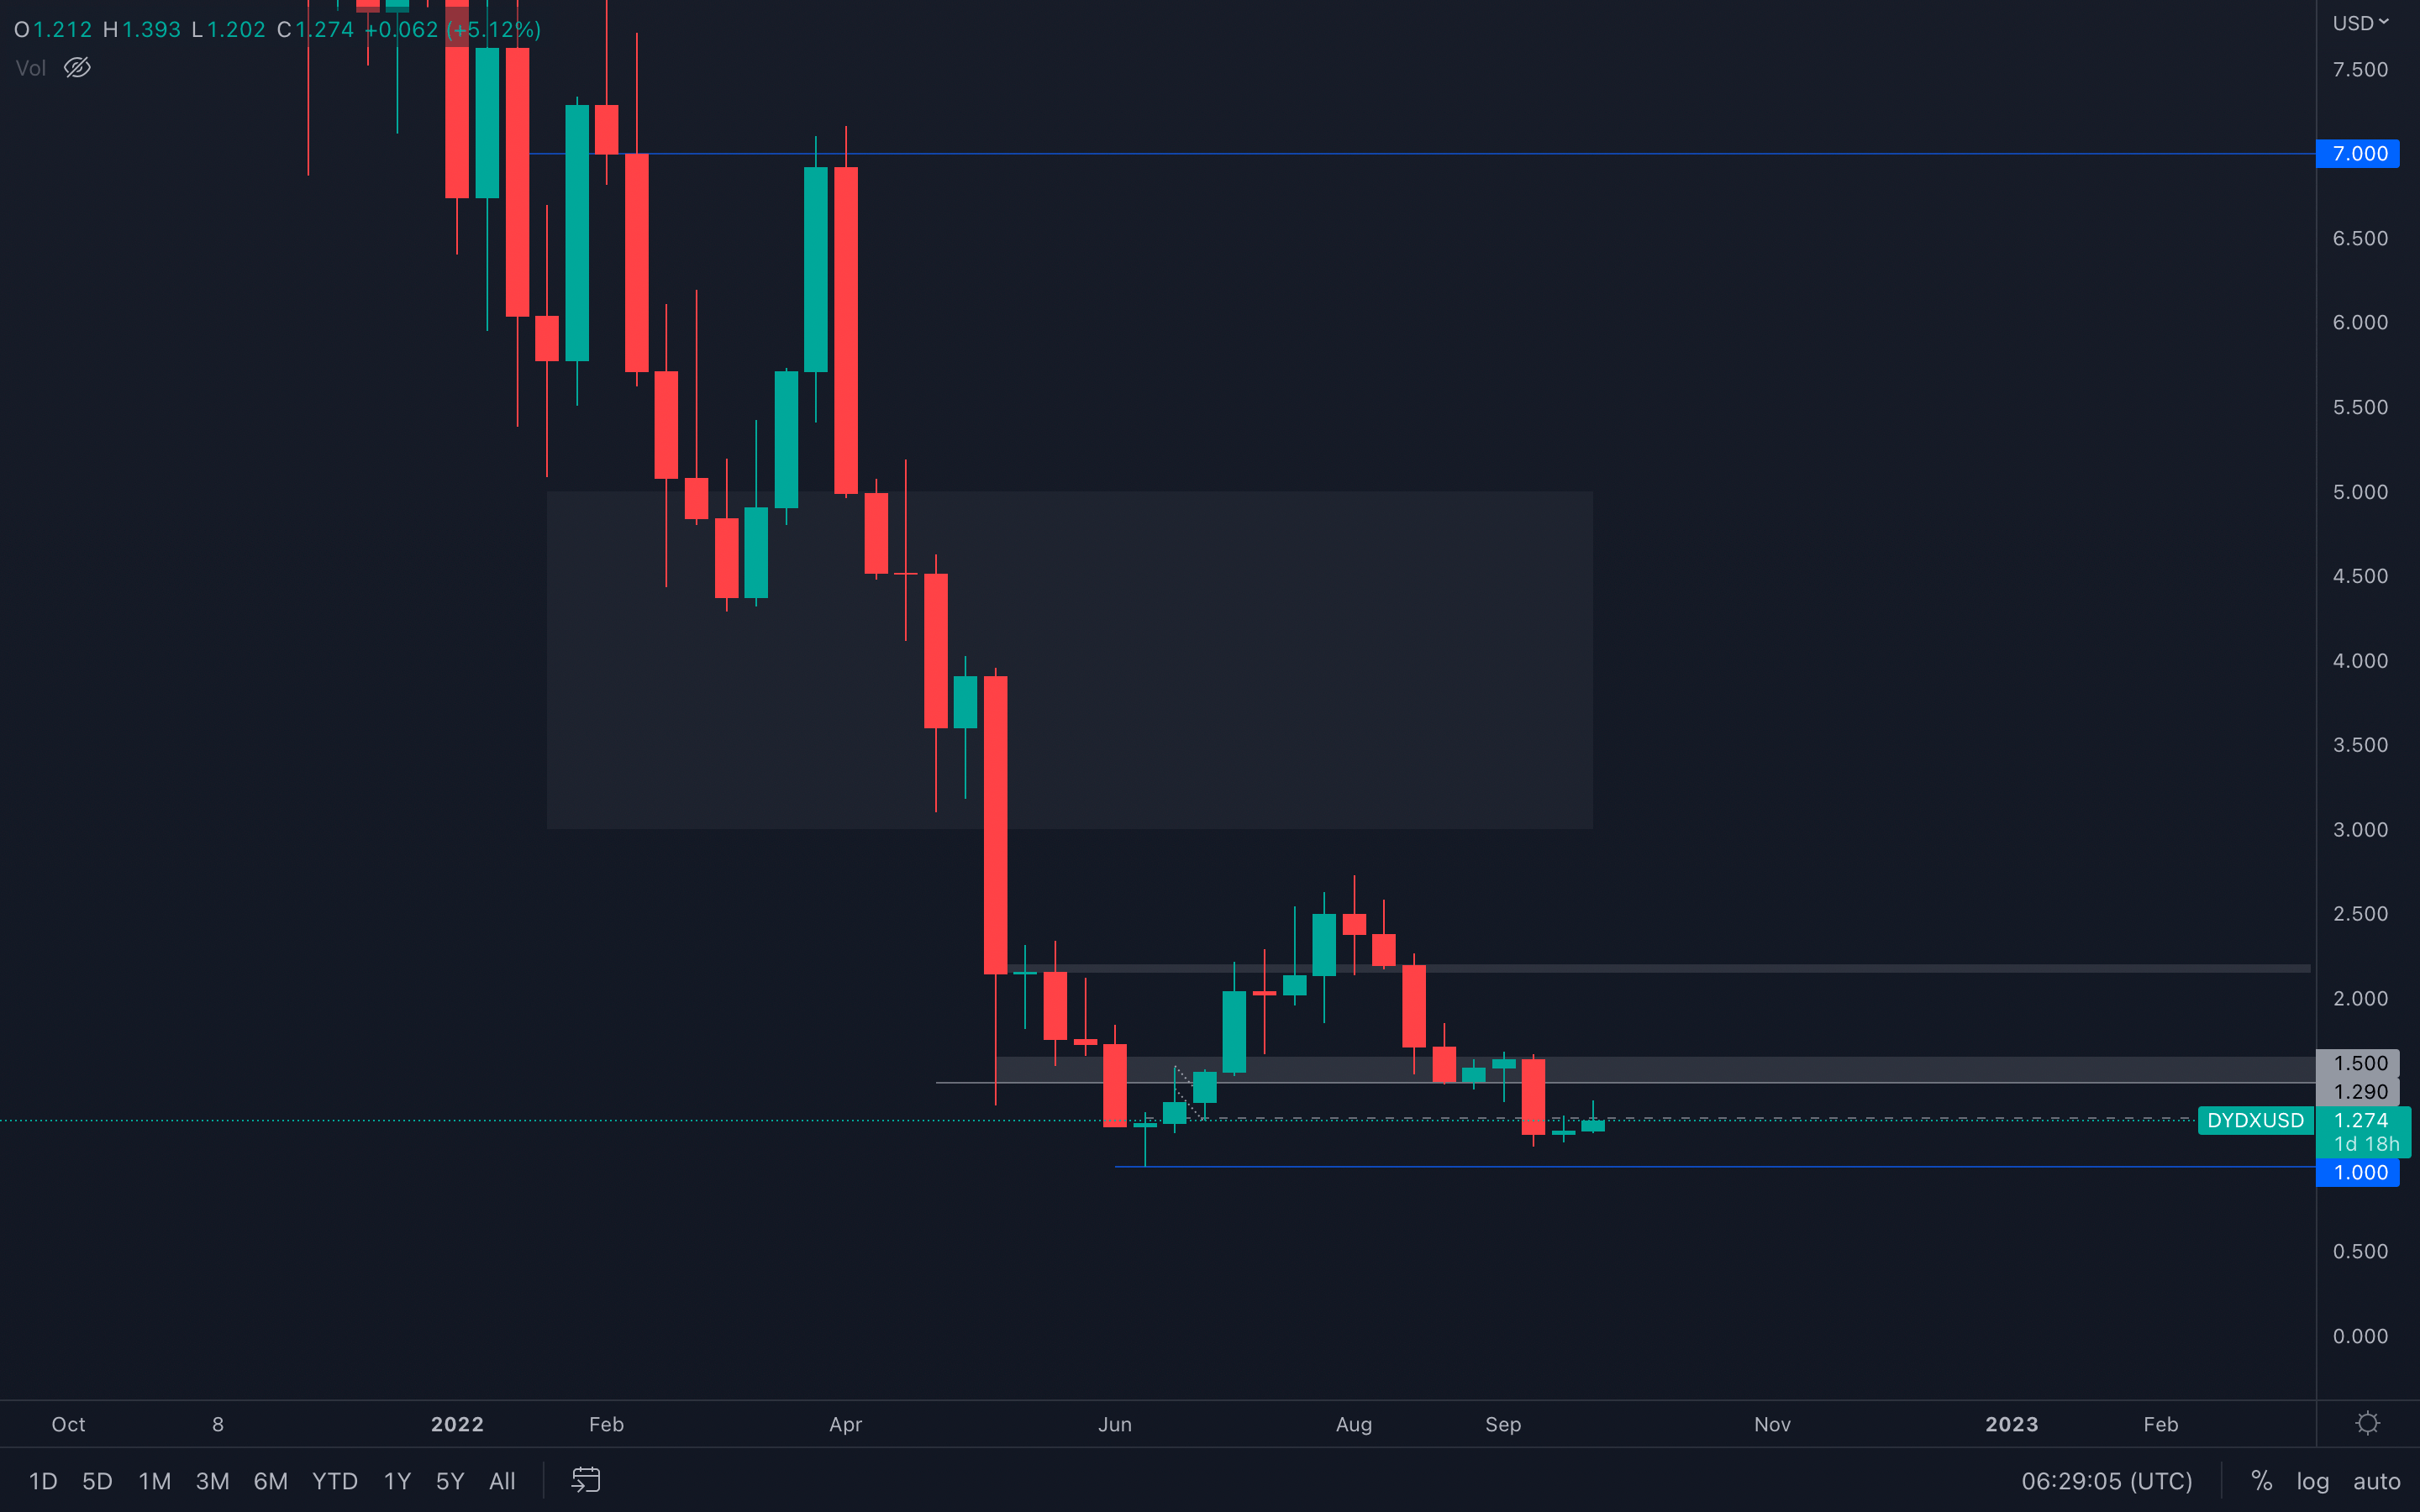 (Weekly chart was used)
Similar to SOL, dYdX closed green last week, indicating a higher buying pressure compared to other assets in this report. The asset then went as high as $1.394 this week, with sellers coming in pushing dYdX's price lower before the weekly closure.
(Weekly chart was used)
Similar to SOL, dYdX closed green last week, indicating a higher buying pressure compared to other assets in this report. The asset then went as high as $1.394 this week, with sellers coming in pushing dYdX's price lower before the weekly closure.
With that said, it's now time to analyse directions. We can see that after the small green candle was registered two weeks ago, a weekly level has been marked at $1.20 after the price of dYdX held its June lows and took the respective level as support. With support just under the current price, we can assume dYdX is now going to test its next resistance level sitting at $1.50.
This scenario is valid only after a weekly closure above the intermediate support of $1.29 highlighted on the chart. If this doesn't occur, then dYdX will turn and head lower toward its psychological and technical level of $1.
Summary
Historically, October has seen bullish results over the years. We know for a fact that past data is used to analyse future price movements, that's what technical analysis is at its core. But overall, there aren't many bullish reasons for October to close bullish once again. On the contrary, the macro environment continues to evolve in a negative way.It can be said that both Bitcoin and Ether are in “value territory” and current prices could represent good long-term buying prices. However, there are a number of macro headwinds we may still have ahead of us; the FED likely has another 150 basis points to raise rates, will something break in this time? Alongside this, there seem to be increasing tensions in the Ukraine/Russian war which could see the prices of all assets collapse if the war were to escalate to a nuclear level, although this still remains highly unlikely.
Recommended from Cryptonary


