Save 23% ($351) & Get a Free 1-1 Call with our Team ⏰ : 0d 2h 59m 43s

Disclaimer: Not financial nor investment advice. You are responsible for any capital-related decisions you make, and only you are accountable for the results.
Summary for August '22
- Total Market Cap: -9.93%
- Altcoins Market Cap: -7.02%
- The smallest Bitcoin wallet cohorts have slowed in their accumulation whilst distributing Bitcoins from the largest Bitcoin wallets has significantly slowed. Yet, aggressive accumulation from these larger Bitcoin wallet cohorts has not begun.
- The Net Realised Profit/Loss shows that investor sentiment is low, and investors do not currently have the conviction that they'll see high prices and are therefore selling coins into break-even levels.
- The Realised Price by Address shows that the 10 – 100 Bitcoins wallet cohort has provided the final support for Bitcoin's price in the last two major bear markets. This current level in the 2022 bear market stands at the late $12,000 area.
Total Market Cap
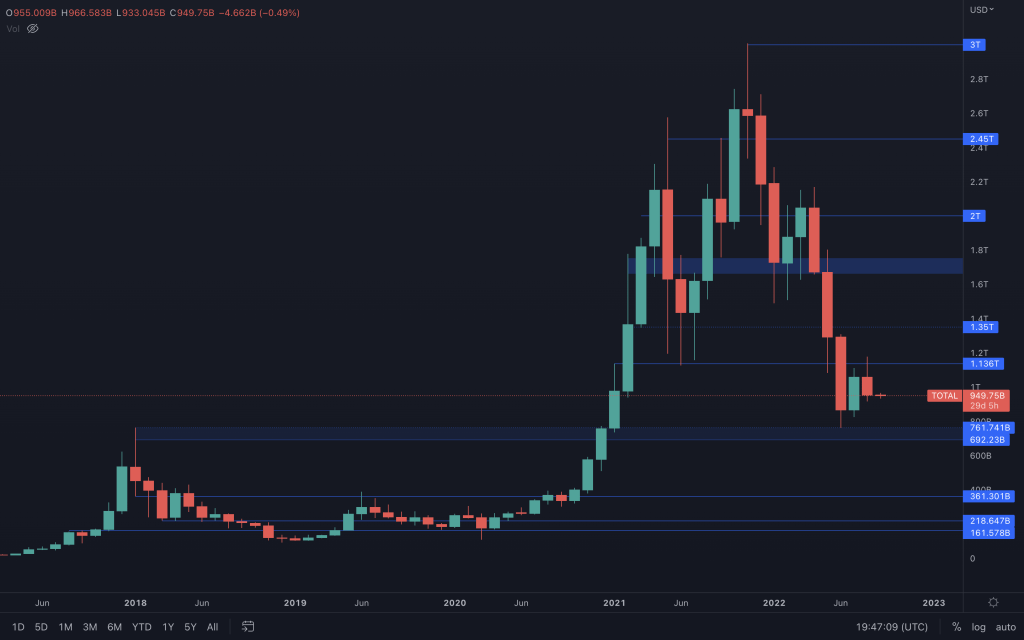
Last month’s candle closure did nothing to alleviate the threat of the market heading lower. Granted, we’ve seen more bearish lower highs. But failing to close above $1.136T, and closing below $1T shows that bulls are not ready to risk on, certainly not with any real conviction. It continues to be a case of taking profits from relief rallies. To draw a conclusion, with another monthly closure below $1.13T, we aren’t able to rule out the market revisiting the 2018 highs once again. But the market is highly influenced the Fed’s actions of late. So we’ll make sure to keep you up to date on developments as and when they happen. Is this September going to continue with the trend of the preceding years and close red? 2016 was the last time the Total Market Cap saw a green September.
Altcoins Market Cap
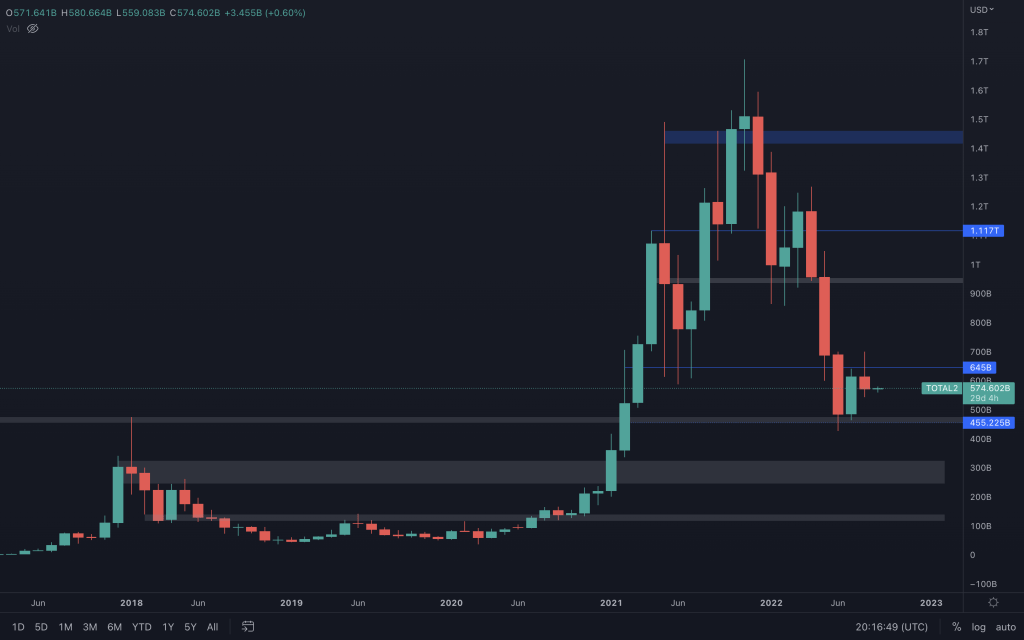
The same can be said for the altcoins market cap. During August, it had a weekly candle closure above $645B. Still, there was an immediate lack of conviction by investors who sought to take profits over the following week, eventually forming a bearish engulfing candle. After seeing Altcoin's Market Cap retest its intermediate weekly support close to $550B, there is a possibility of slight relief. Still, all timeframes continue to paint a bearish picture at present. Don't let hope cloud your judgement. This is still a bear market where supports turn into resistances until we can identify characteristics of a bottom. Right now, the market has yet to present that.
S&P 500 Index (SPX)
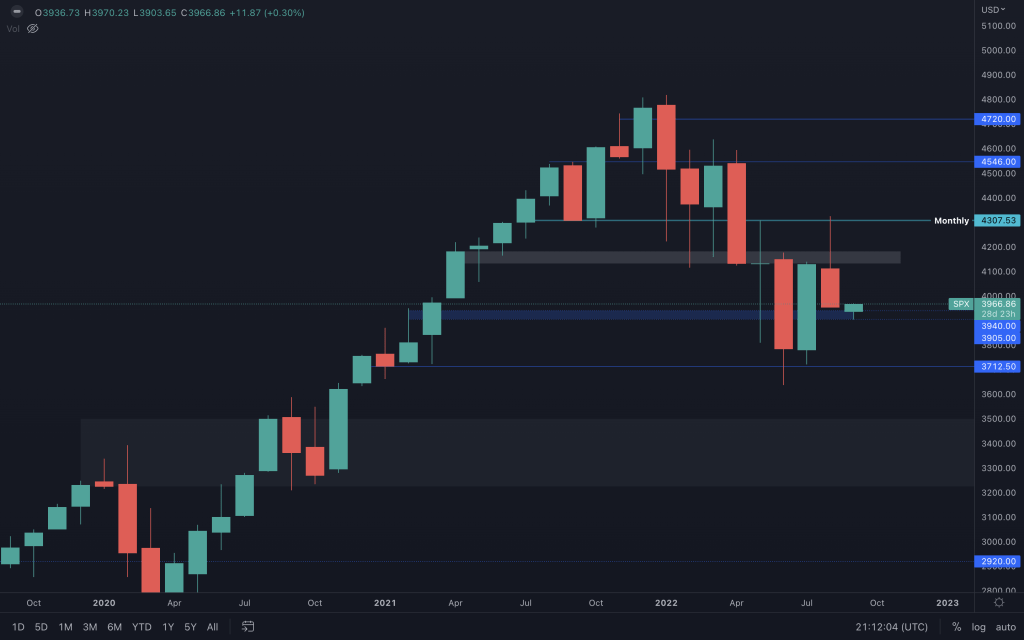
We were aware beforehand of the significance that $4,300 held for SPX. The second half of July started a slow grind from $3,700 to eventually test monthly resistance at $4,300. With the importance of this level (and a mixture of a lack of conviction after Jerome Powell's Jackson Hole speech) came an opportunity for investors to cash out. And cash out they did, straight to $3,900. Naturally, $3,900 (a weekly level) is offering some support, as it needs to hold for SPX to change its market structure. But we have seen this setup before (in March), and it didn't end well. Any relief here could reflect across the crypto market in the short term. But without market sentiment or a structure change, it's more likely that SPX will continue inside the wedge we've highlighted in prior daily and weekly analyses. Closing below $3,900 on the weekly timeframe would bring about $3,700 and likely further downside across the crypto market.
Bitcoin – Technical Analysis
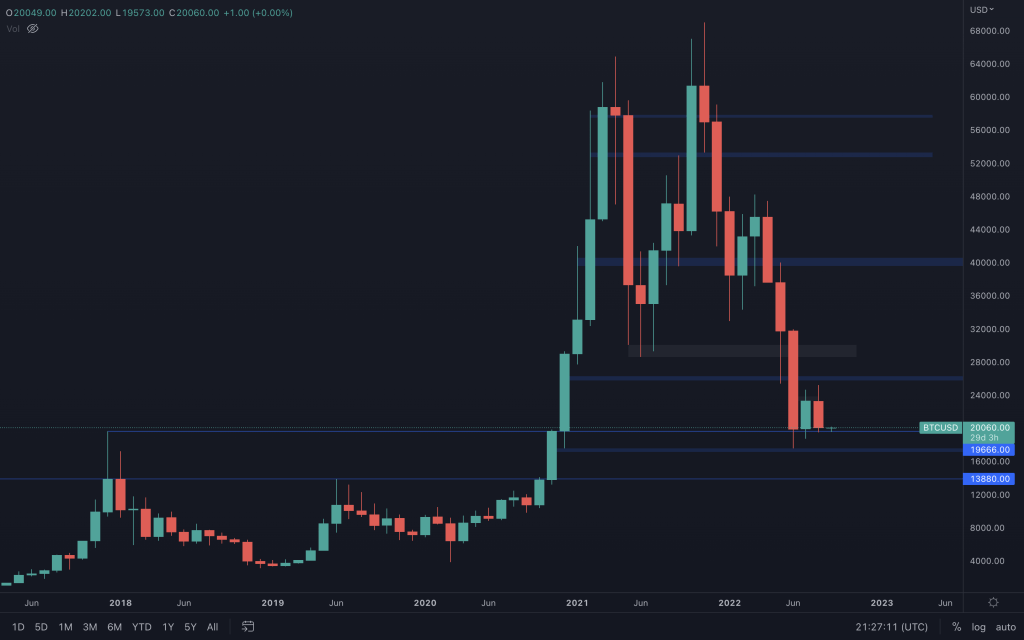
Unfortunately, the only thing that the monthly candle indicates is indecision across the market as it has ranged within the same price range as the previous month. Indecision is never a nice term to hear, as we all want clarity from the chart that we are looking at. The $20,000 level wasn’t broken by the monthly closure, which, although it wouldn’t have looked good (key level lost and bearish engulfing), it would have at least given an indication of where its price is likely headed over the next month. The question here is who tires first, bulls or bears. After losing the old primary supporting trendline, the lower timeframes are in bearish territory but a tight range. Only closing above $21,700 would present an opportunity to change that.
Bitcoin Dominance
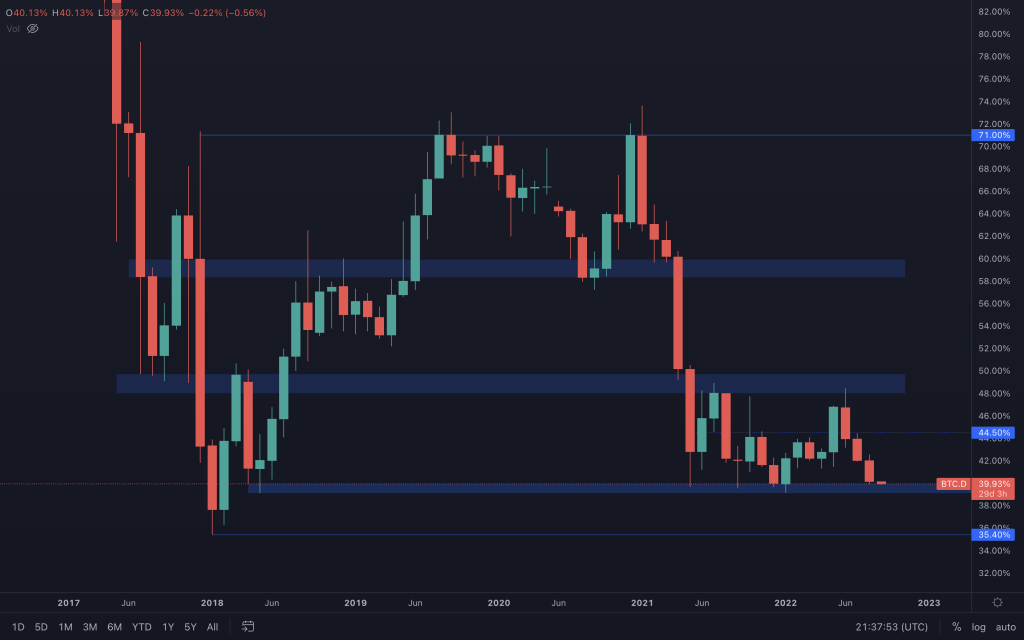
Bitcoin Dominance is sitting at its 39%-40% support. There's no indication of a reversal yet, but it's worth keeping an eye on.
Bitcoin On-Chain analysis
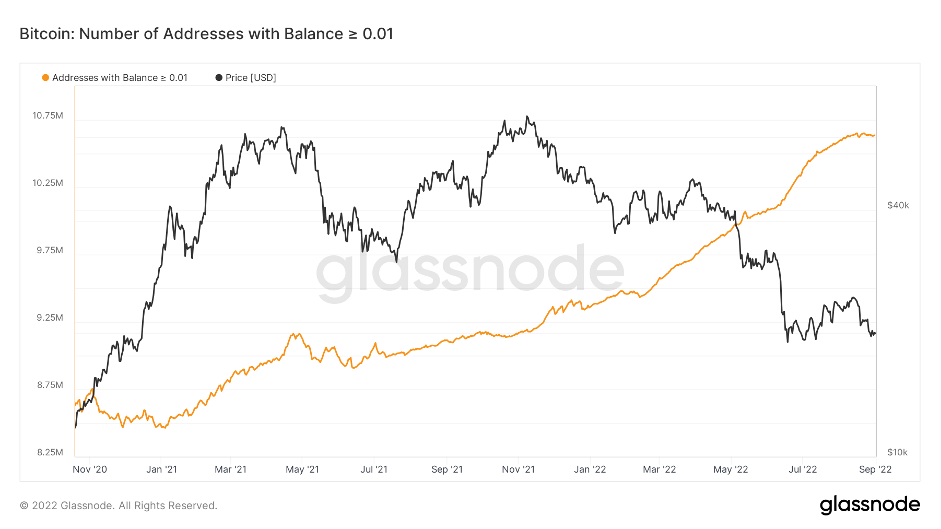
Metric 1 – AddressesThe first of these metrics is the Addresses metrics. We track these metrics to assess what cohorts of investors are doing with their coins – are they distributing or accumulating? These metrics are split into groups of wallets by the amount of Bitcoin or Ether they hold.
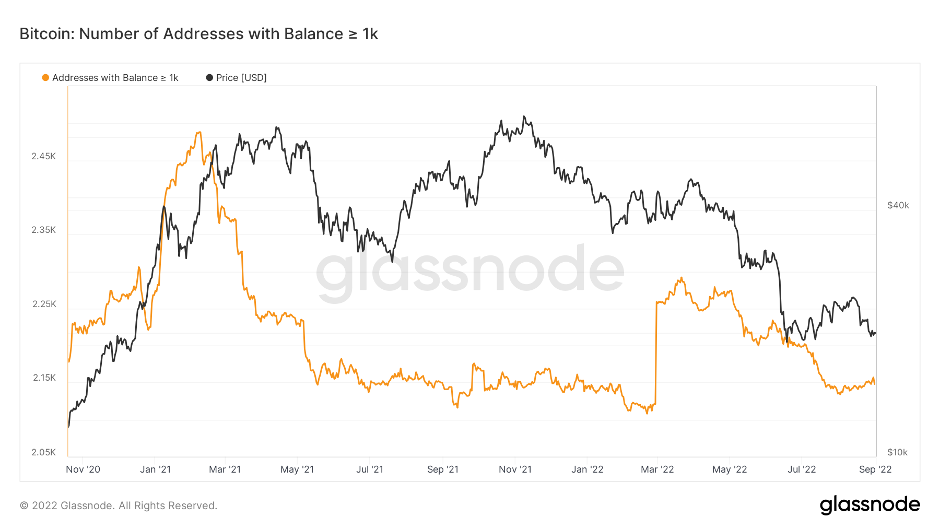
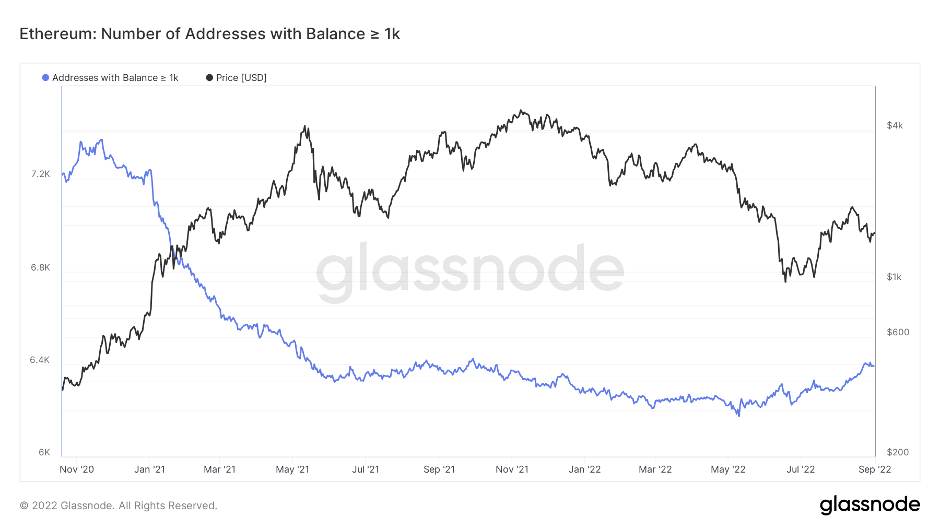
Historically, it has been the case that the wallet cohorts that hold the least amount of Bitcoin (Addresses with Balance > 0.01 and 0.1 Bitcoin) have consistently accumulated. In comparison, the cohorts with lots of Bitcoin in their wallets are more calculated regarding when they're accumulating and distributing Bitcoin. The wallet cohort that has been the most profitable (in terms of the best time to accumulate and distribute Bitcoin) is the 'Addresses with Balance > 1,000 Bitcoin, so we watch them closely as it can be considered wise to emulate.
We're now seeing that the wallet cohorts holding the least amount of Bitcoin (Addresses with Balance > 0.01 Bitcoin) have slowed down their accumulation. In contrast, the number of addresses in the cohort 'Addresses with Balance > 1,000 Bitcoin' have begun slightly increasing.
The second metric we will look at today is the Net Realised Profit/Loss. This is one of the best indicators for assessing market sentiment and the levels of conviction in the market. We can see that in the bull markets, there is lots of profit taking (REALISING of profits – green spikes), and the black horizontal line acts as support. That line is considered a break-even line; hence, it supports a bull market as investors expect to see higher prices when approaching break-even levels, so they're willing to hold their coins. However, in a bear market, the black horizontal line acts as a resistance line as investors are in the majority 'under water' (in a loss) in their positions. So, when prices come back to their break-even levels, due to investors having little conviction in seeing higher prices, they sell into these break-even levels and are relieved to have 'got out' without realising a loss.
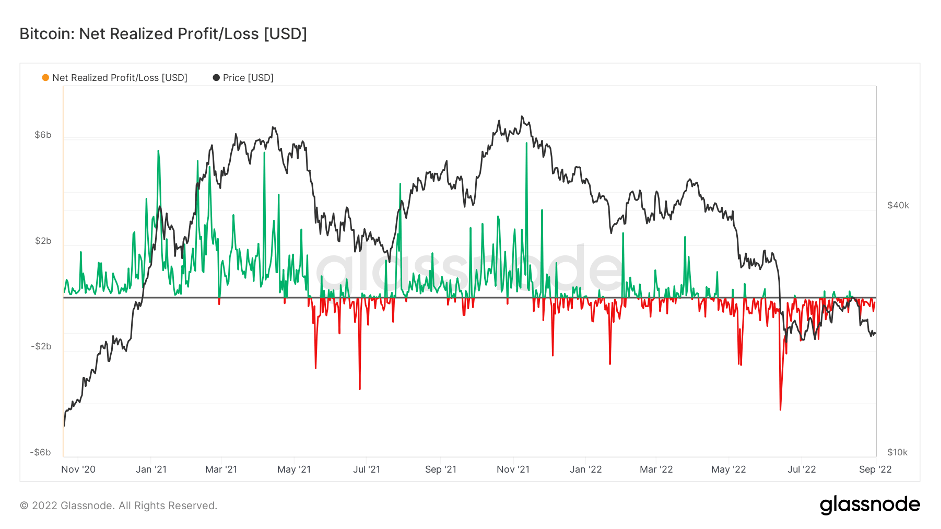
Note: Loss taking in USD terms has been less recently, indicating that perhaps significant loss-taking has already taken place and investors are no longer overweight enough to realise considerable USD losses.
This metric is not available for Ether.
Metric 3 – Realised Price by Address
The last metric we will cover today is the Realised Price by Address. We covered this in last month's report, suggesting that the Realised Price by Address (for the individual wallet cohorts by the number of Bitcoin they hold) realised prices stood between $23,400 and $24,700. This range would act as strong resistance and proved to act as a strong resistance (as stated in our last monthly report) due to market conviction being low and investors not anticipating higher prices.
We will again look at this metric to see how it has historically pointed out previous bear market bottoms. The Realised Price by Address visualises the average price at which current unspent Bitcoins belonging to each address category were purchased. Each address category represents addresses with balances within a given range.
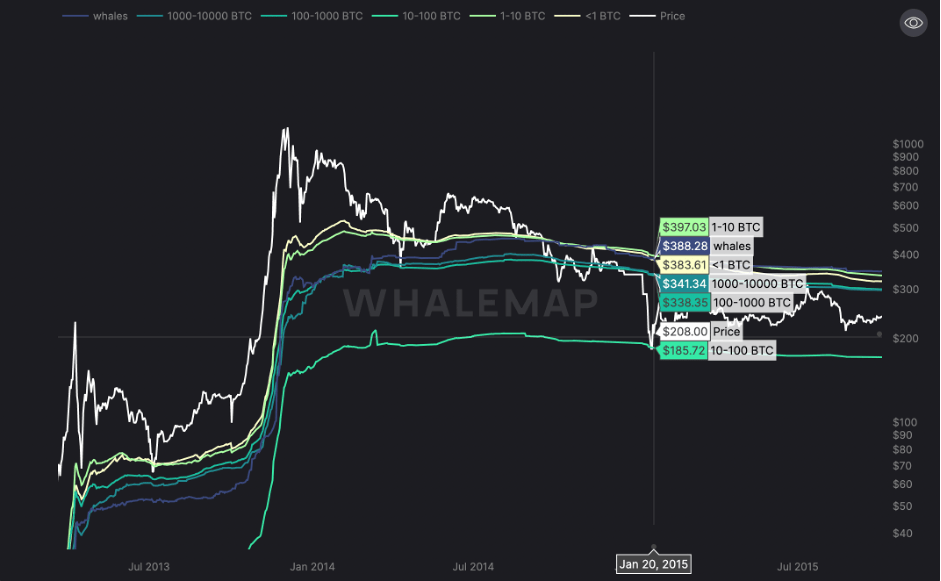
2015 Bitcoin Bear Market
2018 Bitcoin Bear Market
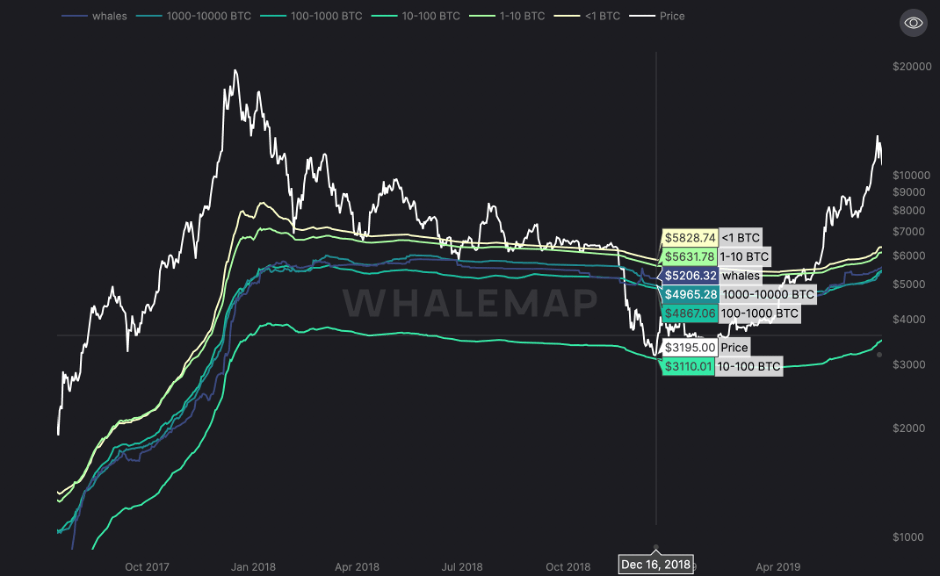
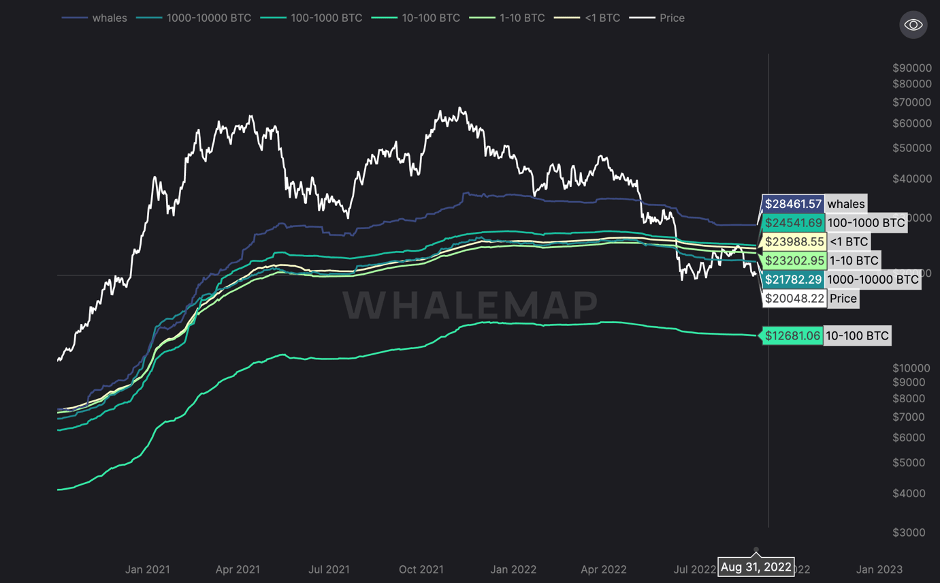
If we look at the above 2015 and 2018 bear market, we can see that the 10 – 100 Bitcoins wallet cohort formed the lowest support level for the Bitcoin price. If we now turn our attention to the 2022 Bitcoin Bear market, we can see, once again, that the 10 – 100 Bitcoins wallet cohort has a realised price far below the other wallet cohorts.
2022 Bitcoin Bear Market
Summary
The wallet addresses suggest that perhaps the selling pressure from the largest Bitcoin wallet cohorts has potentially slowed down, whilst we've seen the smallest Bitcoin wallet cohorts slow down in accumulating coins. Alongside this, market sentiment is currently low, and investors lack conviction for higher prices. This is understandable when looking at the Realised Price by Address, which has historically shown the 10 – 100 Bitcoin wallet cohort to provide the last support for the Bitcoin price during past bear markets. The current 10 – 100 Bitcoins wallet cohort Realised Price stands at the late $ 12,000's.
Ether – Technical Analysis
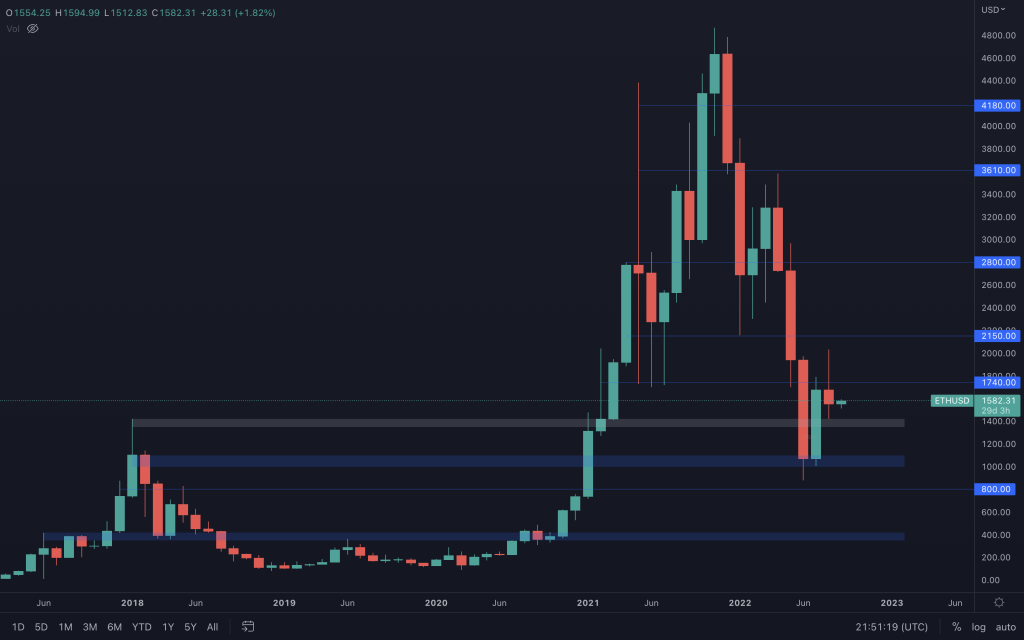
Ether may not have performed as poorly as Bitcoin, but it failed to indicate its likely direction over the next month. Considering that its 2018 high sits just below the current price and the $1,740 key level is right above, it is kind of sandwiched between two important levels. As you may know already, this is the month of the Merge, and we are actively watching the lower timeframes for confirmation of a valid trade setup.
Ether On-Chain analysis
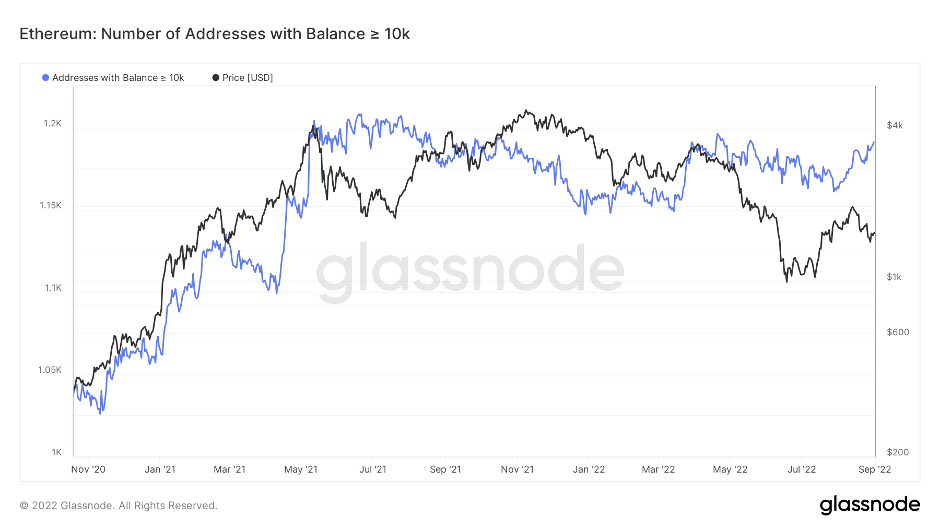
If we now turn our attention to Ether, we can see that the case is also true for Ether as it was for Bitcoin. The smallest wallets (by Ether held) have slowed in their accumulation, and the largest wallets (by Ether held) have begun up-trending.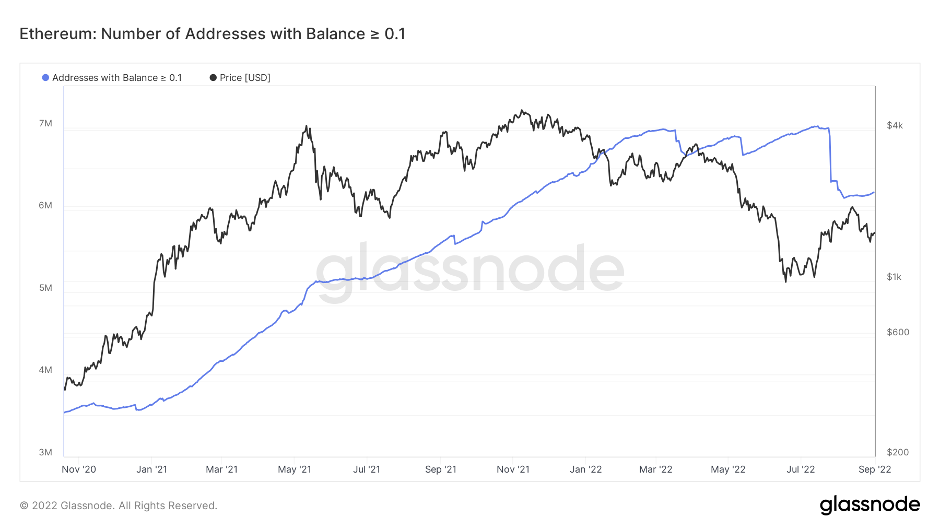
DOT
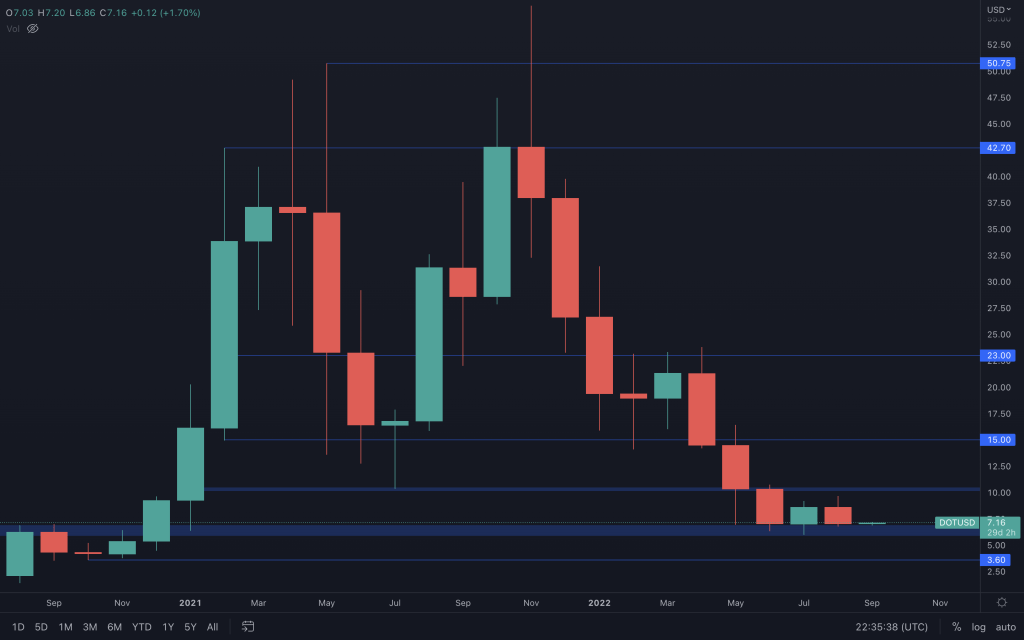
As we mentioned it would happen in last month's digest, DOT attempted to challenge $10, although it fell $0.30 short. Uncertainty reigns as DOT's done nothing but range for the past two months. Even though the momentum has previously been with the bears, we can't begin to look at lower prices unless $6 is lost. At this moment in time, DOT/USD and DOT/BTC are both at support, so as long as there is no significant downside move from BTC, it's worth looking out for positive indications on the daily timeframe.
SNX
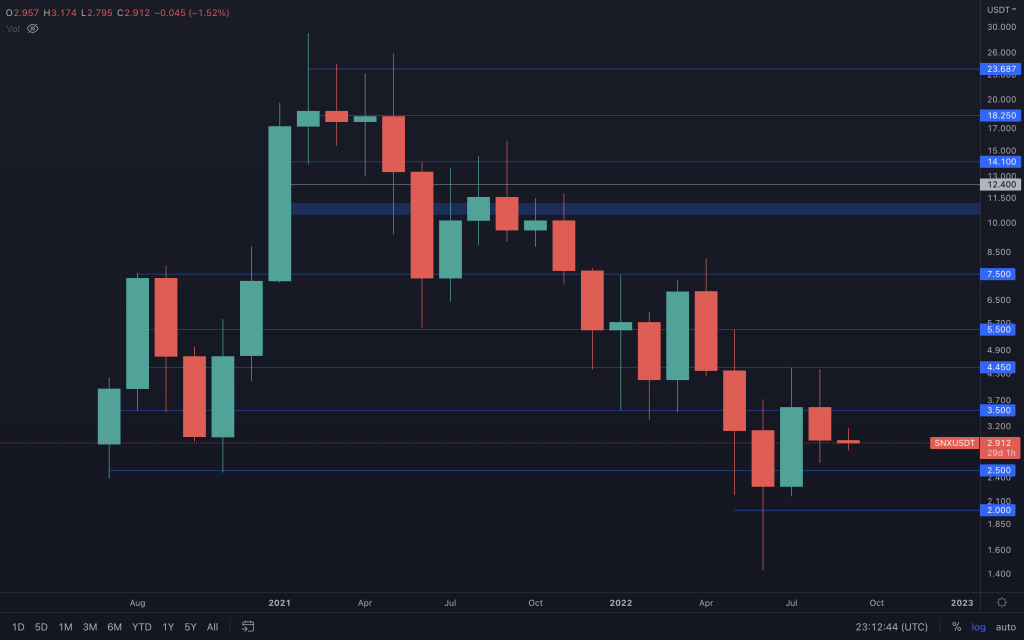
Similar to March, SNX had another bullish engulfing candle that came to nothing. SNX has had its fair share of pumps lately, pushing price up to test $4.45, where sellers have stepped in on each occasion. Now that SNX has a monthly lower high, a retest of $2.50 isn't off the table where SNX will have a decision to make.
RUNE
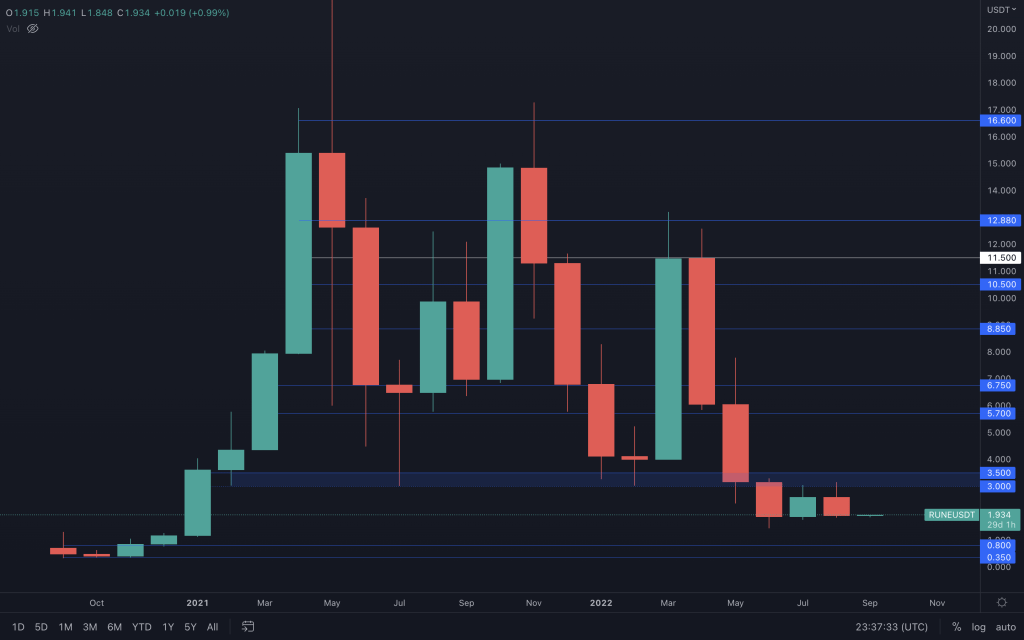
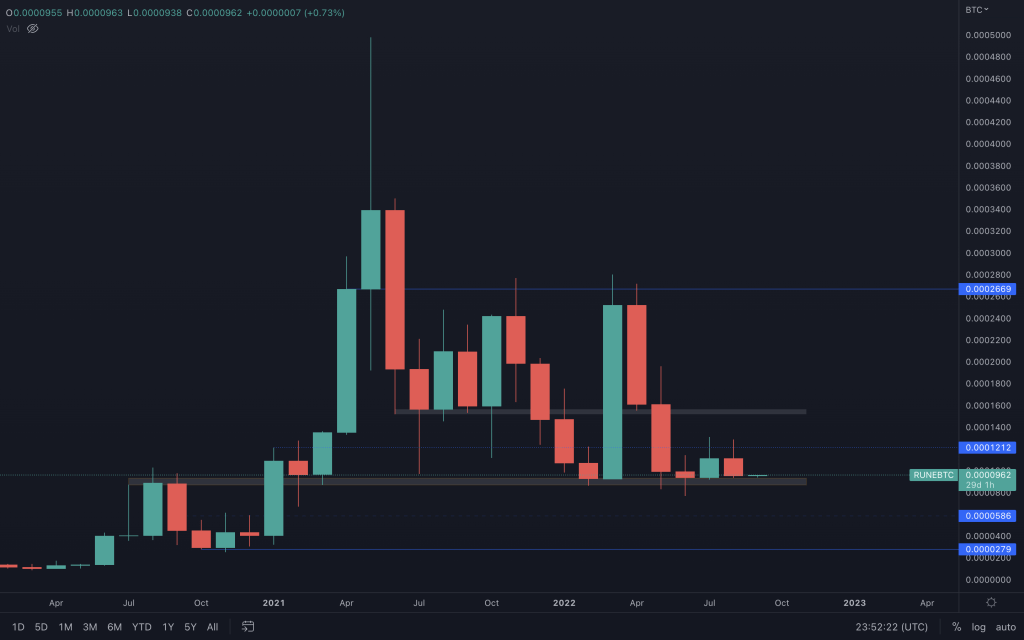
With RUNE unable to get back above that critical $3 level, a trip to $1 cannot be ruled out, especially if the majors perform like sh!t. If they did, we'd expect an accelerated decline in RUNE's price should RUNE/BTC lose the support level.
RUNE/BTC
SOL
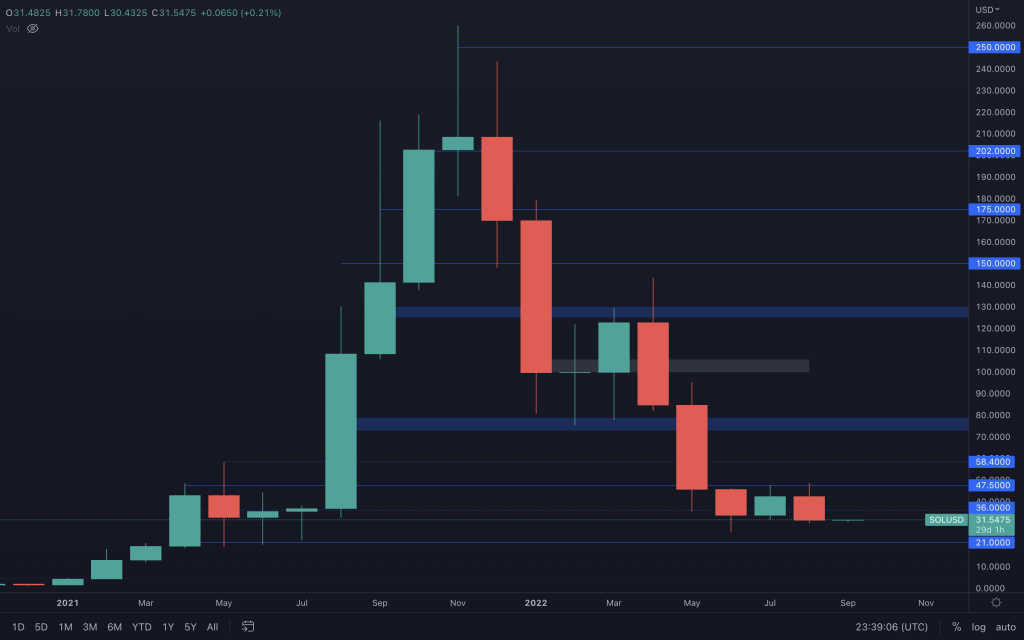
It's not looking great for SOL after it attempted to overcome $47.50 during the month but instead gained itself a bearish engulfing candle. We still can't rule a $21 SOL out.
SOL/BTC
SOL/BTC isn't looking great with a potential reversal pattern that looks set to push SOL's sat price down, at least to support.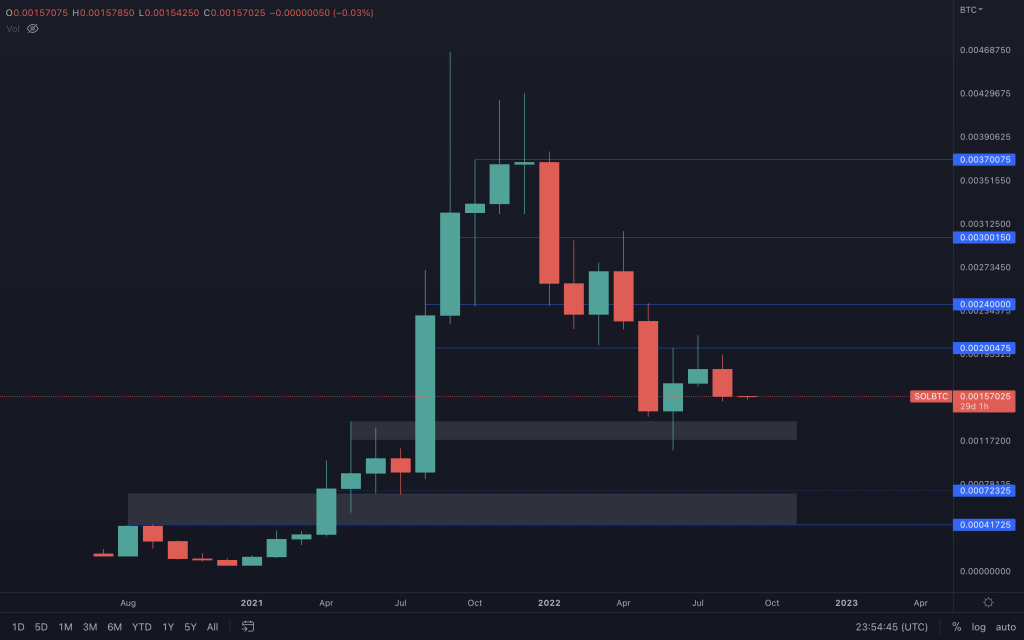
SRM
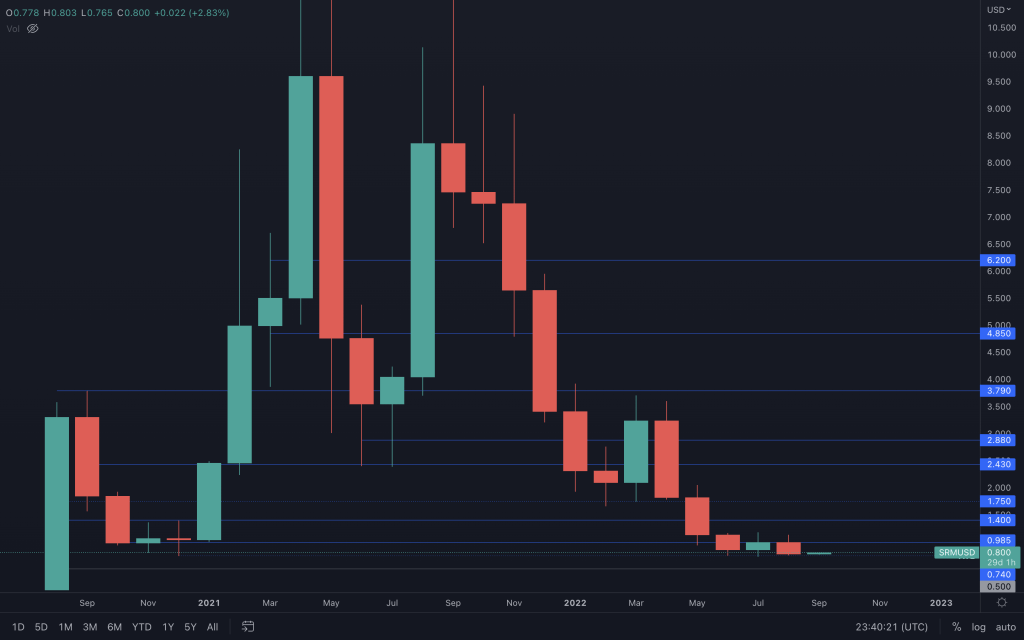
Just like SOL, SRM has a bearish engulfing candle. The candle's reliability becomes an issue because it closed just above $0.74. Had it closed below, we'd almost certainly expect to see it head lower. But instead, we'll have to watch the weekly closures to indicate that.
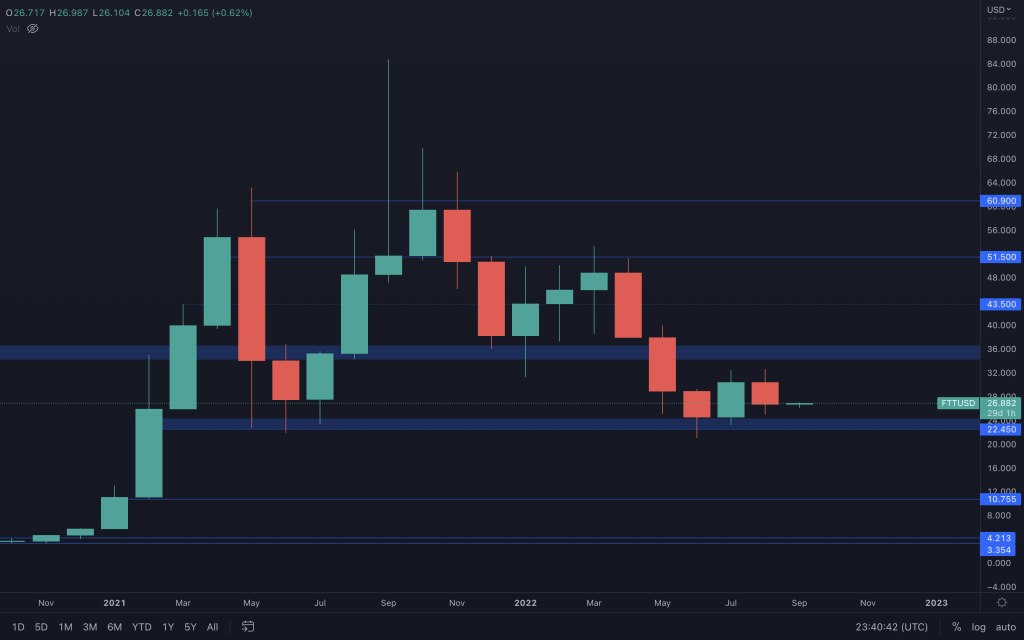
FTT
DYDX
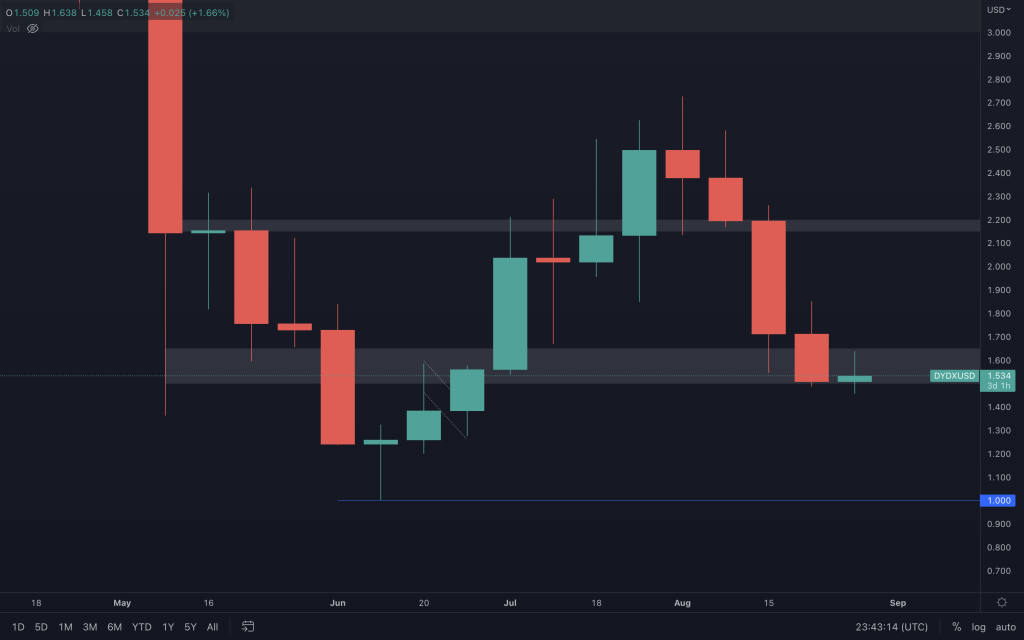
dYdX is just about hanging in there. With barely any wick below the candle body, it indicates that buyers didn't flood in to buy dYdX to protect it from the risk of lower prices. Yes, it closed above support, but there are yet to be any signs of bullishness at the moment.
LDO
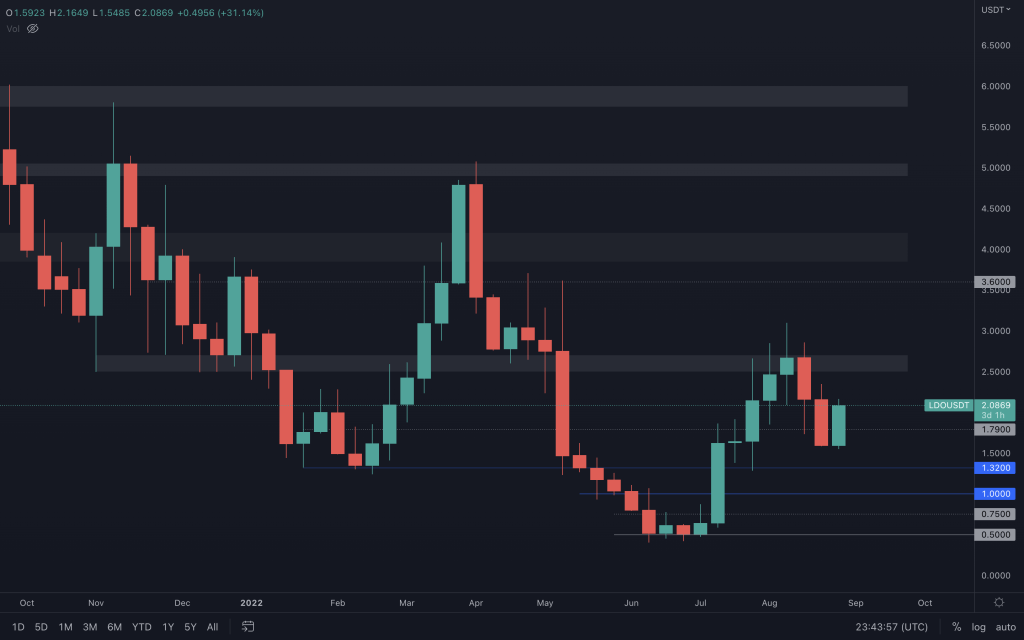
The weekly timeframe is used here. After pumping over 500% from its lows, it's natural to cool off a bit. Seeing LDO head down to $1.32 over the coming month looks likely, given where it closed, again, with no lower wick. But right now, LDO has broken up out of the falling wedge we highlighted in our daily analysis a couple of days ago and is up 16%.
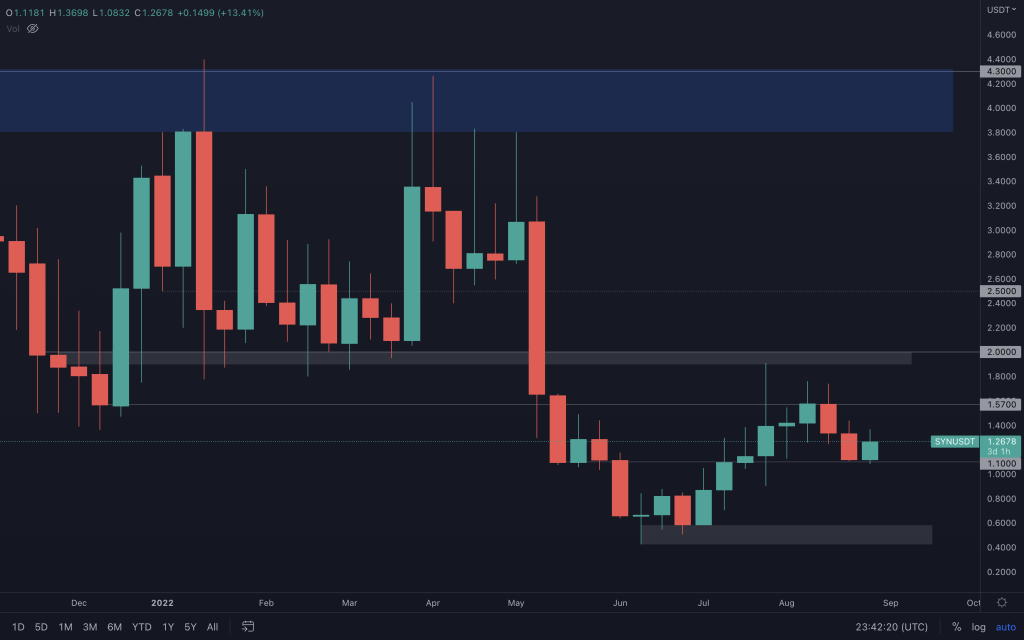
SYN
Recommended from Cryptonary


