Save 23% ($351) & Get a Free 1-1 Call with our Team ⏰ : 0d 2h 59m 44s
Monthly Technicals Pro - March '22
After 3 months of red, it's very easy to switch your focus to 'down only' mode. Closing the previous month below $40,000 certainly didn't paint a positive picture for Bitcoin and the logical path was to see it head straight for $30,000 once again. However, with BTC heading towards what we believe to be a 'high-value' area, it's important to look for indications of a reversal as the price heads there. Back at the beginning of February, Bitcoin had created a higher high on the weekly timeframe and its influence on the market is significant enough for us not to ignore it. Whilst it doesn't mean that we're going to get a guaranteed reversal (as nothing is for certain in the financial market), we make sure to highlight these possible changes to the bearish structure as, should it be confirmed, a move higher becomes even more likely.
Disclaimer: Not financial nor investment advice. Only you are responsible for any capital-related decisions you make, and only you are accountable for the results.
Bitcoin
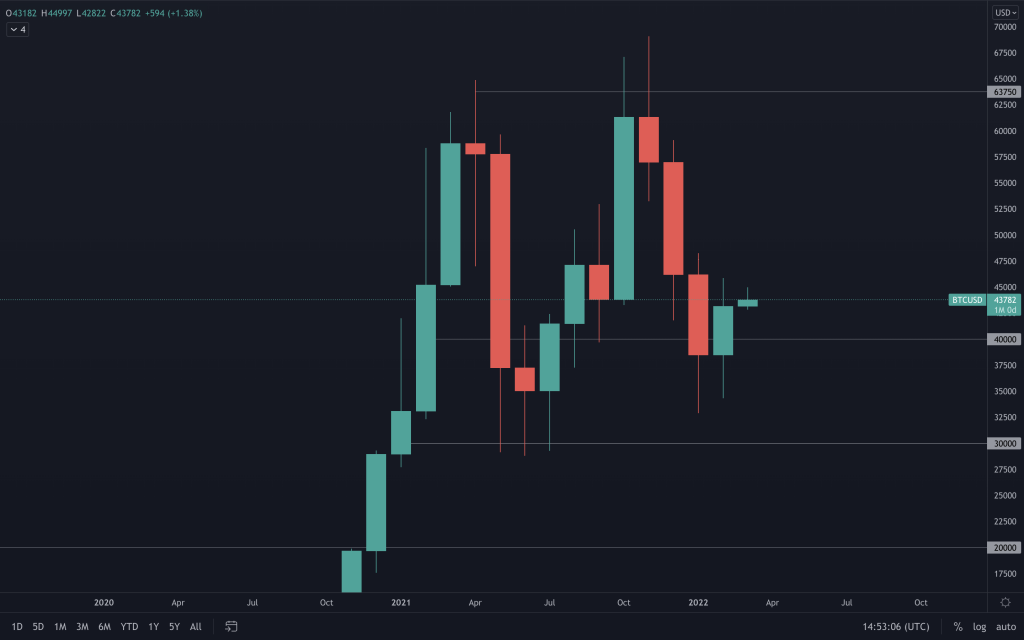
Bitcoin was 'saved' from a red monthly candle on the final day of the month, reclaiming $40,000 and closing at $43,200 (+14.5% on the day) - the biggest daily gains in over a year! We look to whether this bullishness can be sustained and either break above $45,000 or create a weekly confirmation of a higher low. If we couple Bitcoin with the Total Market Cap's next resistance, even $57,500 becomes possible.
Ether
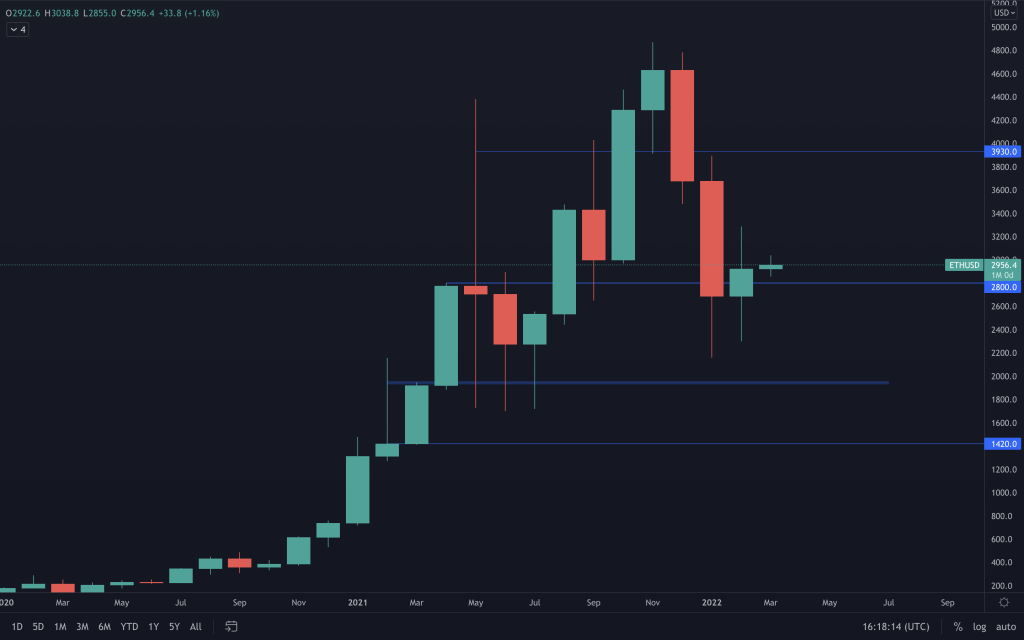
We can see it's a similar story for Ether. Although it didn't close out the month overly bullish it has managed to close above $2,800. When we come to the lower timeframes, we're still approaching ETH with caution until we see the change in market structure confirmed as its 'structure maturity' is lagging behind that of BTC and it still remains bearish.
DOT
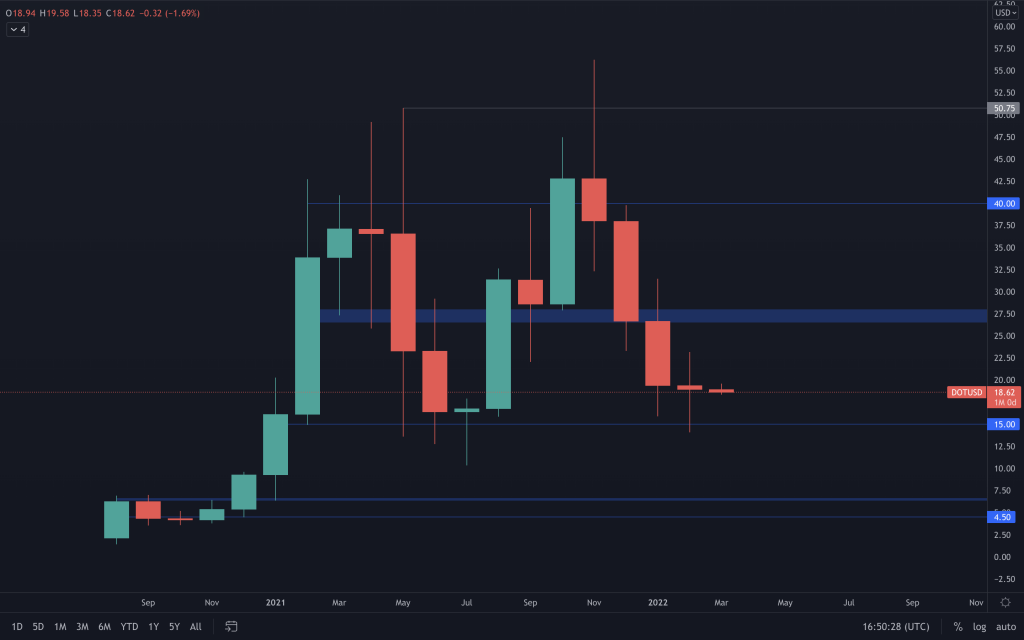
DOT's price decline has also slowed somewhat as it has approached $15, eventually closing last month's candle fairly neutral. Whilst it doesn't signify a bottom is in, it does tell us that the ratio of buyers to sellers over the past month is virtually 1:1. It's fair to say that a bullish BTC will certainly help DOT to avoid any further downside as the charts on the lower timeframes remain bearish.
SNX
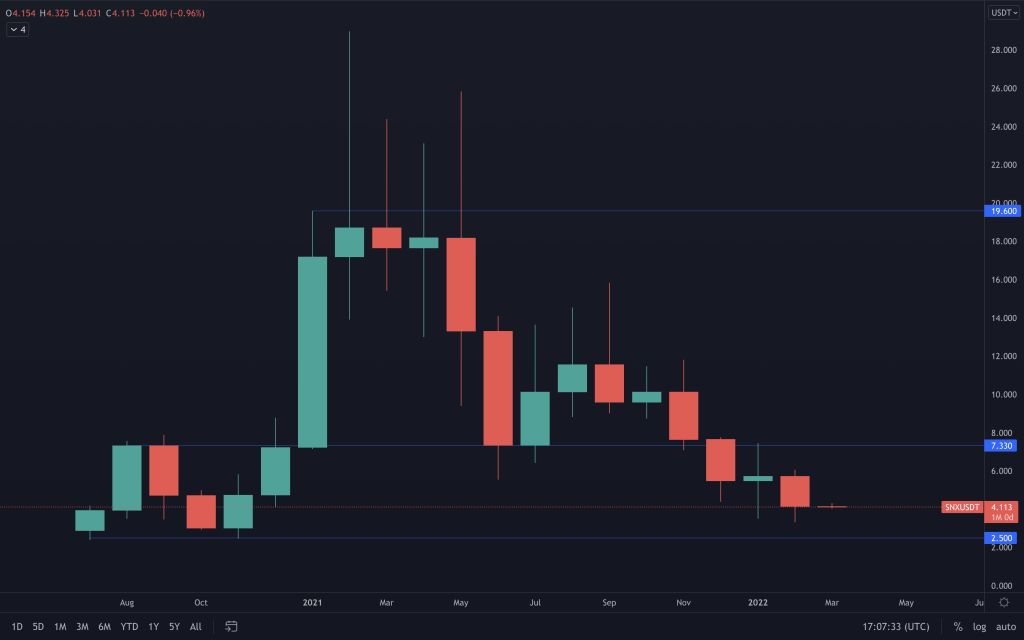
SNX continues its downtrend and a $2.50 SNX isn't yet ruled out as all timeframes continue to remain bearish.
RUNE
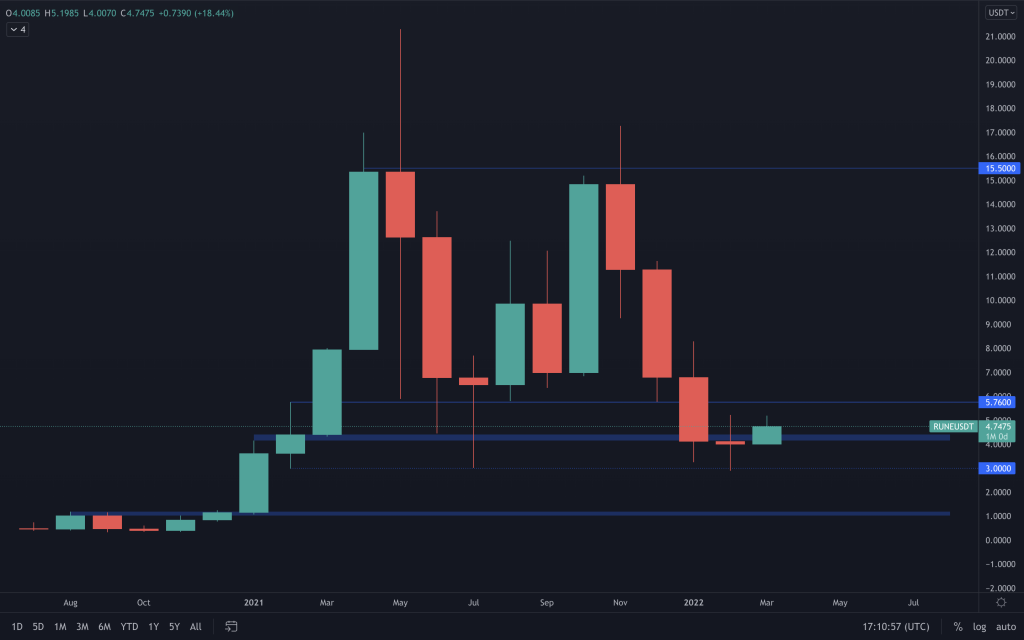
RUNE found demand at $3 once again but it is still not in the clear. We are looking for RUNE to reclaim $6 soon, or else there's a danger of further downside. There are a few significant fundamentals coming up, all going well. These are the integration of Terra Chain (which should be due this month), followed by mainnet which is estimated to be not long after. We'd expect to see each of these positively affect the price as they increase the liquidity provided to THORChain and, of course, RUNE needs to be purchased to do that.
SOL
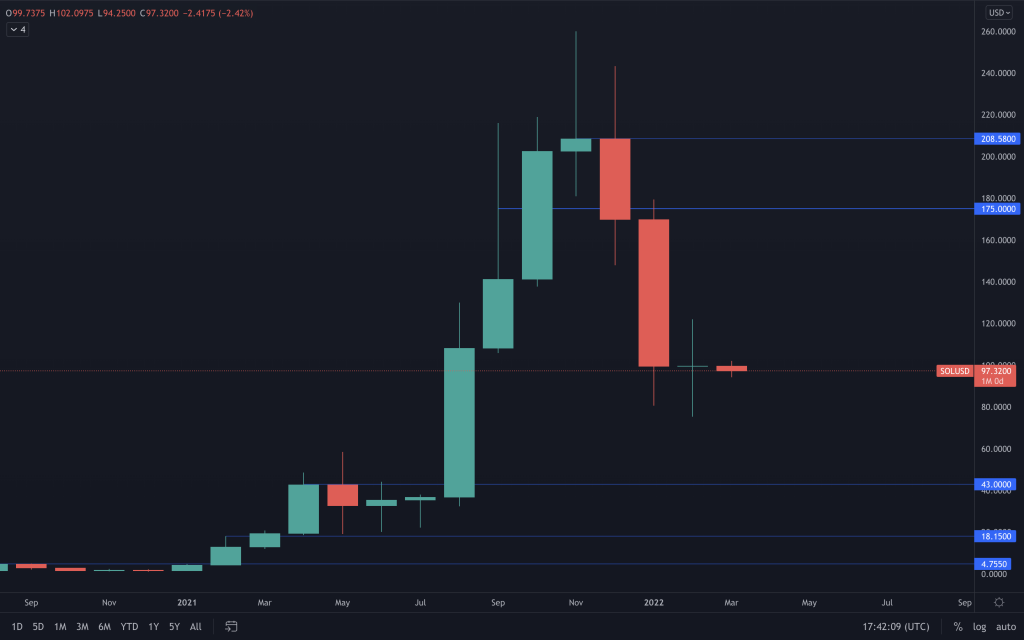
On the monthly timeframe, due to no historical chart data forming S/Rs, SOL is very much in mid-air. On the daily and weekly timeframe, we are monitoring SOL moving within the $75-$125 range, and a breakout of that range will give us an indication as to SOL's the next move.
SRM
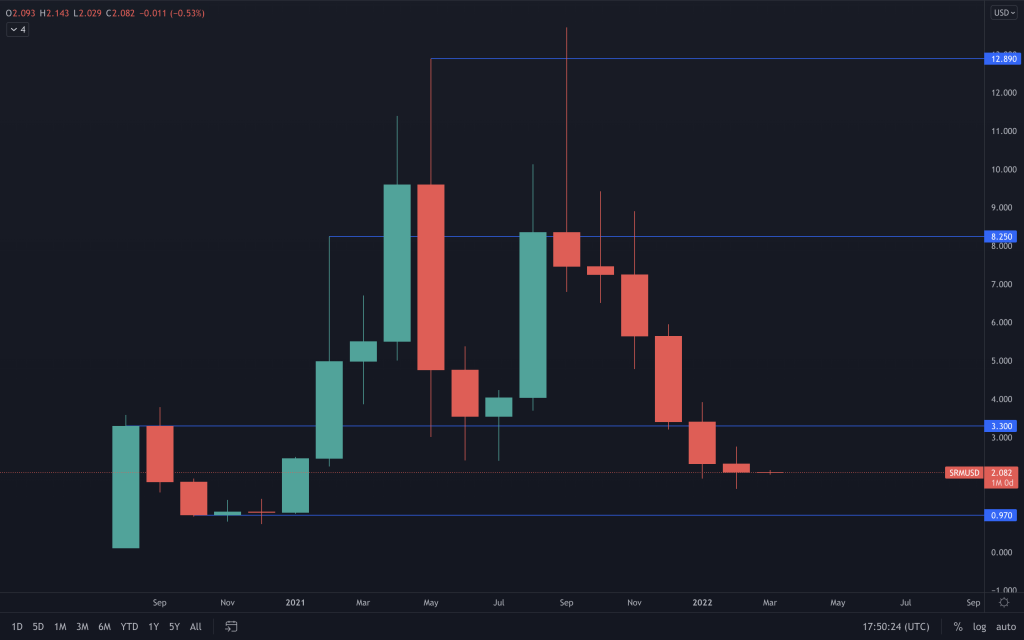
SRM remains very much in its downtrend and we're yet to see any sign of real strength. Yesterday's candle did close as a bullish engulfing, which could see SRM push up towards $2.43. But we remain on the lookout for SRM reclaiming $3, as that would be a better indication that the downside should be over.
FTT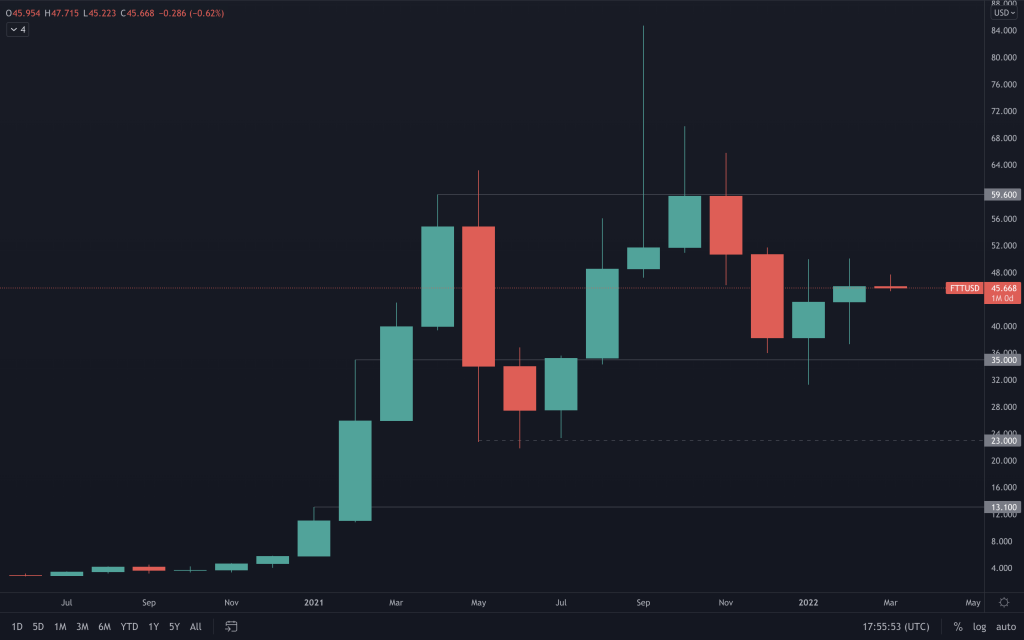
FTT remains in a bullish structure, consisting of Higher-highs and Higher-lows. Through all of the volatility, it has performed extremely well. We await a breakout of its range ($35-$50) on the lower timeframes. A monthly candle closure over $60 would help push FTT back into all-time highs once again.
MINA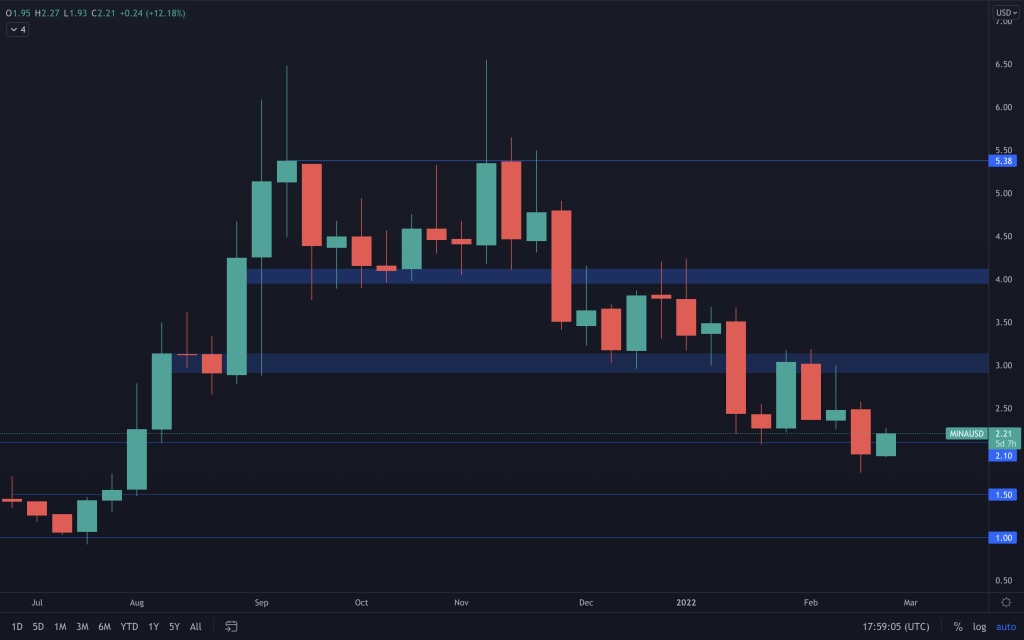
This is the weekly timeframe. It's clear to see that the bearish structure remains intact as MINA closed last week below $2.10. MINA would only really begin to look good by means of altering its structure. Right now, that's reclaiming $3/
dYdX
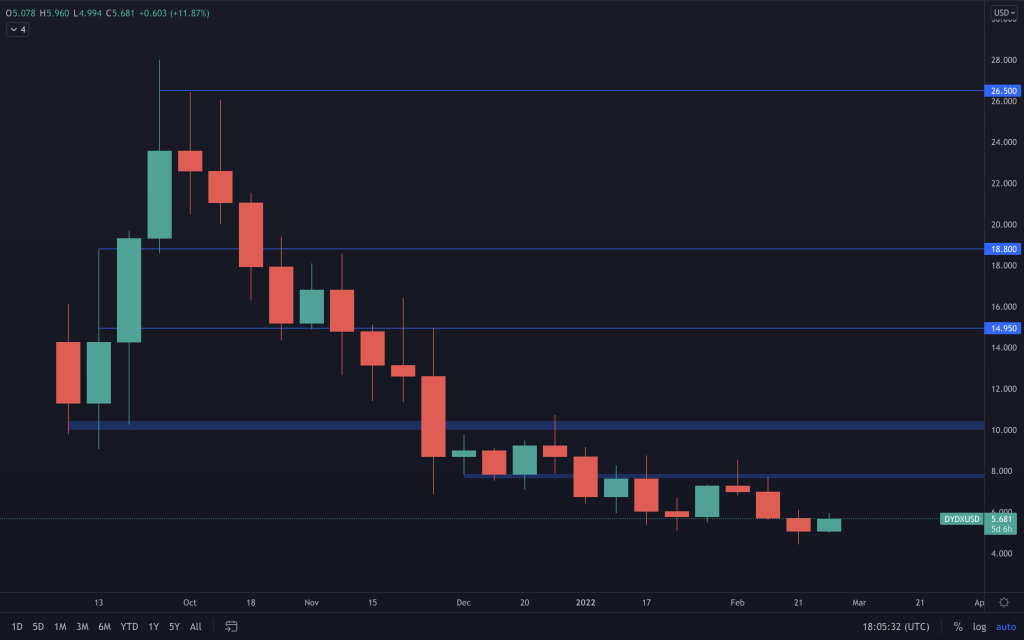
Weekly timeframe used here also. We can see here that dYdX continues to remain in a downtrend and there are no obvious signs of a bottom being formed quite yet. As you know, our personal area of interest is $3-$5.
Recommended from Cryptonary


