Save 23% ($351) & Get a Free 1-1 Call with our Team ⏰ : 0d 2h 59m 43s
Monthly Technicals Pro - May '21
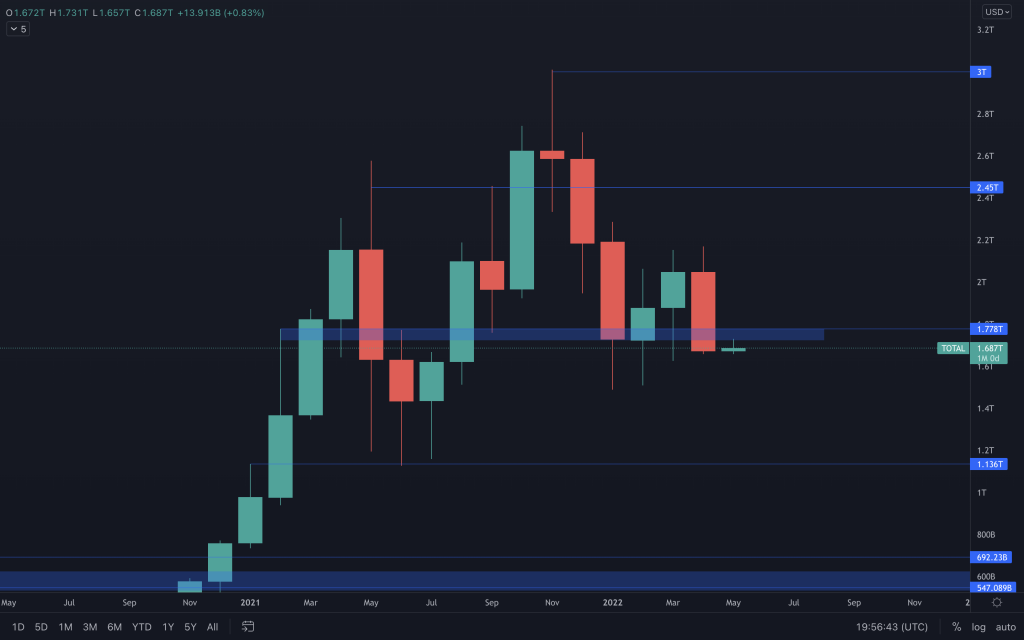
After four weeks of consecutive red candles, we can see how this has been reflected on the Total Market Cap chart. The monthly close brought with it the creation of a bearish engulfing monthly lower high that has broken through the support level. The lack of any sizeable wick below the candle body also points towards a lack of buyers in the market at this moment in time. The one thing that transfers over from the weekly chart to be visible here is how the bullish weekly structure is intact at this moment in time (higher highs and higher lows on the candles) - This is the last thing for bulls to defend, so we could see an early monthly bounce. With all of those mentioned above taken into consideration, it points to a higher probability of seeing more downside in May. A weekly close below $1.67T would support this argument. The support level that we have below is $1.136T and downside would be invalidated by a monthly reclaim of $1.77T.
Disclaimer: Not financial nor investment advice. You are responsible for any capital-related decisions you make, and only you are accountable for the results.
Summary for May ’22:
- Total Market Cap – -18.31%
- Altcoins Market Cap – -19.08%
Total Market Cap
Altcoins Market Cap
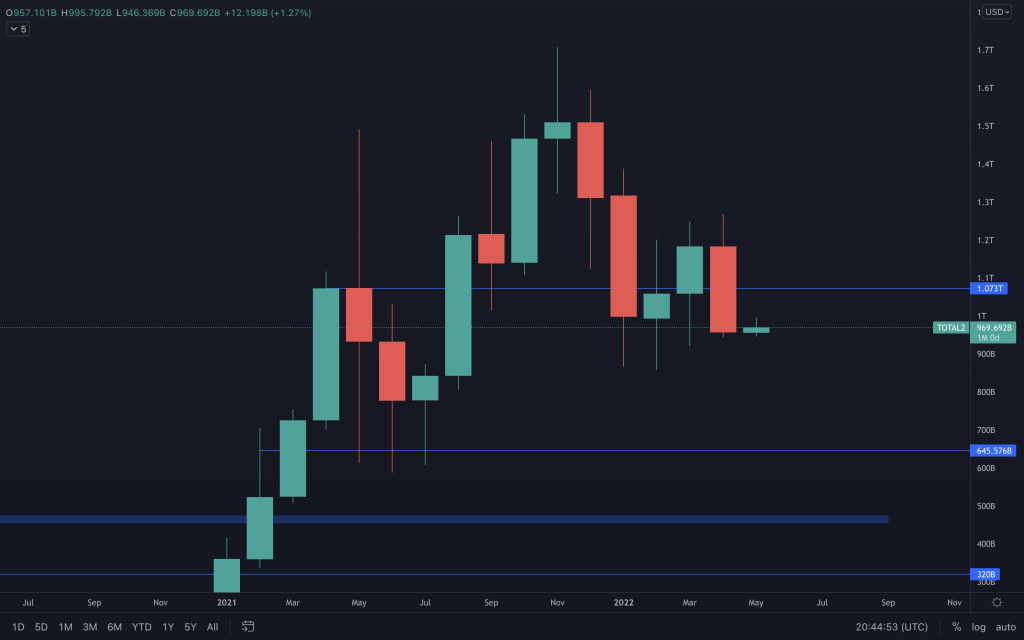
The Altcoins Market Cap is not too dissimilar from the Total Market Cap, and the same conclusions can be drawn. As long as this index remains below $1T, support lies at the $650B region. Invalidated by a monthly reclaim of $1.07T
Bitcoin
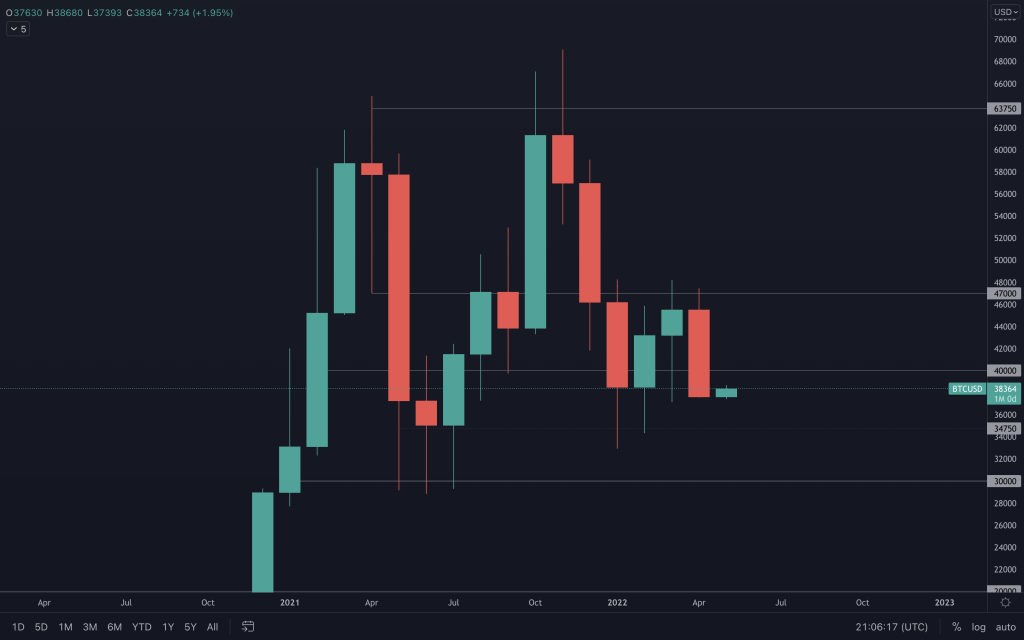
We often see almost identical similarities between Bitcoin and the Total Market Cap. After all, Bitcoin does occupy over 40% of the market share. Resistance was met at $47,000, where the price then proceeded to decline, closing the month below $40,000. The current indications point toward Bitcoin moving lower over the coming month, with support lying at $30,000. There is a slight possibility that the market may see relief after the meeting of the FOMC on the 4th of May, as it is quite a significant fundamental event for the markets. But to see any relief from their meeting, they would need to announce the unexpected - an interest rate hike below 0.5%.
Ether
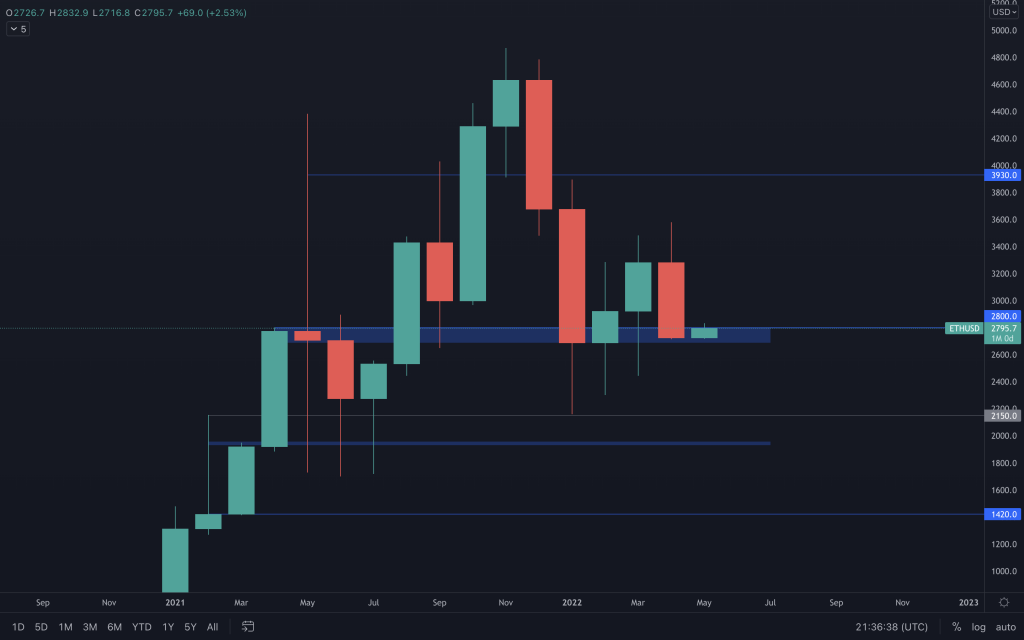
Ether looks the stronger of the two majors at this moment in time. The higher highs and higher lows visible on the weekly timeframe reflect in each of ETH's monthly candle's wicks really well. Although Ether did create a monthly bearish engulfing lower high, it didn't break through its support level as Bitcoin did. ETHBTC is also in a similar situation. If the market surprises us and performs well overall, Ether would likely continue to outperform Bitcoin positively. However, ETHBTC is right on its support level, so we'll monitor that as any further bearishness would put this at risk.
DOT
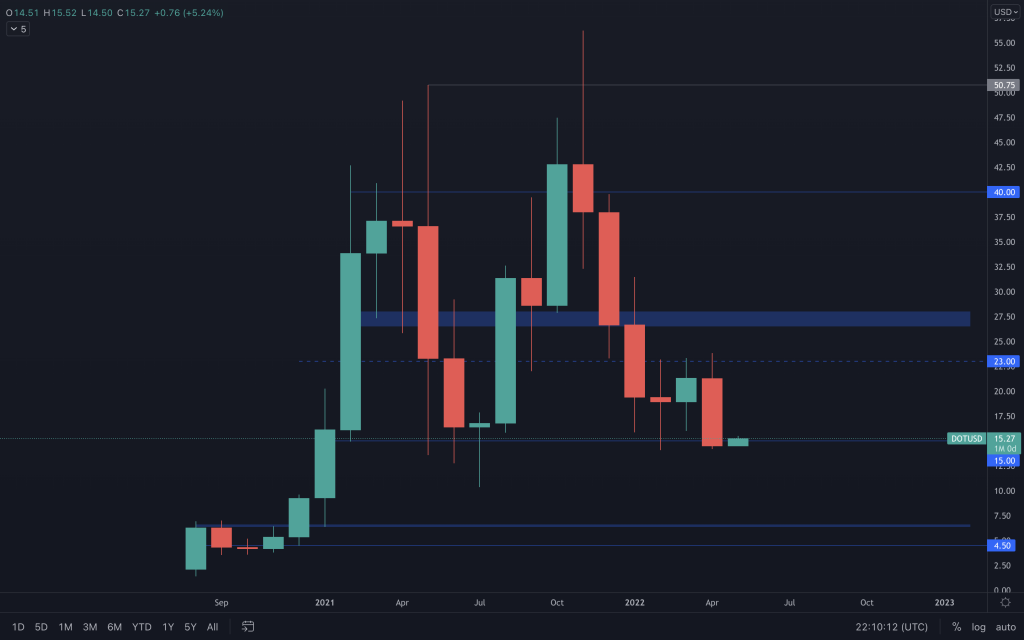
We have had the lowest close for DOT since December 2020. With much of the same bearish factors as we have mentioned on the charts above visible here, support now lies at $6.50. From a monthly standpoint, DOT needs to reclaim $27.50 to better this situation.
SNX
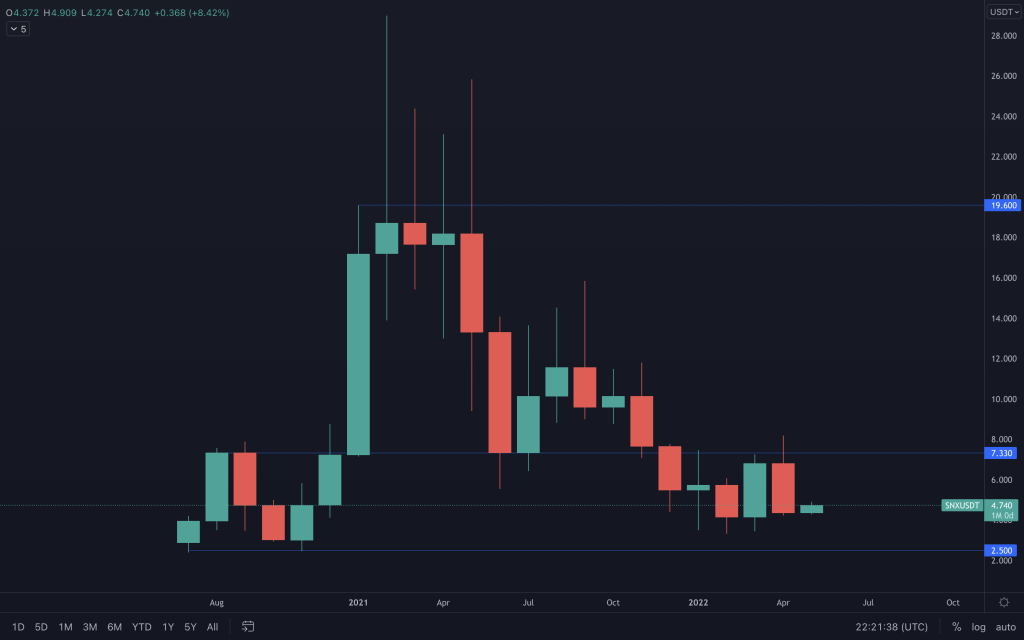
$7.33 is the level that SNX needs to close above to have the chance for a run at $20. Last month's candle failed to take advantage of the previous month's bullish engulfing by getting a closure above $7.33. Although the chart may not look as bearish as the assets mentioned previously in this analysis, it actually closed April -35.8%. The largest loss so far. Unless it closes above $7.33, $2.50 remains a possibility.
RUNE
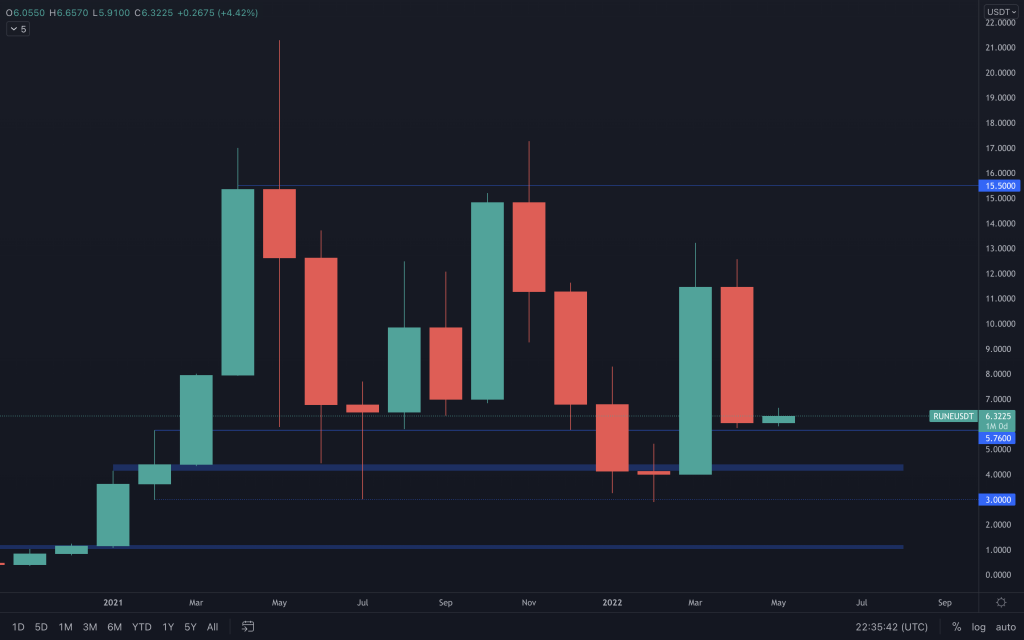
Another top performer in March, but RUNE then closed April down 47.19%. We'll be watching this on the weekly timeframe, as losing $5.76 will likely lead to a $3 visit once more. RUNE's performance will rely heavily on the majors here. With it closing above $5.76, $15.50 remains possible.
SOL
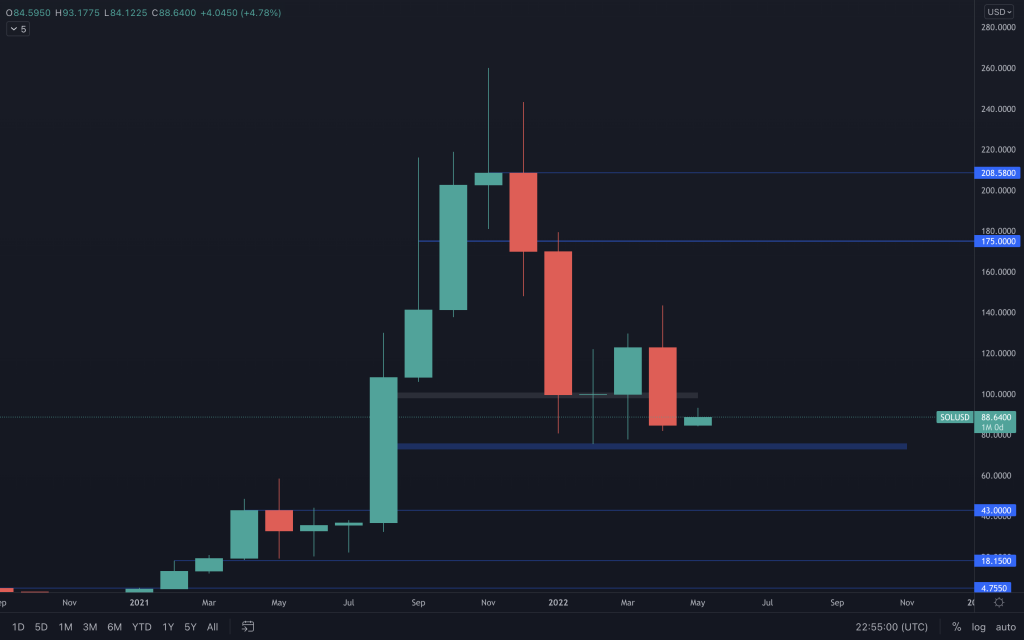
A test of $75 continues to look increasingly likely. However, any weekly loss of that level opens the door to sub $50.
SRM
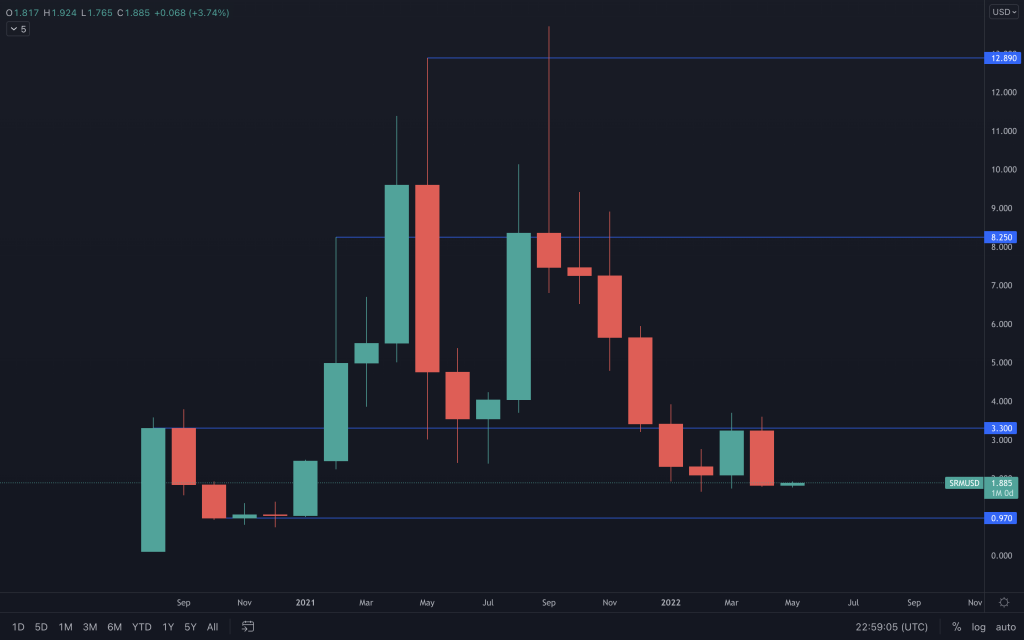
A bearish engulfing for SRM from resistance doesn't look the best. Unless it can reclaim $3.30, $1 looks the more likely route.
FTT
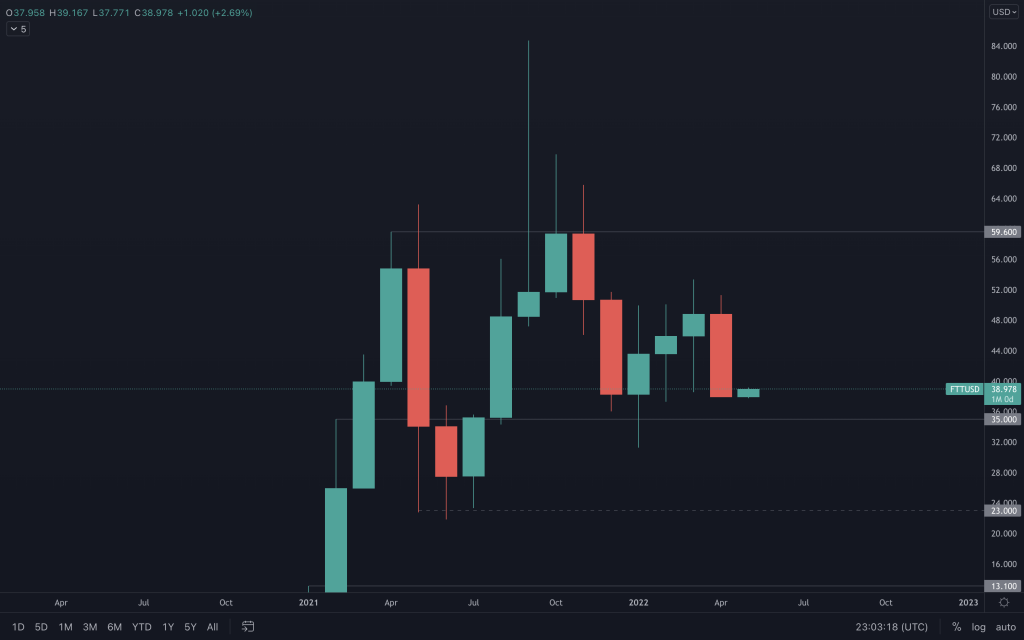
The monthly candle paints the picture that FTT will test $35 in May, something we have been expecting. We can also see a solid bearish candle and a lower high on this chart. $35 has been a reliable support on the weekly timeframe, so if it was to lose that, $23 is the next level. For now, it is still ranging between $35 and $50, and a breakout on lower timeframes would allow us to identify the direction that FTT exits from this range.
MINA
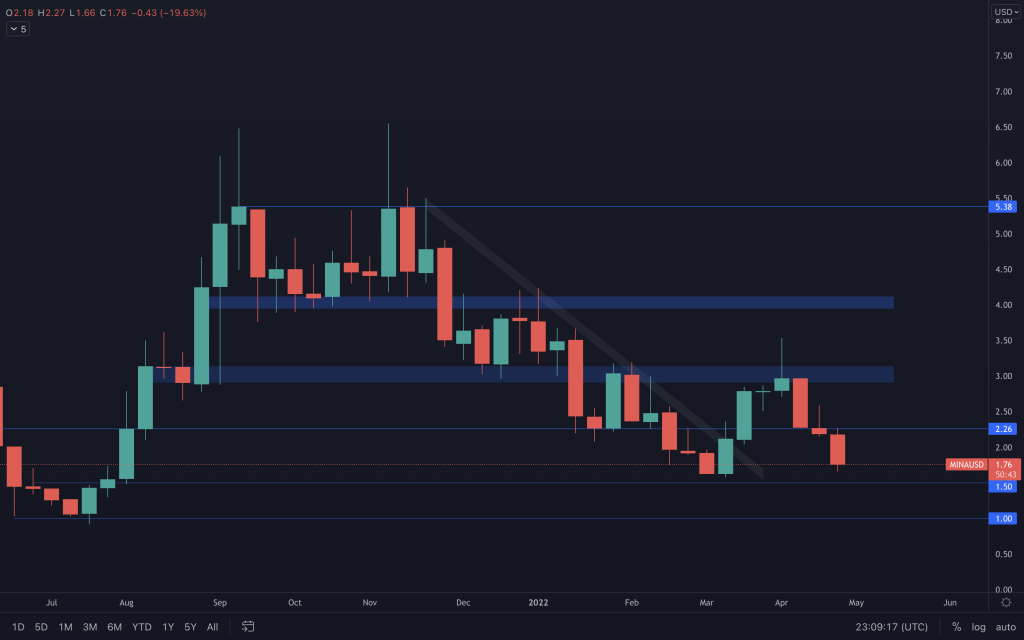
$1.50 is MINA's last support level before downside discovery from a' closure on the monthly perspective'. As we can see on the weekly chart above, if lost, we'd expect the technical and psychological $1 level to offer support. MINA hasn't yet voided its change in structure, but the loss of $2.26 makes it extremely difficult to form a higher low, especially given how close the price is to it now. However, there is potential for a double bottom, and RSI may support this, but we'd have to continue to observe this (and the market) as the price closes in on $1.50.
dYdX
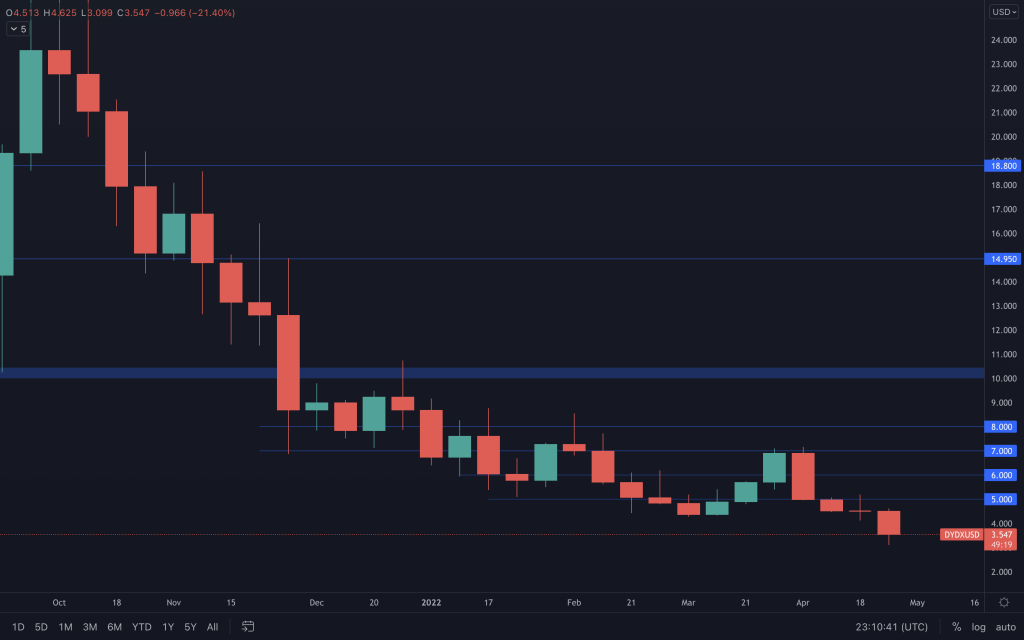
We've used the weekly timeframe here.
After an uncertain two months (Doji candles), dYdX chose south. With no prior price action at these prices, we use psychological levels and see how price reacts around them. For now, it looks like it is still en route to $3.
Recommended from Cryptonary


