Save 23% ($351) & Get a Free 1-1 Call with our Team ⏰ : 0d 2h 59m 43s

Disclaimer: Not financial nor investment advice. Any capital-related decisions you make are your entire responsibility and yours only.
Market Sentiment
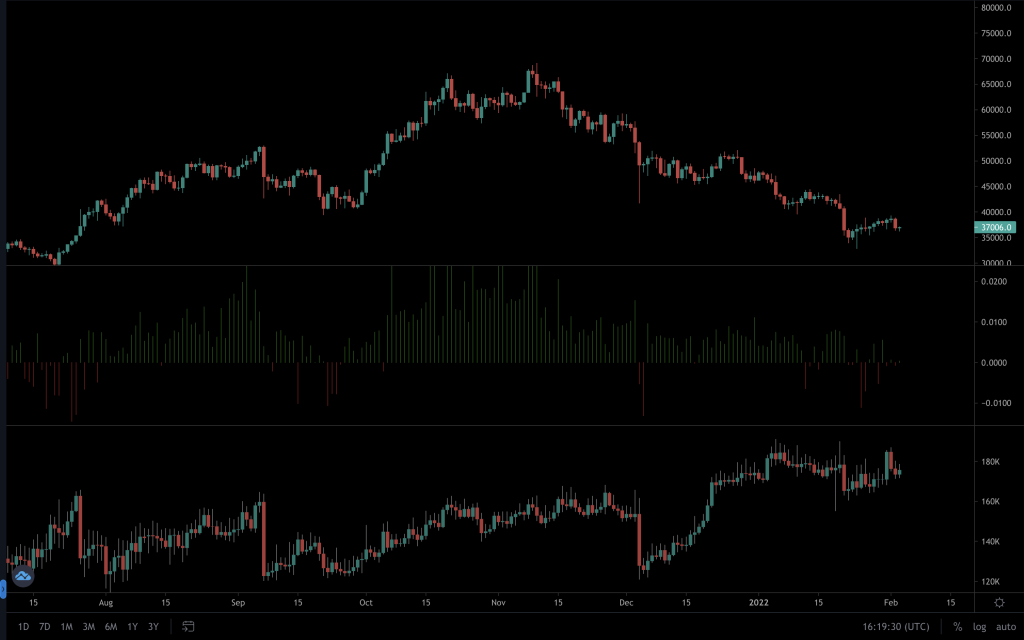
The past four days have seen the funding rate very much neutral. This conveys the indecision in the market. The funding rate indicates an almost equal number of short positions opened as there are longs. We can also see that the open interest dipped from the highs as market participants closed their positions near the $40,000 resistance, and the price moved down the following day.
Total Market Cap
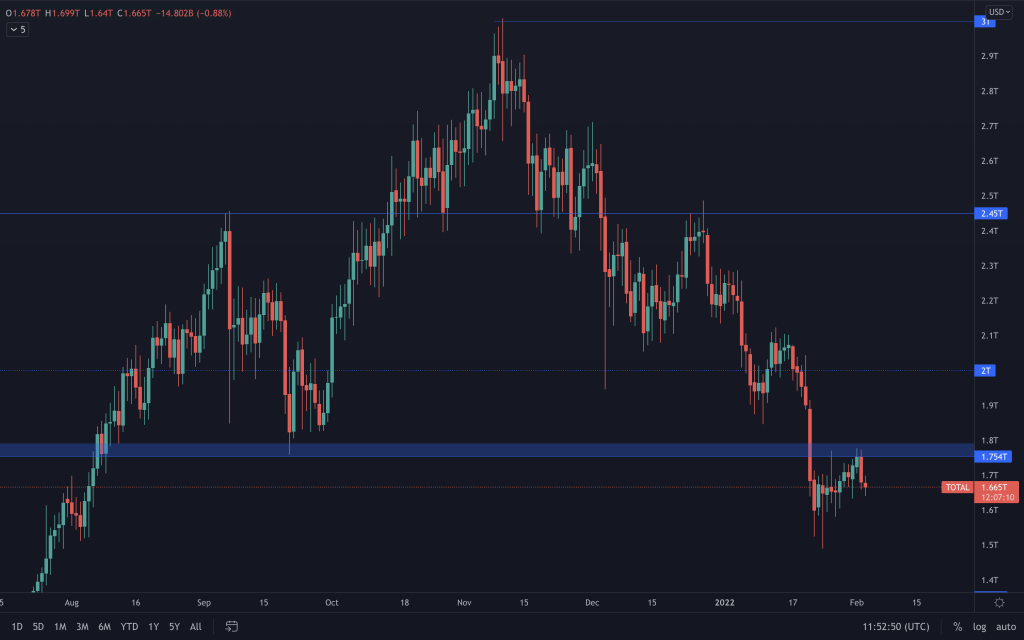
Yesterday's Total Market Cap candle shows that the bearish pressure is still present by closing the day with a bearish engulfing candle. This candle, coupled with resistance, can often signify a top being in. The opposite can be said for a bottom.
So, in this instance, we've now seen the price come up to, and reject, the resistance level ($1.75T-$1.8T) for the second time. Looking at the lower timeframe (we used 8H), the bullish structure of higher-highs and higher-lows remain unbroken, which would explain the slow price action today and the indecision in the market. So, this structure would also need to be broken for any further downside to occur. For clarity, we aren't looking to trade what we're seeing. We've just added it to explain what we see in a little more detail. Right now, the Total Market Cap remains inside the $1.35T-$1.75T range.
Bitcoin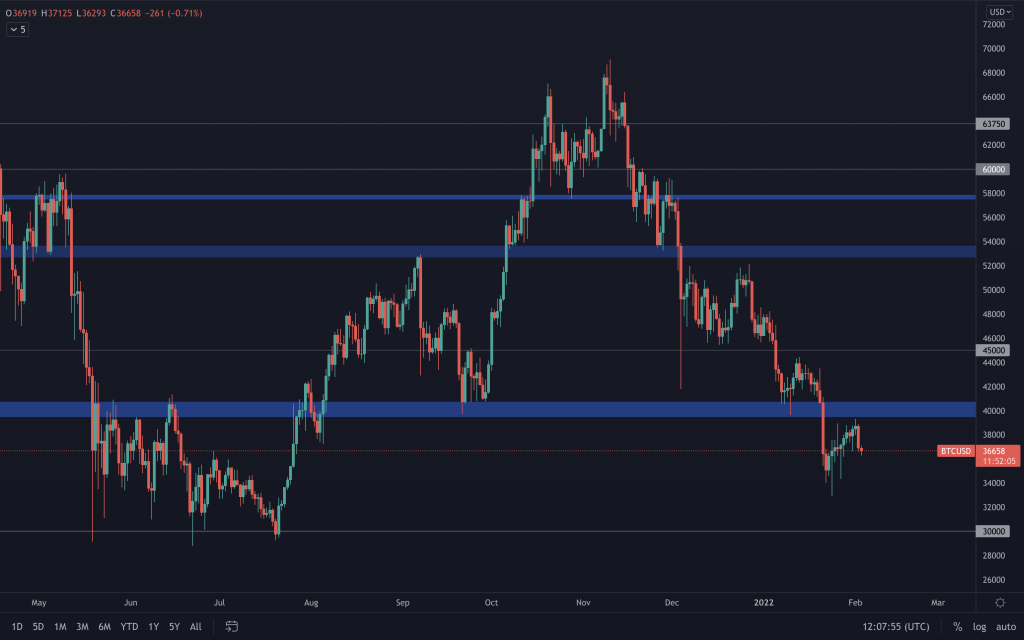
Bitcoin's price remained between $38,000 & $39,000 for over 40 hours without making any advance, so the result was a move down. Yesterday's candle closed -$1,800 from its opening price, which is the largest difference between the opening and closing price in recent days. Going with the overall market structures, price being at/near to resistance and yesterday's candle closing, it would be reasonable to put higher odds for a move down in the coming days. Bitcoin remains in the $30,000-$40,000 range.
Ether
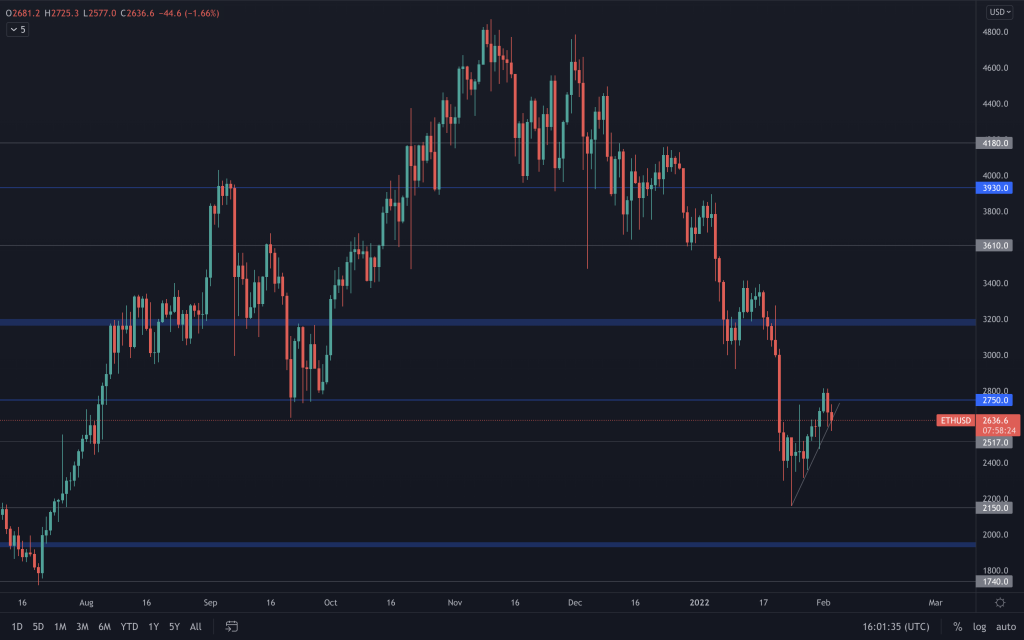
ETH has also failed to keep $2,750 as support by closing below it the very next day. This does keep ETH in the $2,000-$2,750 range. However, the short-term bullish market structure remains unbroken at the time of writing.
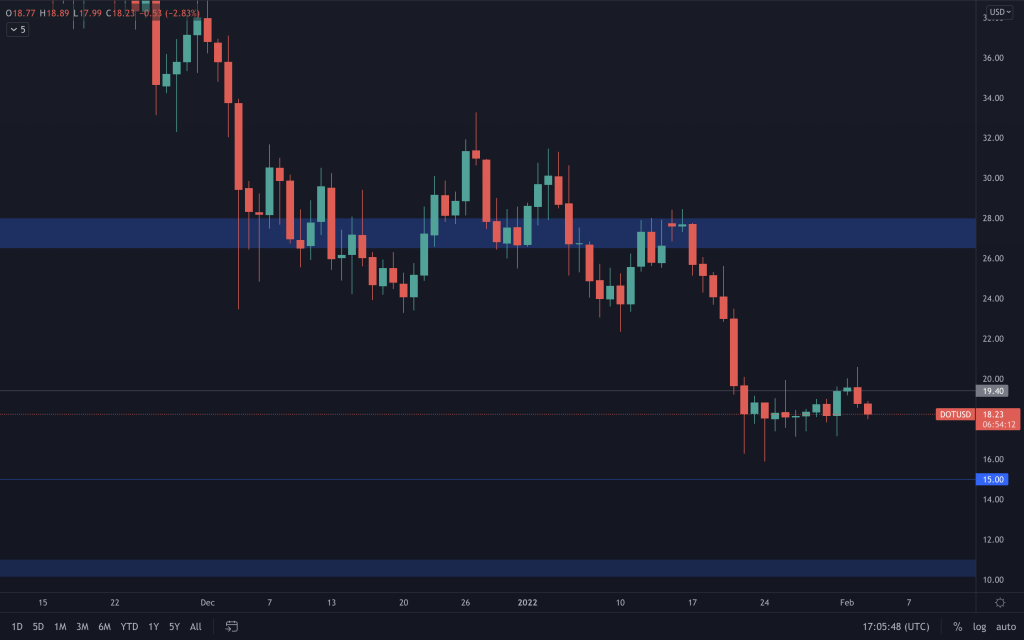
DOT
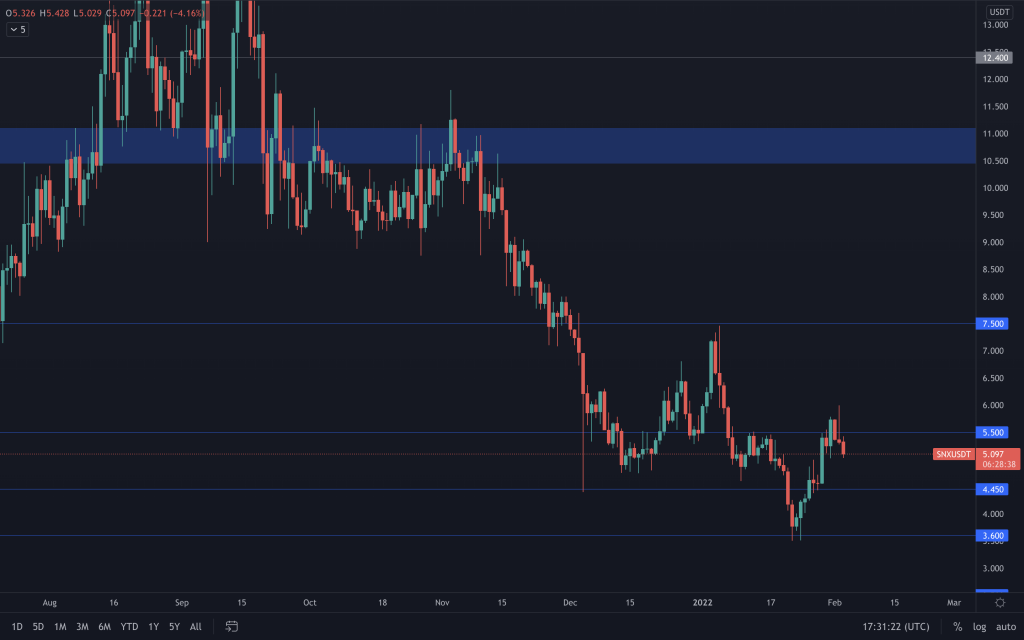
SNX
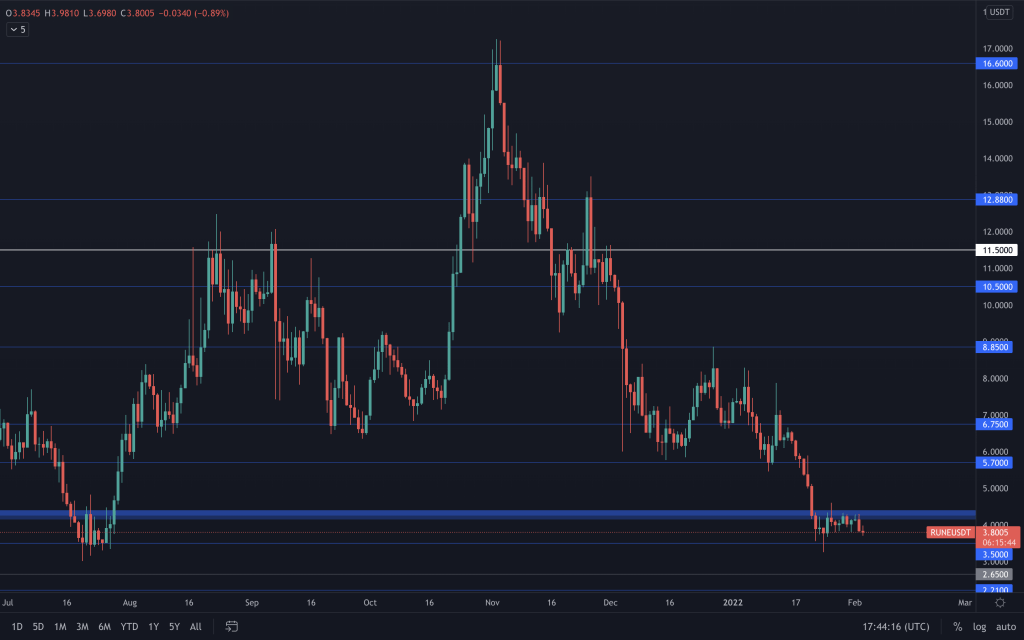
RUNE
SOL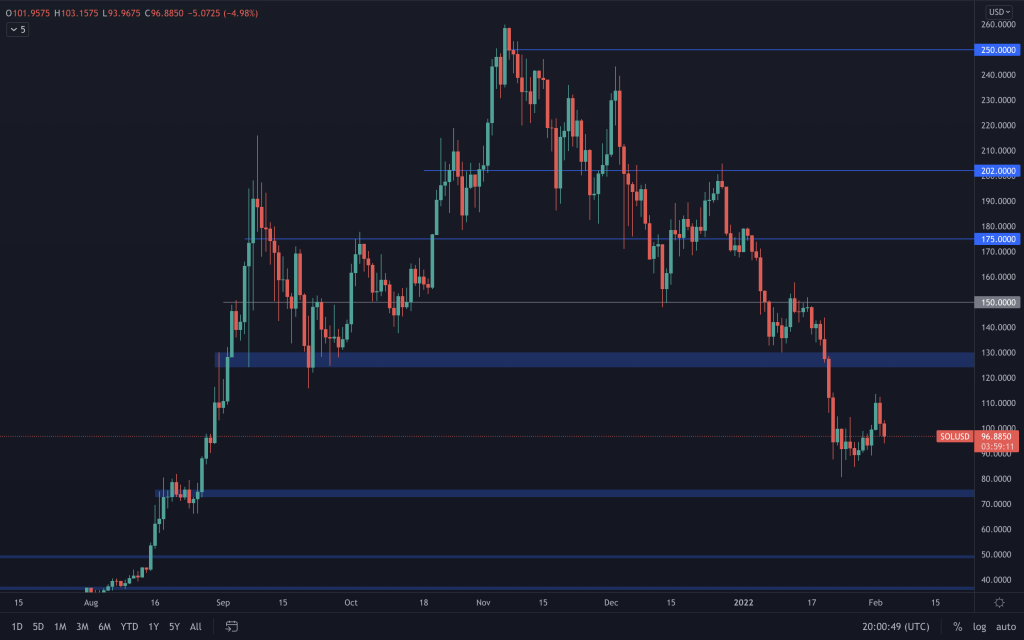
SOL eventually broke through after finding resistance near the $100 level and retested it as support yesterday. Price remains around the $100 level today, and SOL remains within the $75-$125 range. The market structure remains bearish, clearly visible in the chart above. The push up, and rejection of, $110 may have formed a lower-high that may see the price move down to $75. But with it not being an established S/R level, an engulfing candle and no closure below $100 has taken place. It's safest to watch how this plays out.
SRM
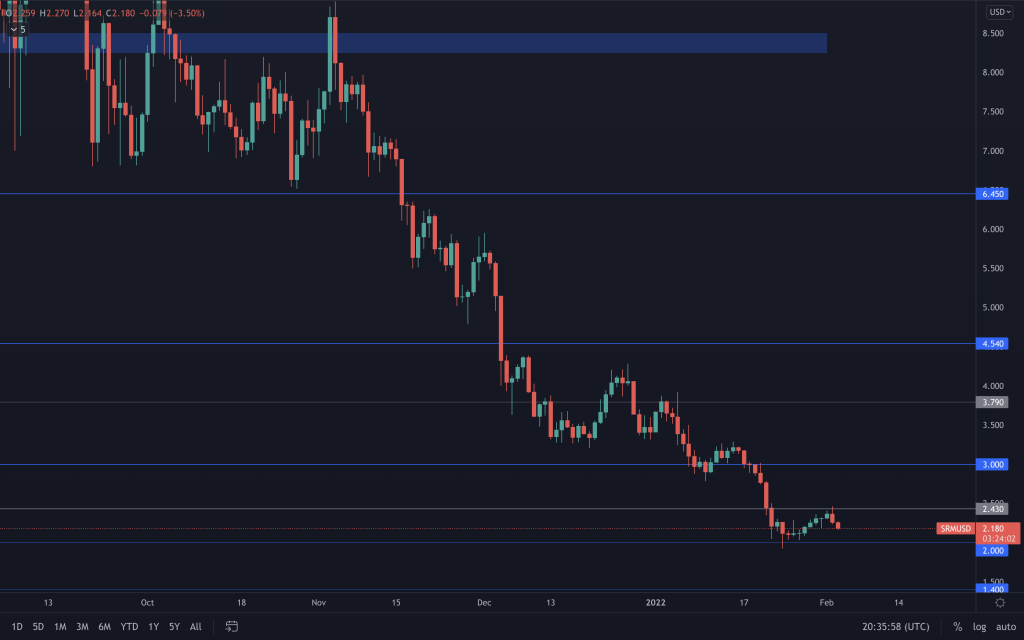
SRM remains in a downtrend, and to begin seeing the start of upside, it would first need to reclaim $3. $1.50, or even $1, isn't off the table until then.
FTT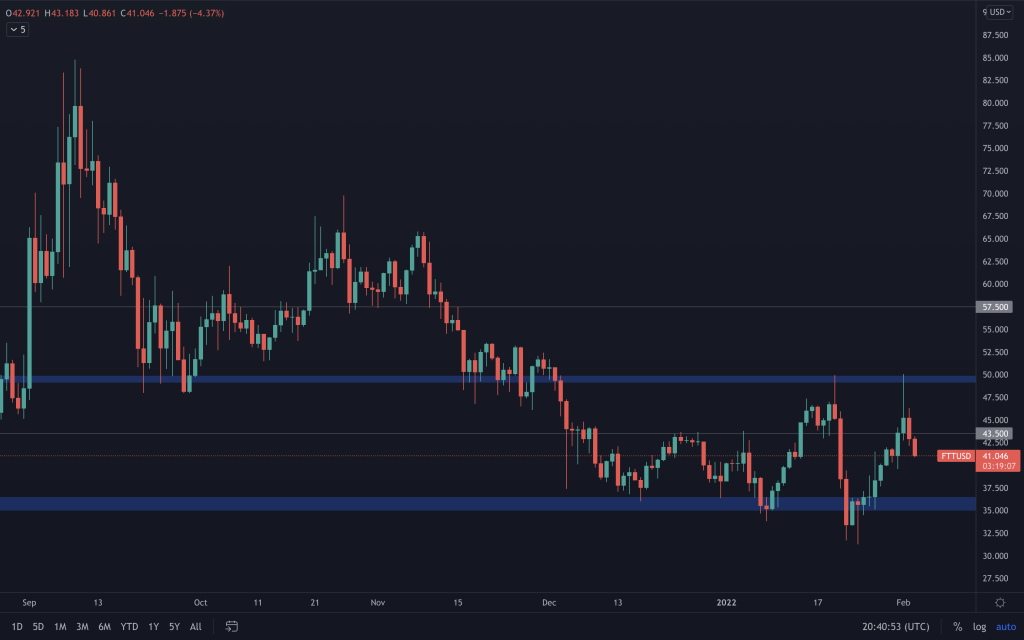
FTT closed yesterday's candle below $43.50, which sets it up for another run towards the bottom of the range at $35.
MINA
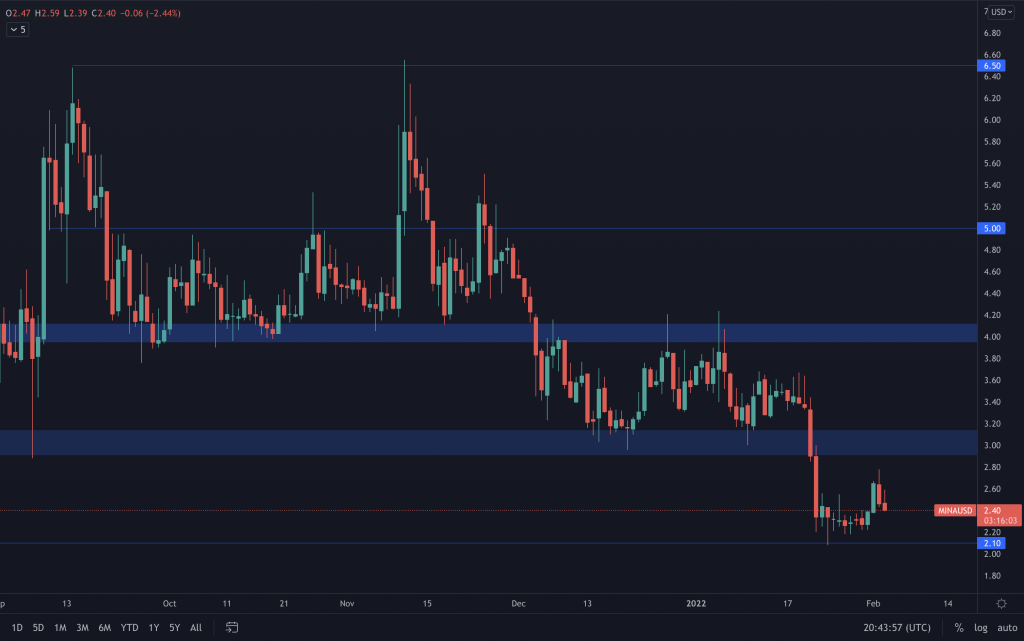
Mina remains between $2.10 and $3, and we are awaiting a breakout of this range to see where it's headed next.
dYdX
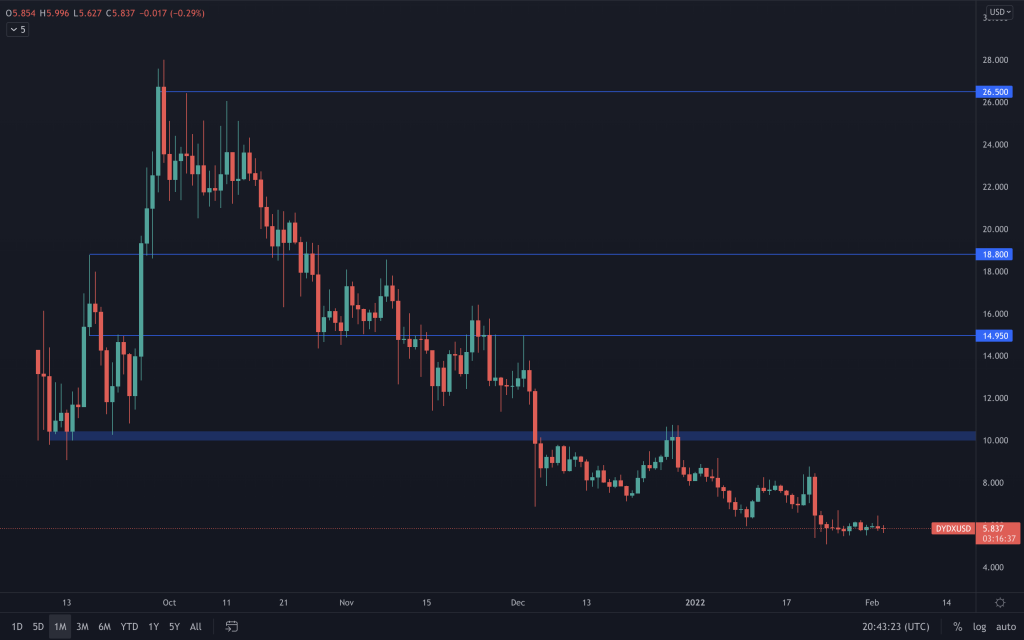
dYdX has moved sideways for several days, but overall it remains in a downtrend. As it approaches our area of interest ($3-$5), we'll be looking for signs of a reversal.
Recommended from Cryptonary


