Save 23% ($351) & Get a Free 1-1 Call with our Team ⏰ : 0d 2h 59m 44s
Disclaimer: Not financial nor investment advice. Any capital-related decisions you make are your entire responsibility and yours only.
Market Sentiment
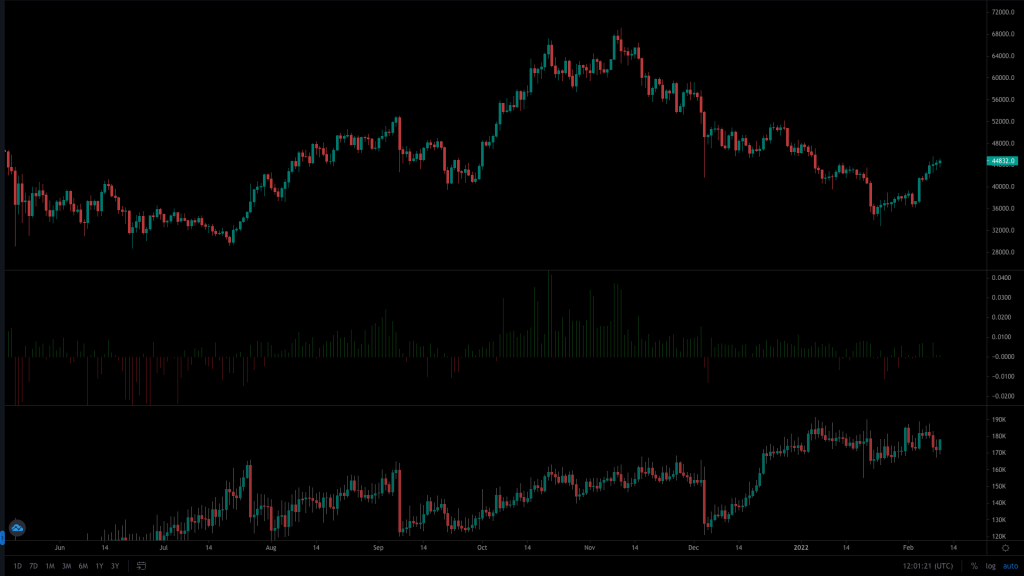
What we can take away from this data here is that the market remains unsure about the next move. As Bitcoin's price has appreciated, the Funding Rate, for the most part, is neutral, with an almost equal amount of short positions opened as long. The Open Interest has also remained relatively 'flat', which also help to convey this uncertainty.
Total Market Cap
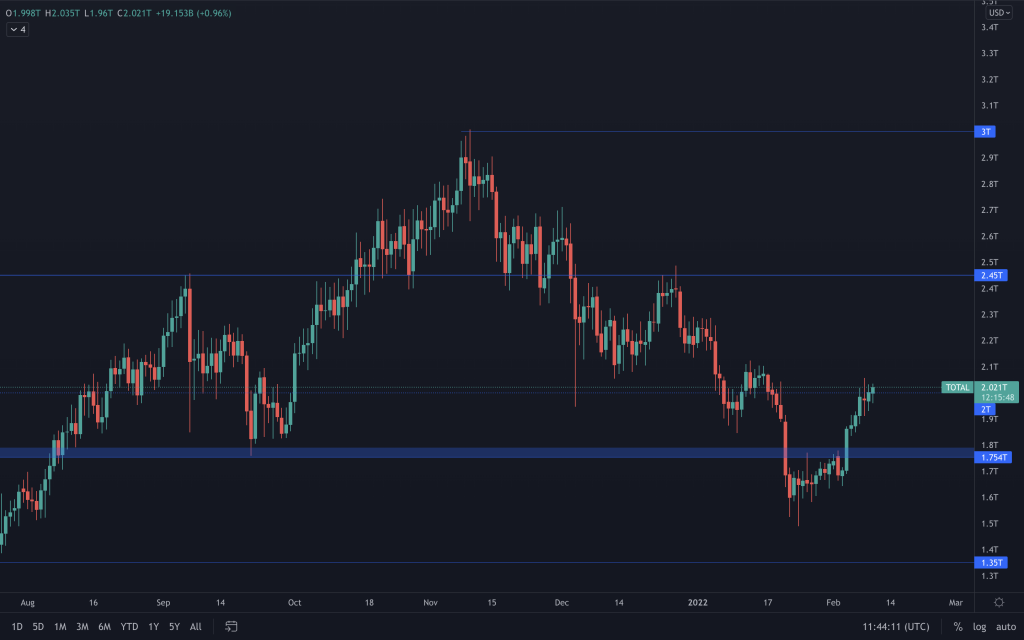
Total Market Cap has closed the day ever so slightly above $2T. Whilst we can view this as a step in the right direction, the overall bearish market structure remains intact. With the latest two daily candles conveying uncertainty in the market, we must see whether the market structure can be broken. If so, that should then give the market more confidence. At this moment in time, the lower timeframe is in a bullish structure, so that's something to take note of and observe. To think, it is odd that even with $500b (+33%) injected into a now $2T Market Cap asset class over the past month, the market is displaying signs of uncertainty.
Bitcoin
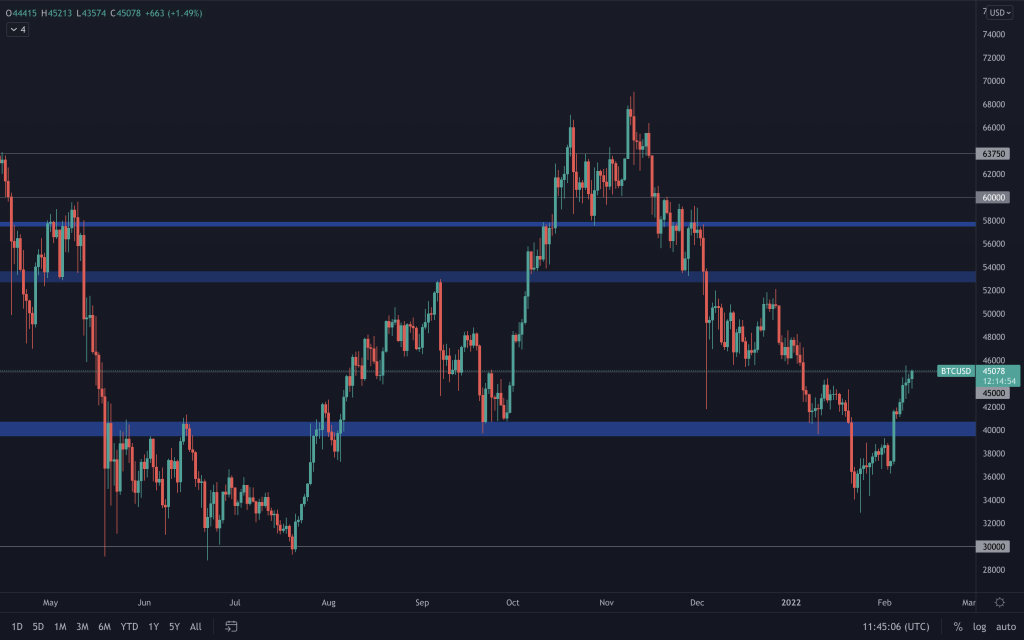
Bitcoin is in a slightly different position where it has altered its market structure, and its final hurdle is now reclaiming $45,000 as support. Until we see a break of that level, $40,000 remains possible. Given the alteration in market structure and a possible resistance 'flip', a break above opens up the possibility of a run towards $52,500.
Ether
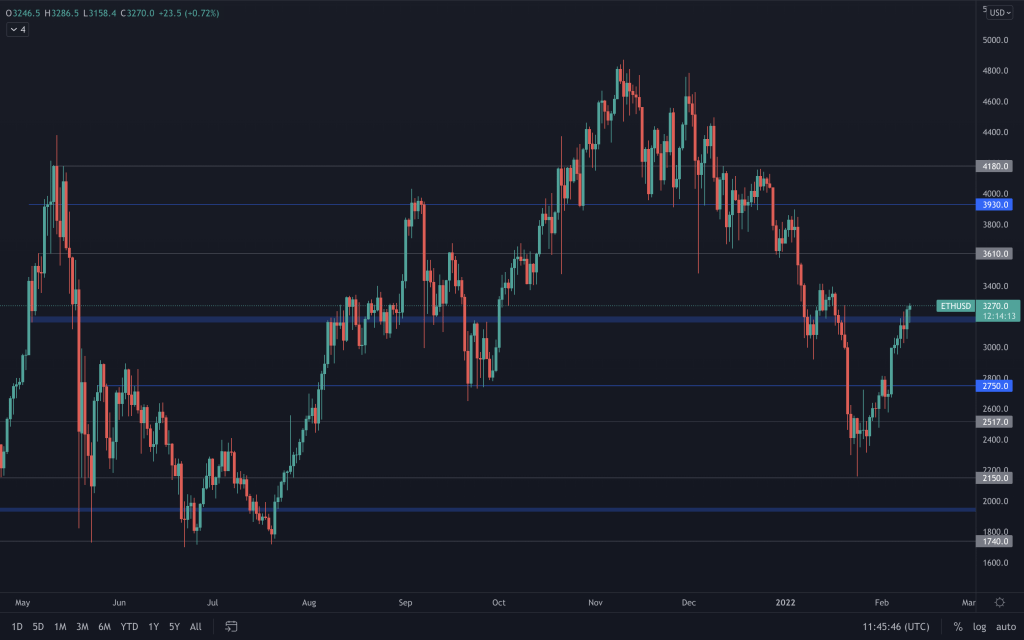
We've now seen ETH's price push through and close above $3,200. It's the same scenario with ETH as the Total Market Cap. The lower timeframe remains bullish, but it should expect some resistance until it can alter its structure too. So, in short, to turn around its downward momentum, the previous lower high also needs to be taken out.
DOT
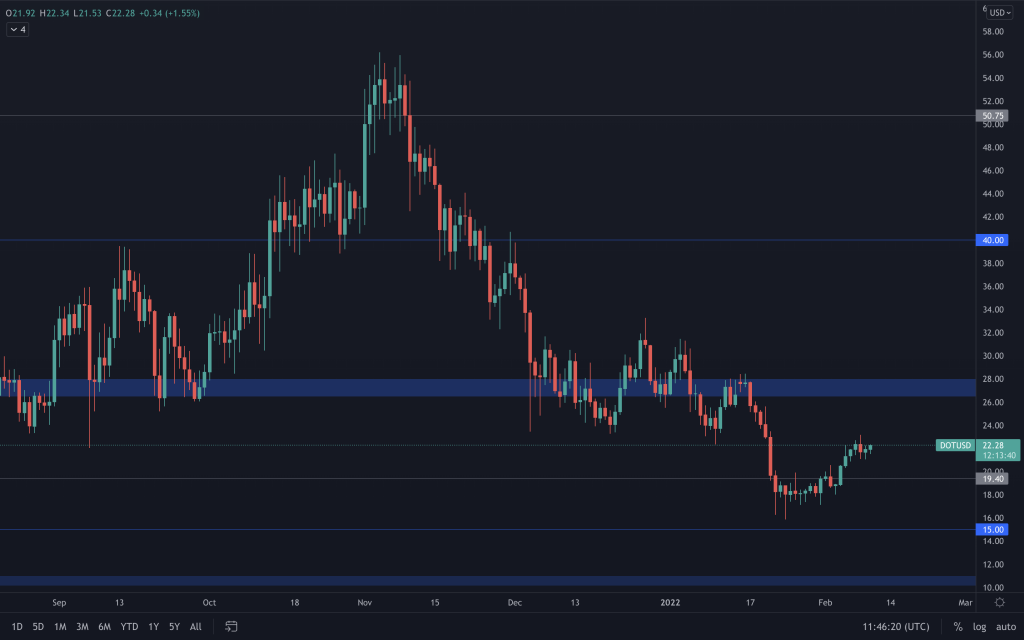
DOT remains at the mid-point of its range ($19.40 - $26.50). As you can see from the chart above, reclaiming the $26.50-$28 liquidity area would also alter DOT's structure and offer it the chance to run at $40 once more. Until then, it's simply in the middle of this range and will likely move with the majors, for now.
SNX

SNX has managed to hold onto the $5.50 support, and, as long as that is true, $7.50 is up next. It has altered its structure on the weekly timeframe, so we'd put higher odds of seeing a run to $7.50. To add, this would be invalidated with a weekly close underneath $5.50.
RUNE
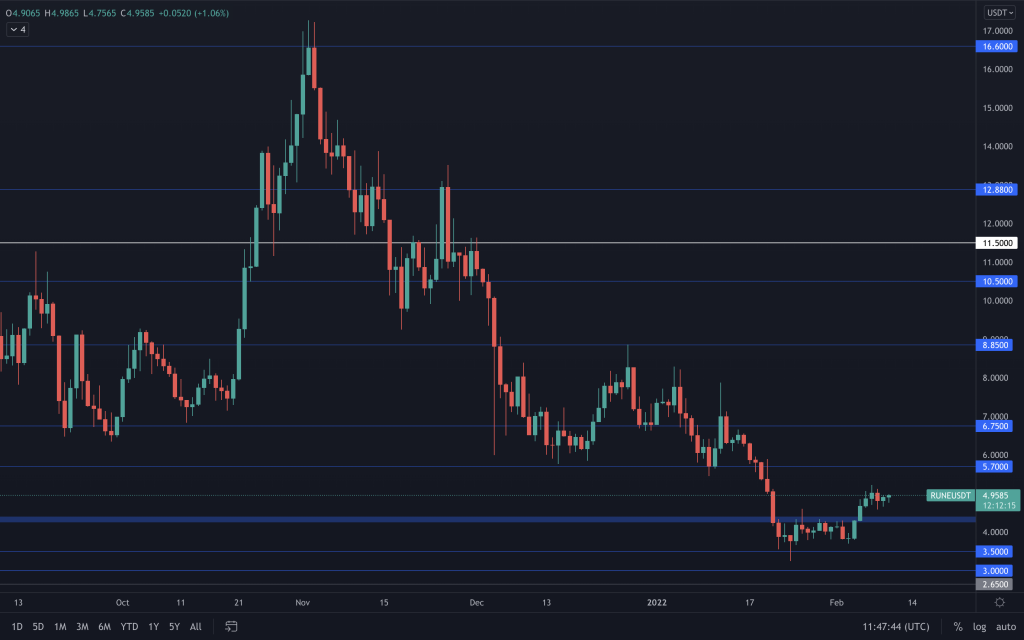
RUNE is still trading between $4.40 and $5.70, and the price has pretty much stalled since breaking above $4.40, reflecting the indecision in the market. Our interest lies in RUNE reclaiming $6 in the coming weeks/couple of months, as that would certainly decrease the odds of further downside.
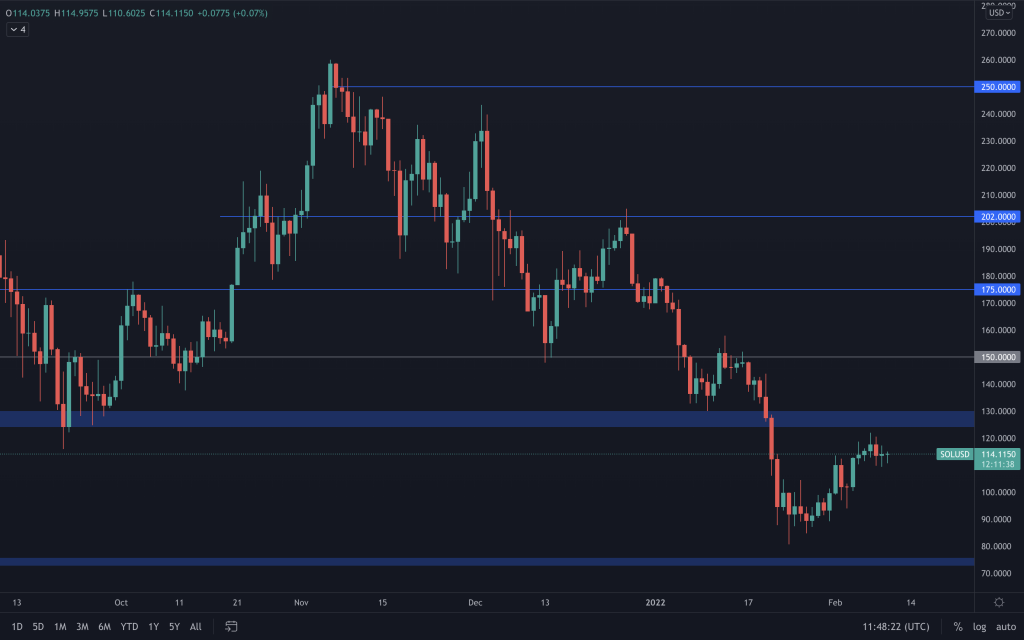
SOL
SRM
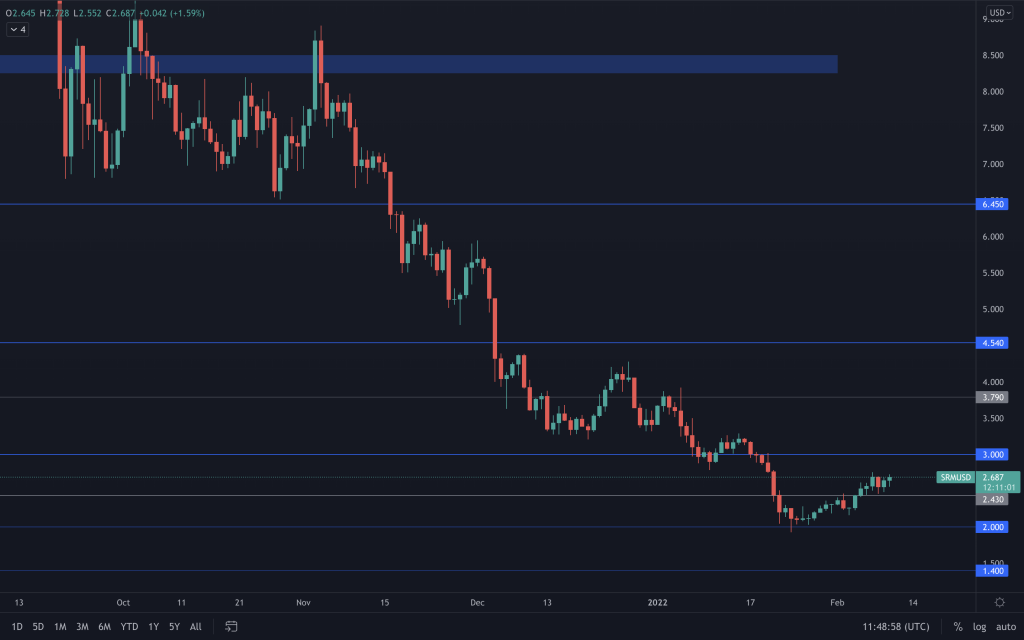
SRM is simply trading between $2.43 and $3. Reclaiming $3 on the weekly timeframe should be enough to relieve the downside pressure and see SRM begin moving up.
FTT

MINA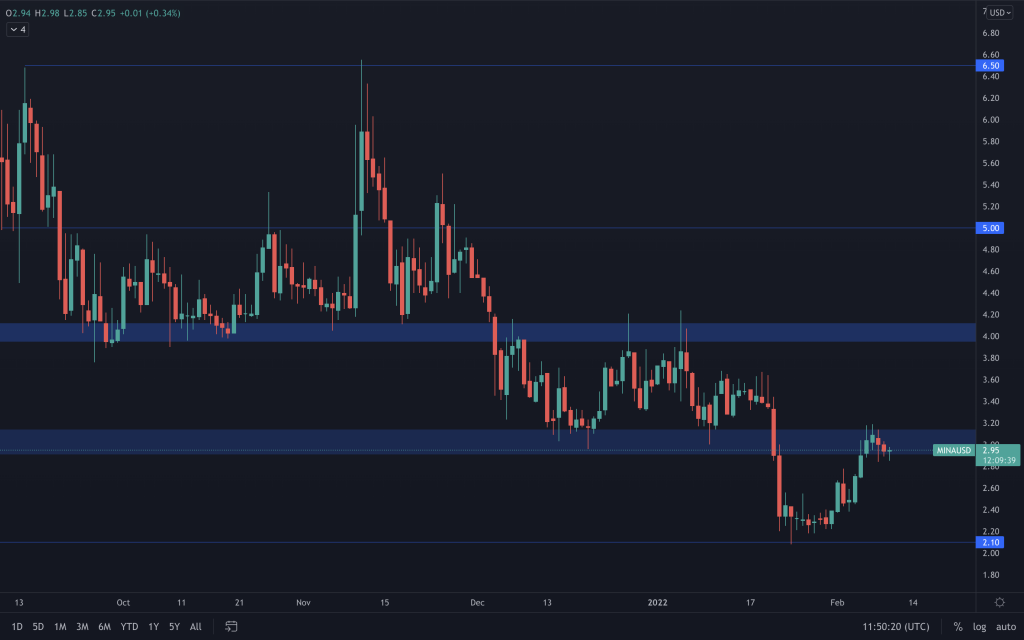
After the initial break below $3, MINA headed straight for its $2.10 support, where it spent over a week testing it, and each test of support makes it weaker, putting it in danger of a break below. The result, however, was a move up towards $3. So far, it has failed to reclaim this level and finds itself in a bearish structure (easily seen on the weekly timeframe).
dYdX
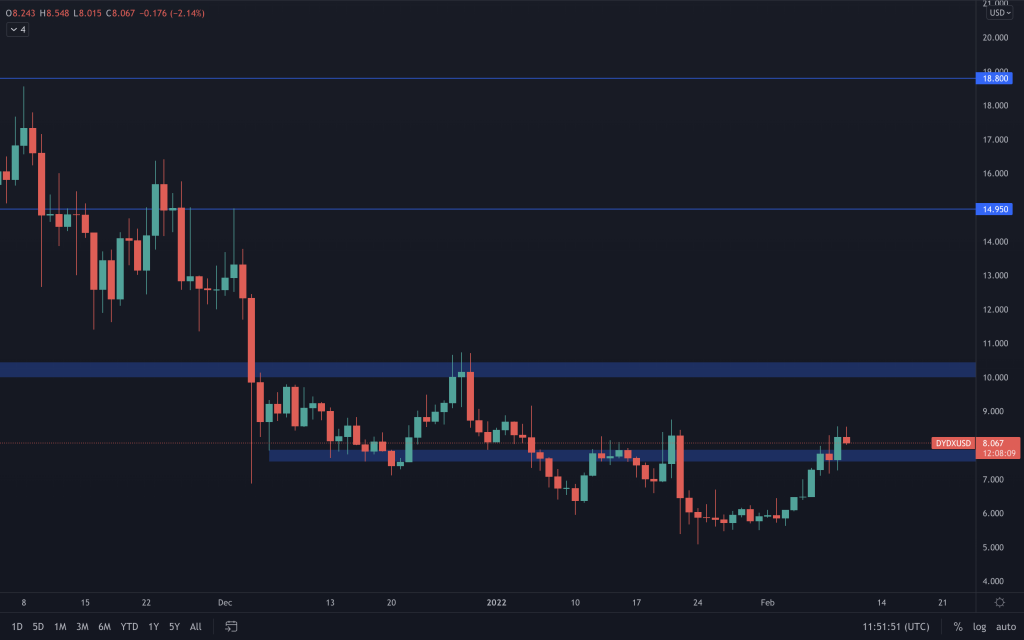
After coming ever so close to $5, dYdX has seen a nice appreciation in price. A weekly closure above $7.85 should, at least, see dYdX push up to $10. Naturally, reclaiming the $10 level would be a positive step for dYdX that should see it on the road to recovery. Failure to hold onto this $7.65-$7.85 support on the weekly timeframe leaves it with the possibility of further downside.
Recommended from Cryptonary


