Save 23% ($351) & Get a Free 1-1 Call with our Team ⏰ : 0d 2h 59m 45s
Disclaimer: Not financial nor investment advice. Any capital-related decisions you make are your entire responsibility and yours only.
Market Sentiment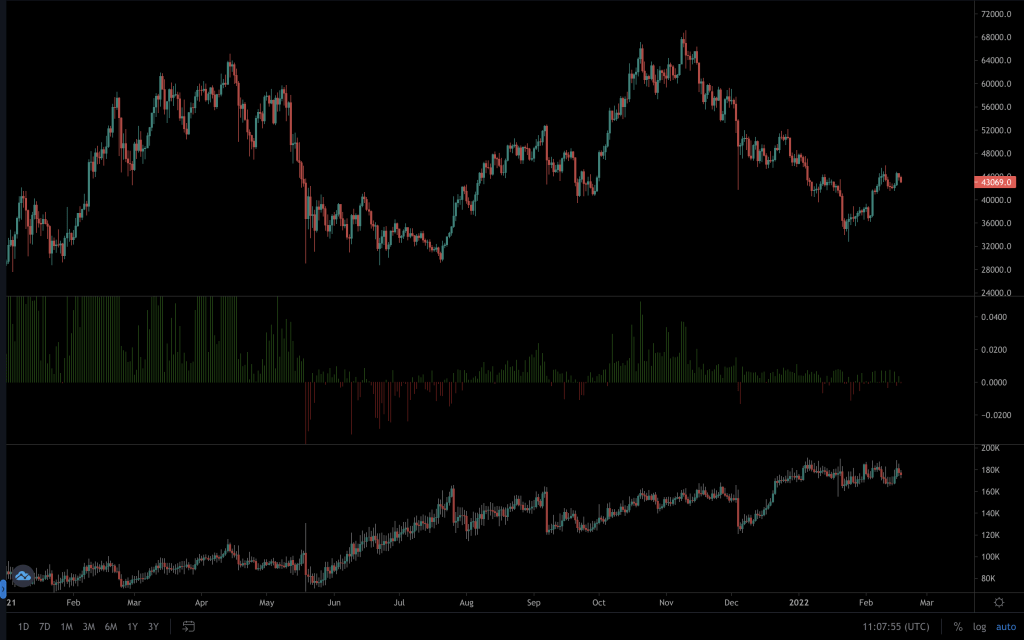
Over the past week, we have seen the Funding rate 'popping up' to positive, but not for any sustained length of time. Also, the Open Interest has pretty much flat-lined since the end of December, instead of complimenting the appreciation in price with an appreciation of its own.
These convey somewhat of a lack of confidence in Bitcoin's move towards $45,000, as new/existing participants are apprehensive about any/further exposure to the market.
Market Indices
Total Market Cap
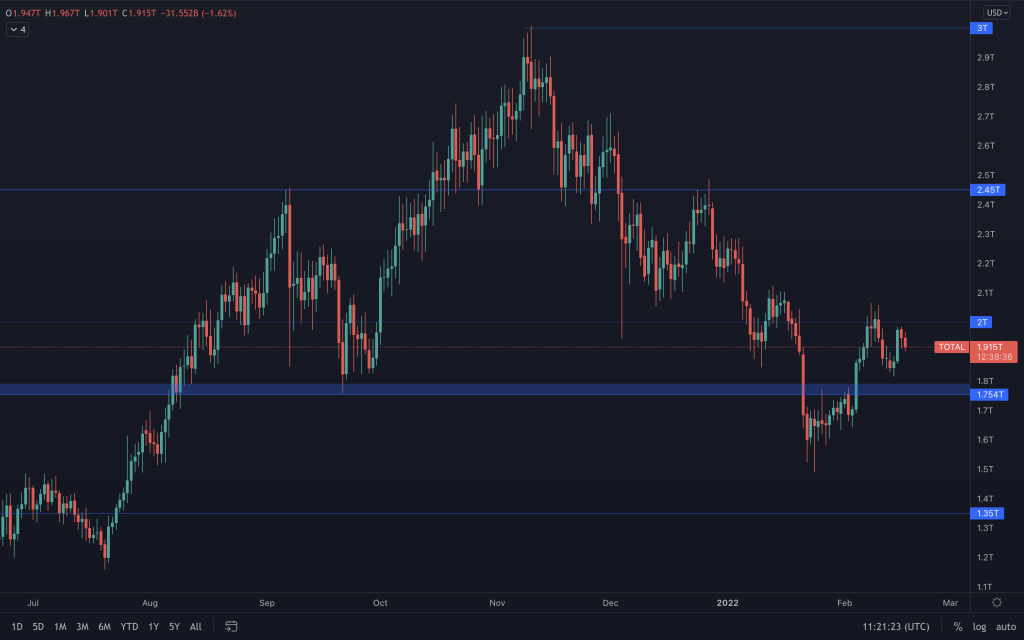
Total Market Cap has failed to make any advance since it met and found resistance at $2T, keeping it in a bearish trend for now. However, it continues to trade above the significant $1.75T level. Should this level be lost, the odds increase that this index would go to $1.35T.
Altcoins' Market Cap
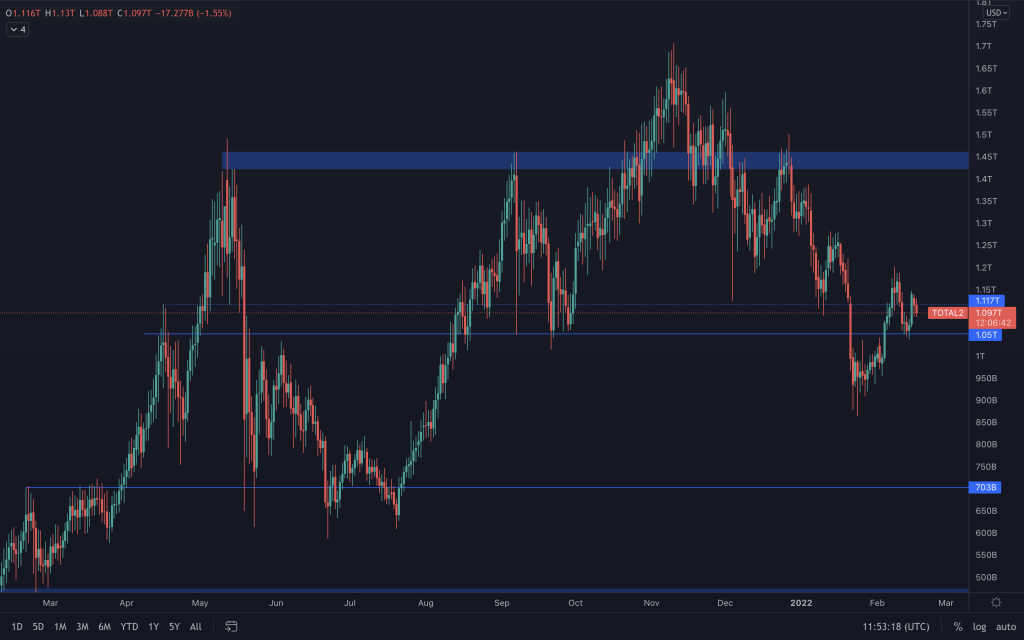
Very much the same can be said for the Altcoins' Market Cap. It is above $1.05T, has created a higher-low but, so far, continues the creation of lower-highs. Until there's a confirmation of market structure change, this is still in a downtrend.
Bitcoin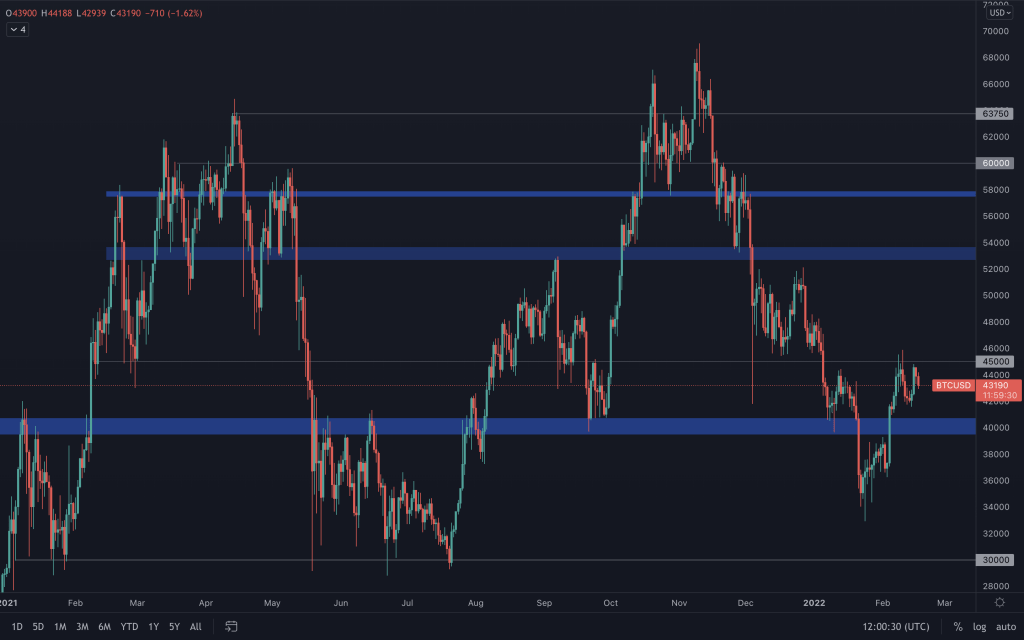
Bitcoin is the only chart to have a bullish structure. While we can view this as positive for Bitcoin (it does occupy 40%+ of the Total Market Cap after all), it contradicts the rest of the market. Bitcoin remains in the $40,000-$45,00 range at this moment, and we await to see the direction of a breakout. As we've mentioned previously, the flip of $40,000 from resistance into support was interesting, especially when coupled with market structure changes.
Ether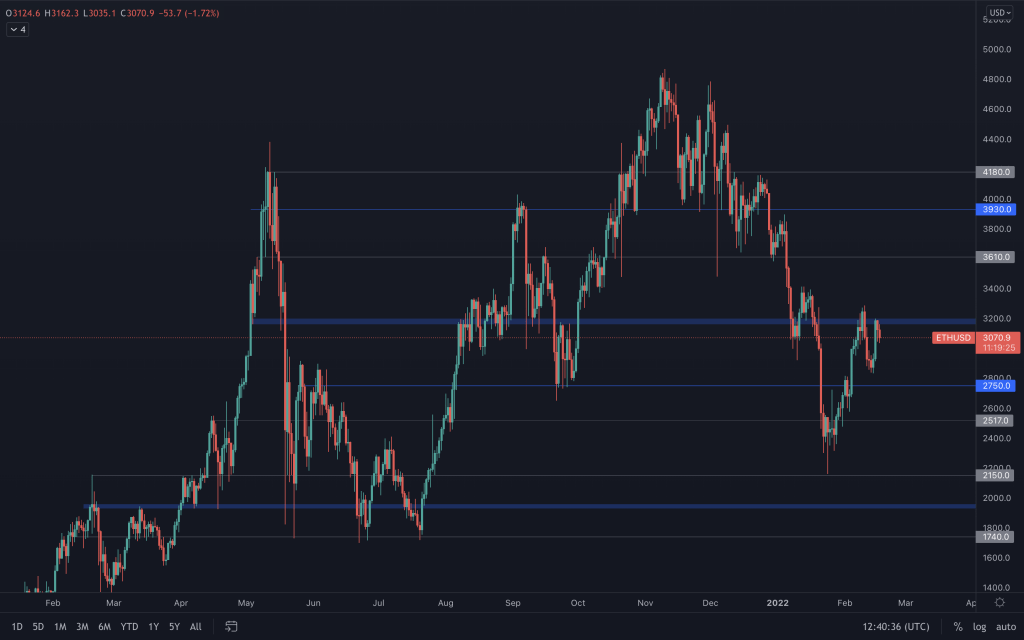
ETH's short term run has allowed it another advance on $3,200. It had failed to maintain $3,200 as support once previously, losing it the very next day. But in terms of market structure, that could be considered a healthy pullback (creating a higher low within its range). We are waiting to see whether it can reclaim $3,200 once again, offering it the chance to alter its market structure, which would open up the possibility of an eventual move to $4,000. But it's important to remain level-headed; with the lower-highs unbroken, the overall market structure remains bearish at this moment in time.
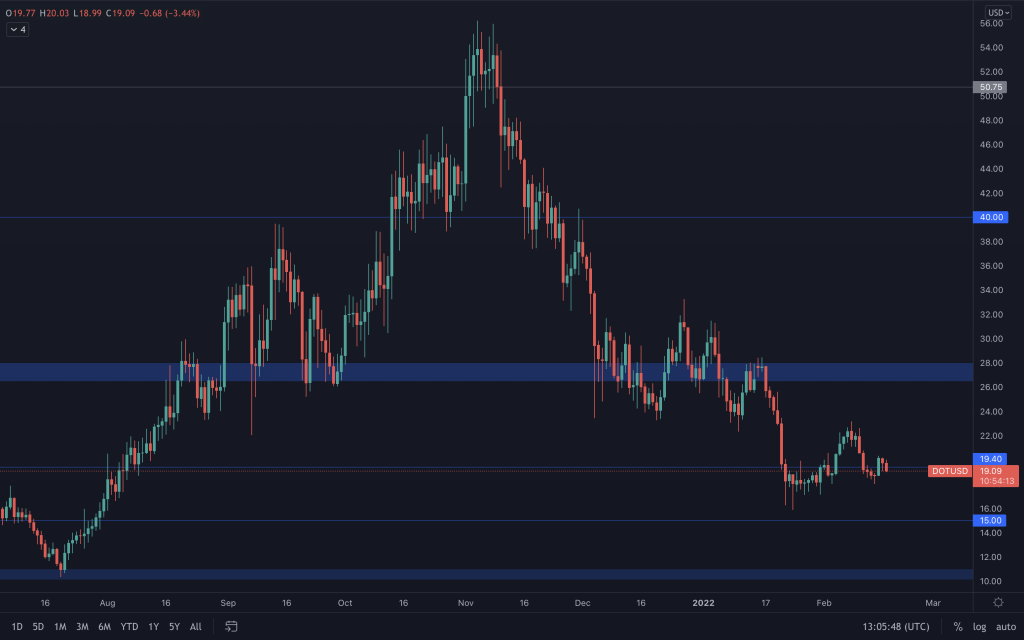
DOT
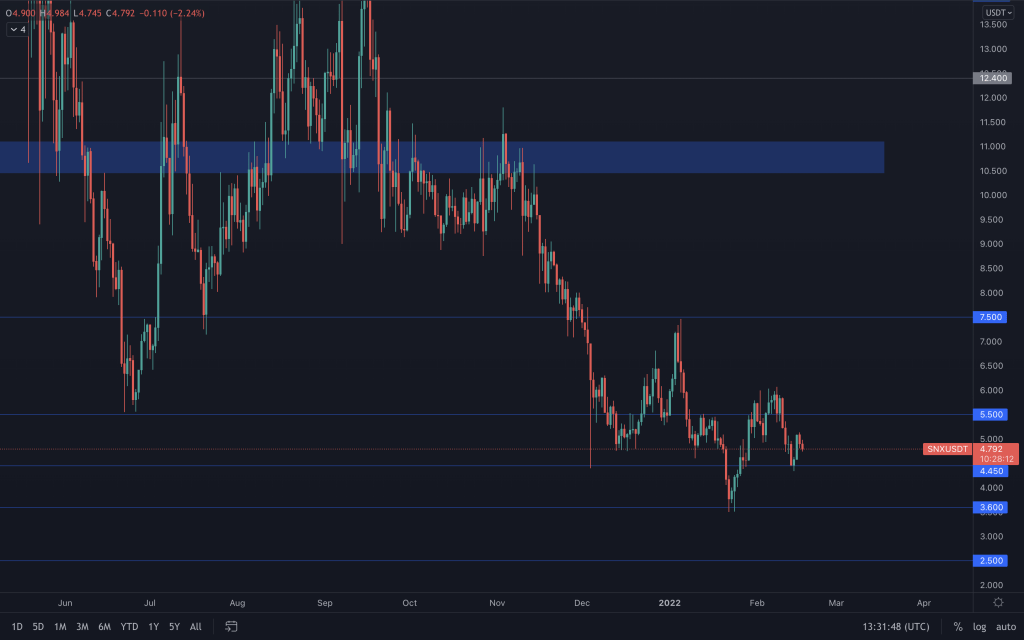
SNX
RUNE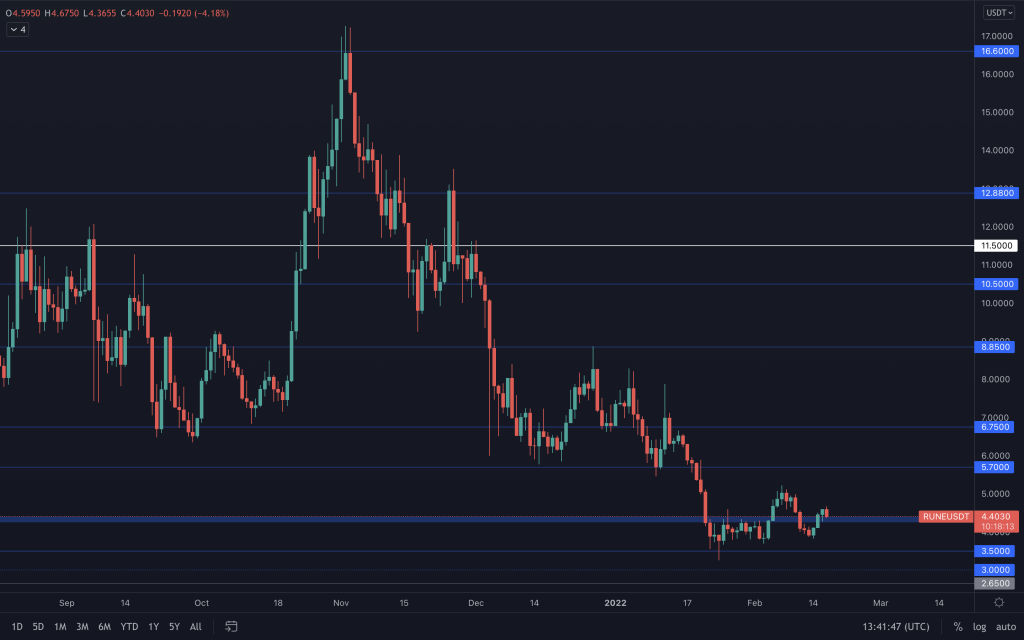
With the volatility in the market at the moment, RUNE has been no exception. We've seen RUNE consolidate, pop back up above $4.40 towards the mid-range (whilst creating a lower high), lose it as support and reclaim it once more. At the moment, it is in the $4.40-$5.70 range. But it's best to await a clear direction from RUNE through a market structure change or a reclaim of $6. If it doesn't reclaim $6 in the next couple of months, it is at risk of further downside.
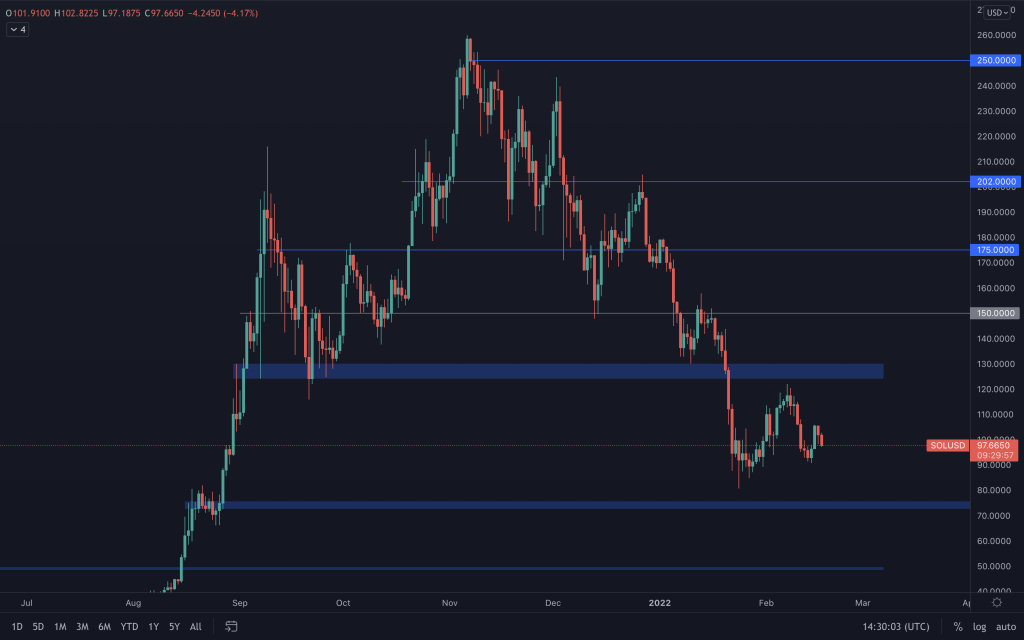
SOL
SRM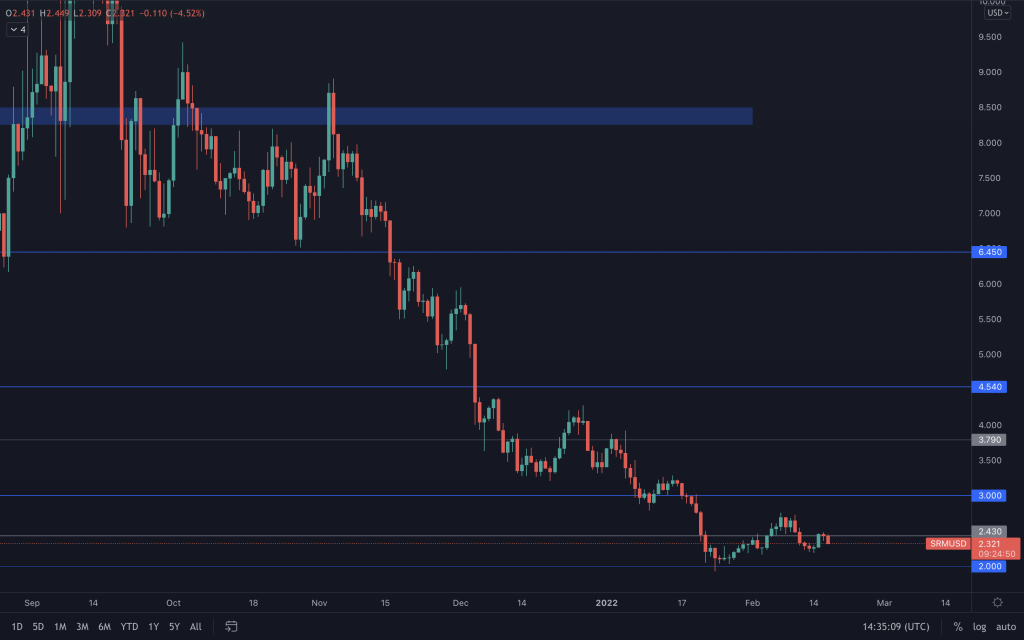
SRM did manage to close, just about, in the $2.43-$3 range but closed yesterday with indecision. We'll have to see how today's candle closes, but, like the majority in the market, it is still trending downwards for now.
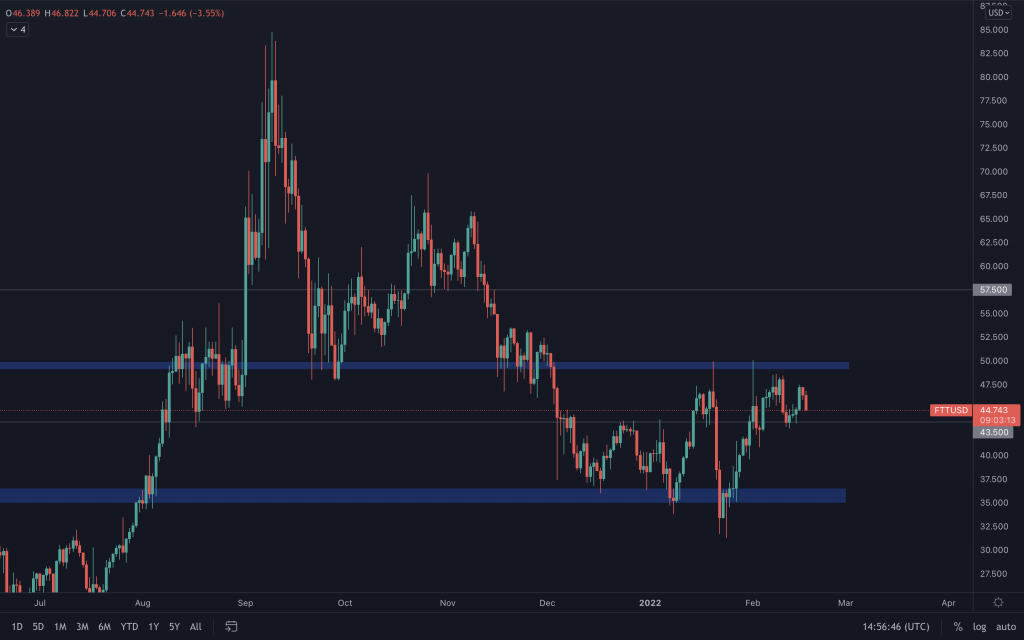
FTT
MINA
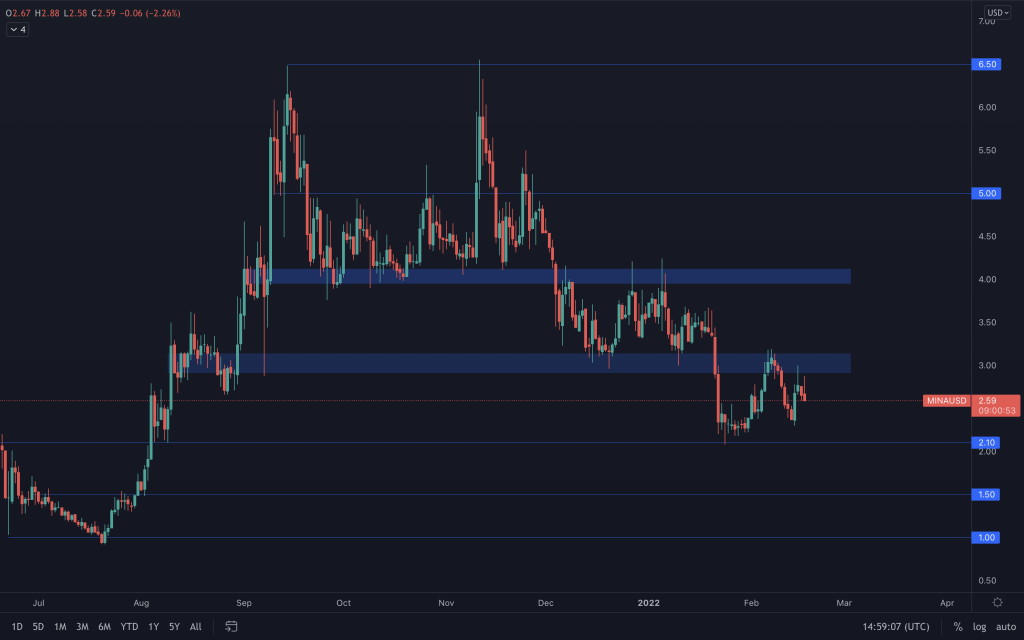
MINA's bearishness continues, twice failing to convert its resistance into support as it moves down through its ranges. Reclaiming $3.14 would offer it a run towards $4. Without that, it continues downwards, and a loss of $2.10 would see it move to $1,50.
DYDX
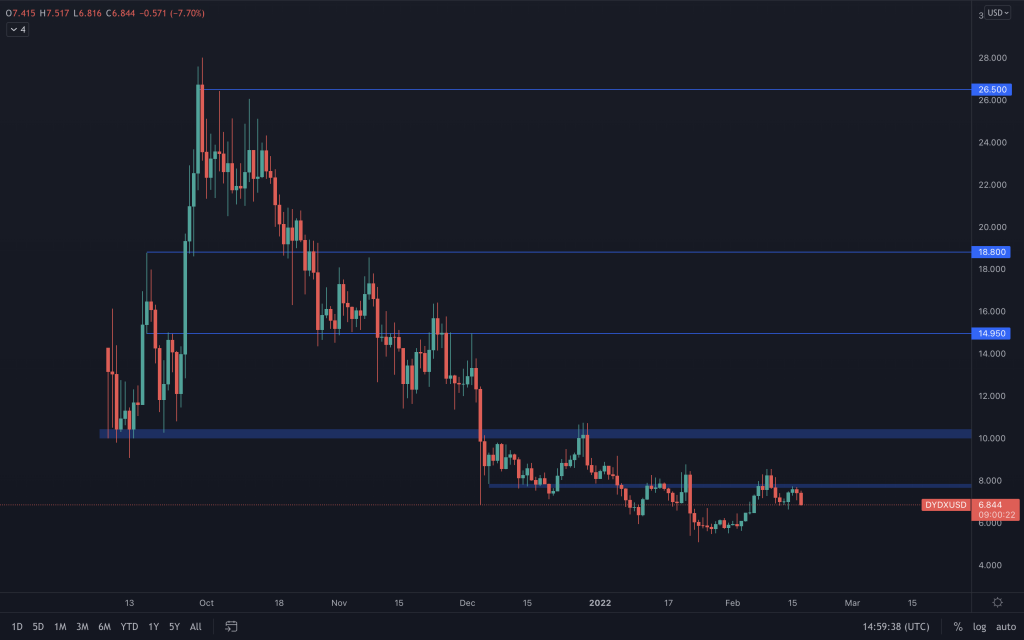
dYdX remains in an overall downtrend even though the 'selling-off' seems to have slowed down. We maintain that our interest lies between $3-$5 or a reclaim of $10.
Recommended from Cryptonary


