Save 23% ($351) & Get a Free 1-1 Call with our Team ⏰ : 0d 2h 59m 43s

Disclaimer: Not financial nor investment advice. Any capital-related decisions you make are your entire responsibility and yours only.
Video Analysis
Market Sentiment
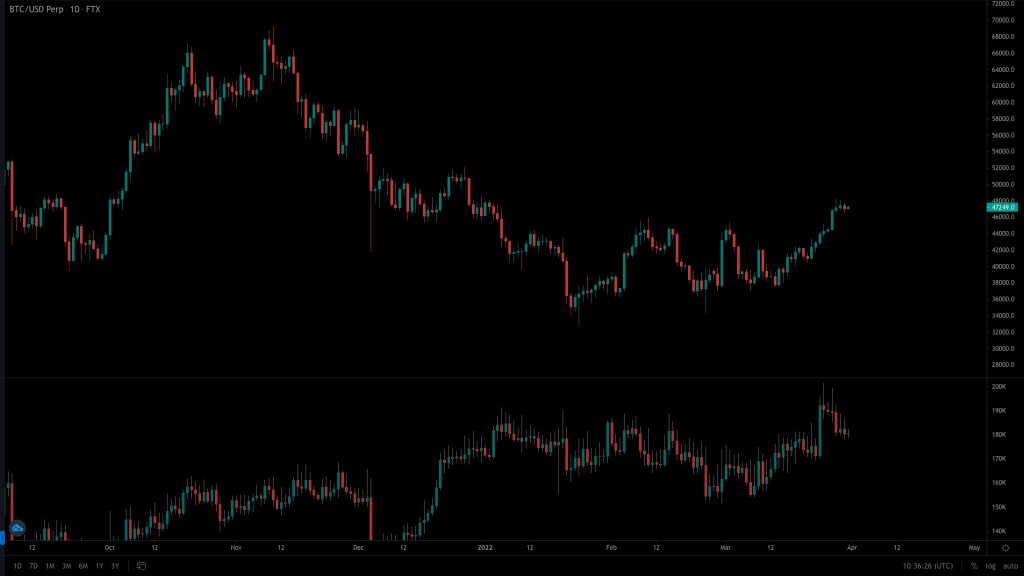
We've only included the Bitcoin chart on the top and Open Interest at the bottom this week. As the price of Bitcoin moved from $45,000 to $48,000, the Open Interest started to decline, which indicates that positions were closed. It's safe to assume that these were short positions closing due to the $45,000 resistance level being broken. With them not being replaced by long positions, it could indicate an upcoming dip in Bitcoin's price.
Market Indicies
Total Market Cap
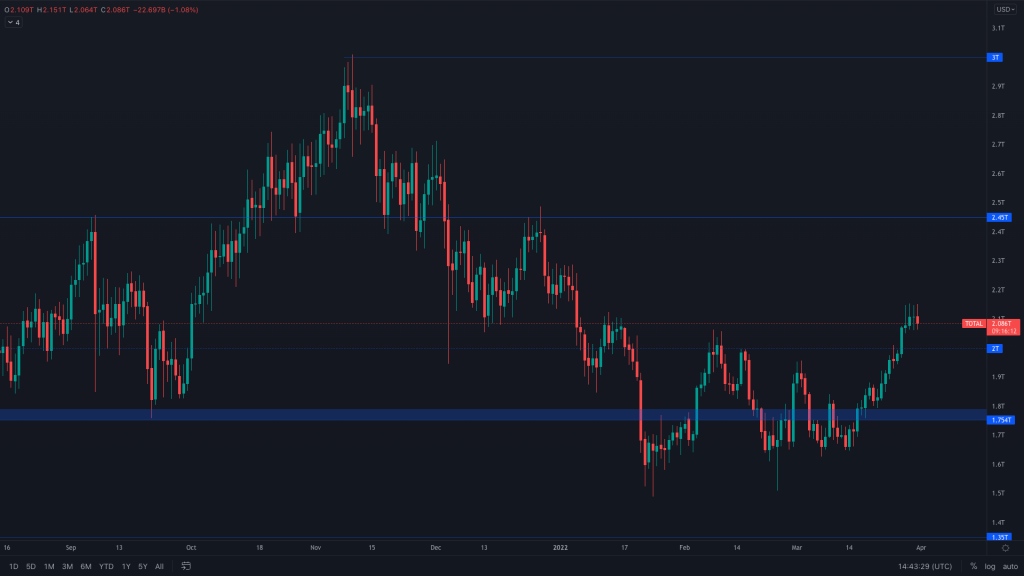
In just 14 days, the market had seen an injection of capital to the tune of almost $500B (+30%) and, in the process, confirmed a change from a bearish to bullish market structure. The index has slowed somewhat the past few days, closing yesterday as a doji (indecisive), but it still holds itself above $2T.
Altcoins' Market Cap
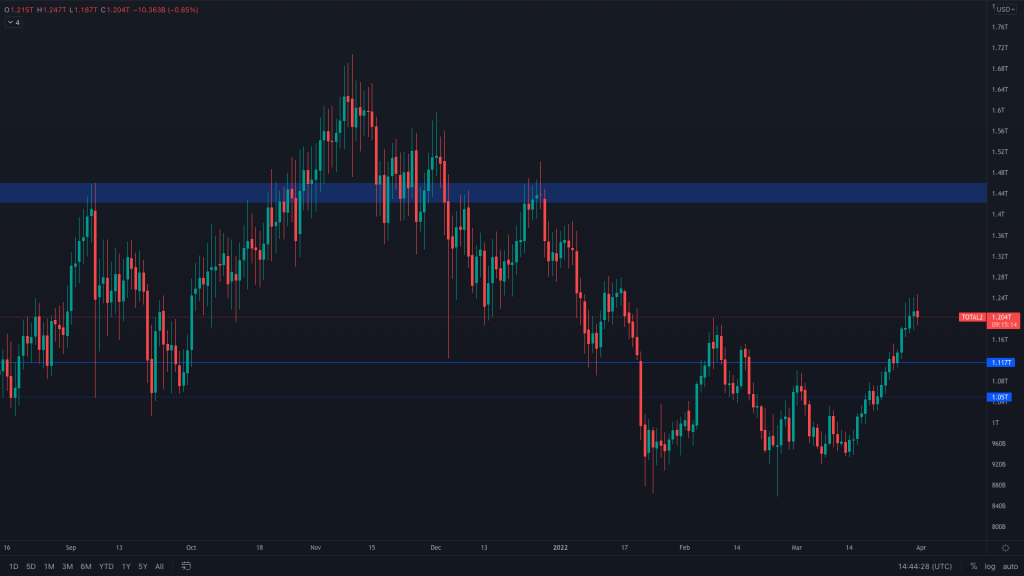
The Altcoins' Market Cap is also in a bullish trend, with $300B+ of the $500B capital inflow mentioned above being invested in altcoins.
Bitcoin
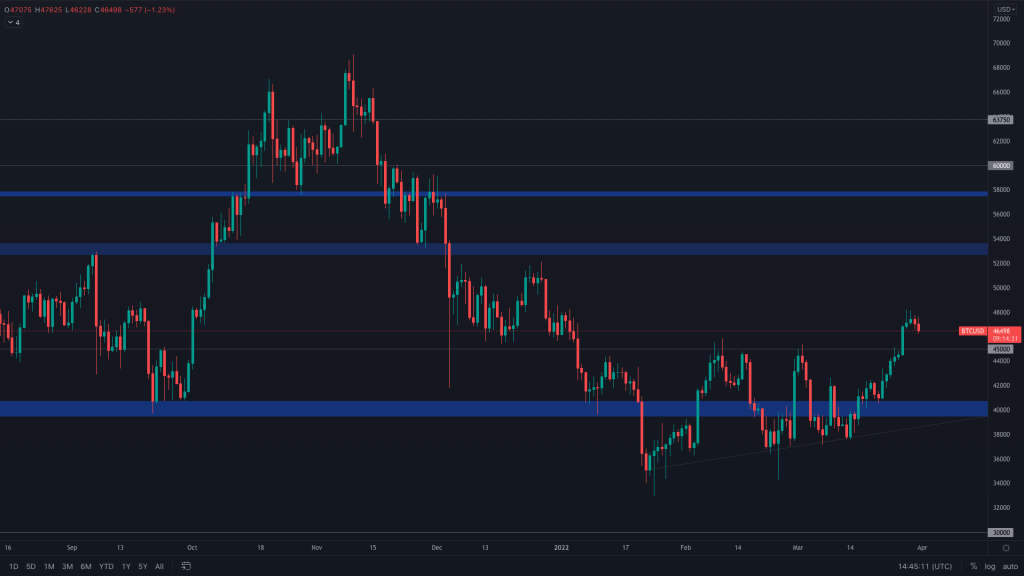
Bitcoin has also been impressive since the middle of the month as it's continued to grind up, maintaining $45,000 as support. As we mentioned in the first chart, its price has slowed as it approached $48,000, moving sideways in somewhat of a tight range. As the monthly close approaches, we may see volatility in price action. But with its bullish structure intact, $52,000 remains on the cards.
Bitcoin Dominance (weekly)
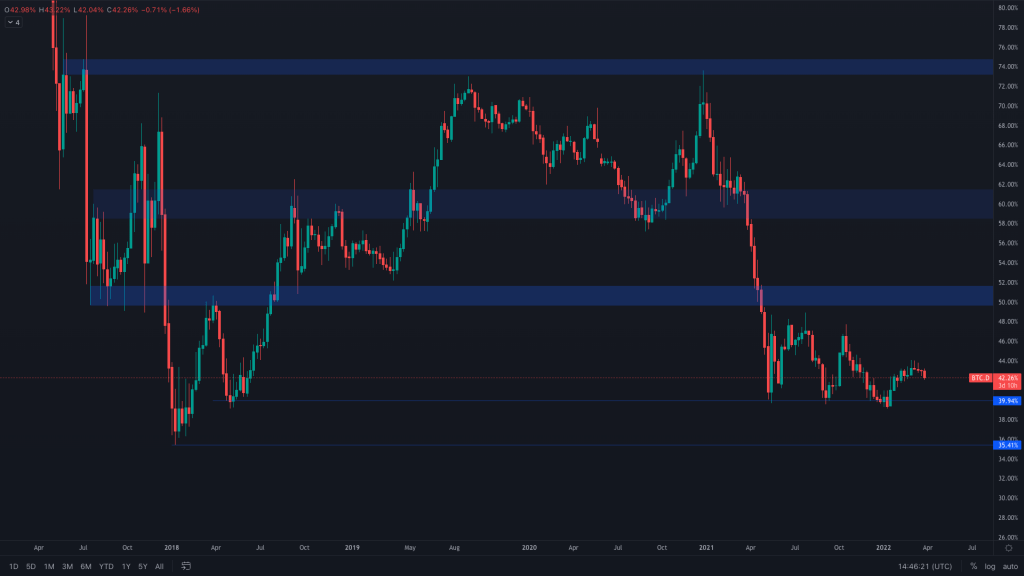
It's not usually covered, but what we can clearly see in the chart is Bitcoin dominance falling, creating lower highs, towards the 40% level. This supports an argument for altcoins continuing to outperform Bitcoin in the short/medium term.
Ether
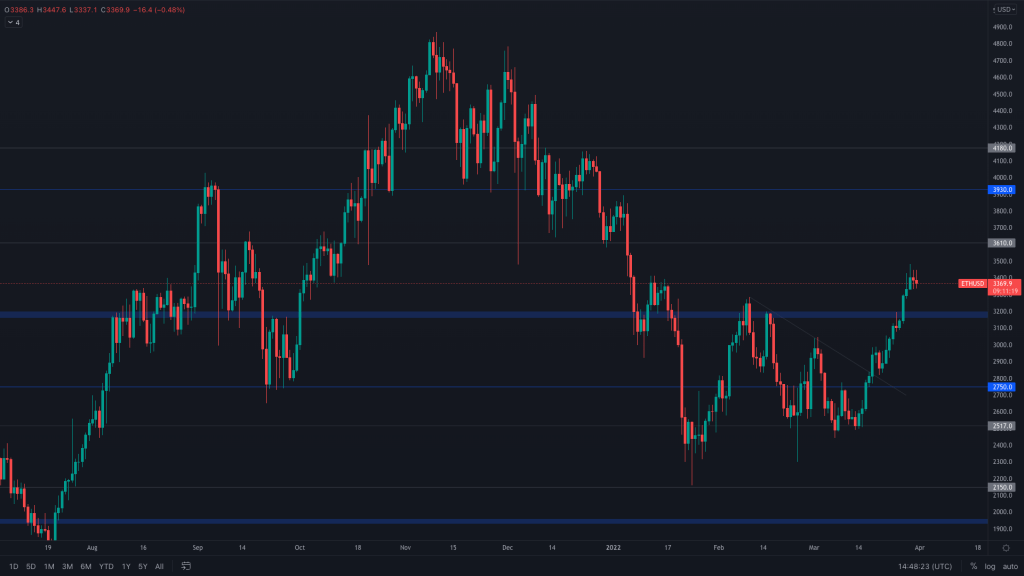
Ether looks ever more slightly bullish than Bitcoin as it continues to advance to $3,600 (the intermediate level between $2,750 and $4,000).
ETH/BTC (weekly)
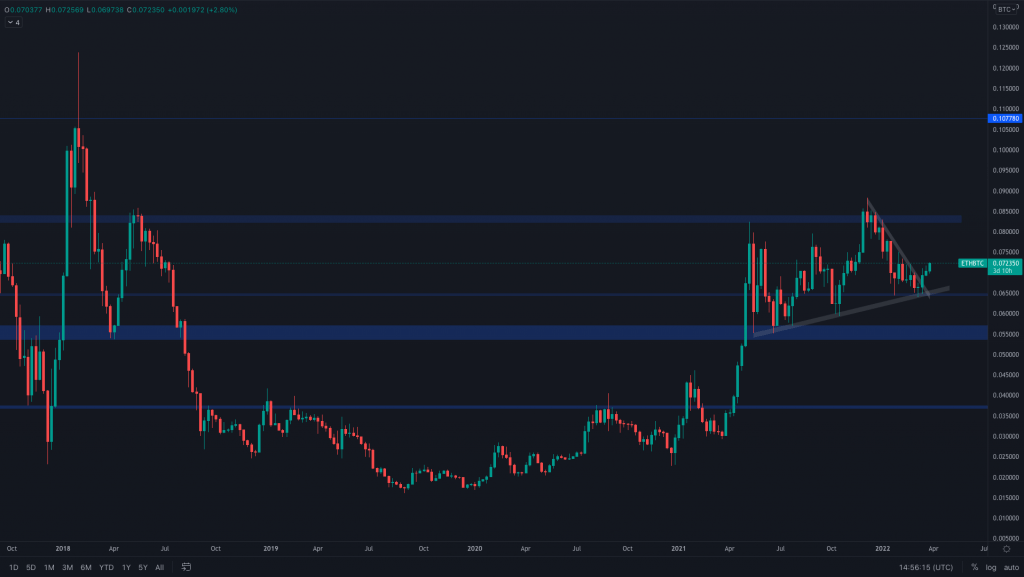
As we can see, since the test of support coupled with a breakout of the counter trend line, ETH continues to outperform BTC and has some room to go.
DOT
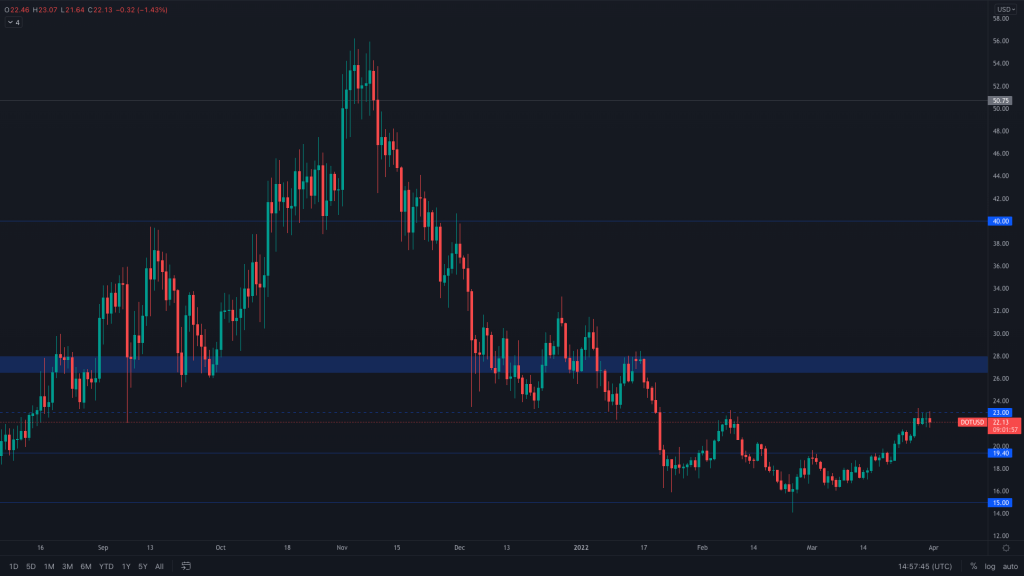
DOT continues to struggle with reclaiming the $23 intermediate level. Reclaiming this would confirm a bullish weekly structure, opening the door for a move to the $27 resistance range. Yesterday's candle closed indecisively. Invalidation of the daily bullish structure is close, so we'd expect DOT to make a decision soon.
SNX
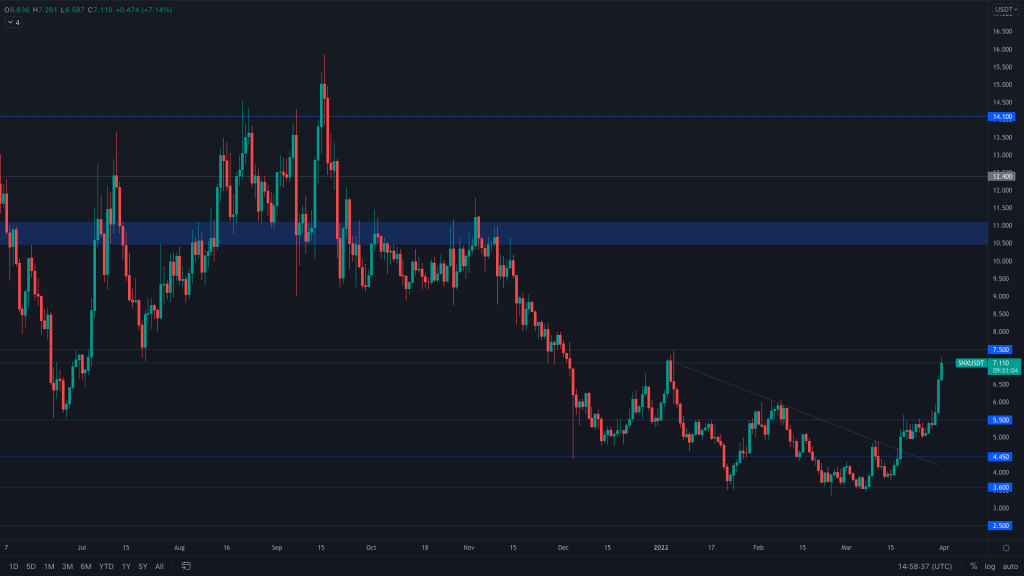
It looks like that run towards $7.50 is playing out nicely. We'd start looking towards double figures if SNX can get above $7,50.
RUNE
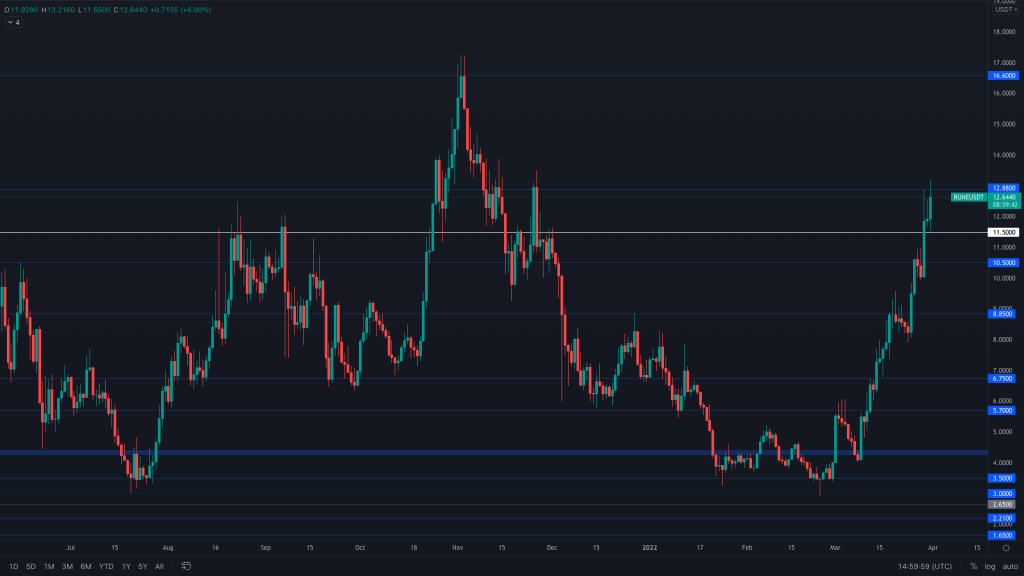
RUNE's move has been solid, and it continues to attract volume. Holding $11.50 by the end of the week will really look good for RUNE, leaving only $16.60 between it and ATHs.
SOL
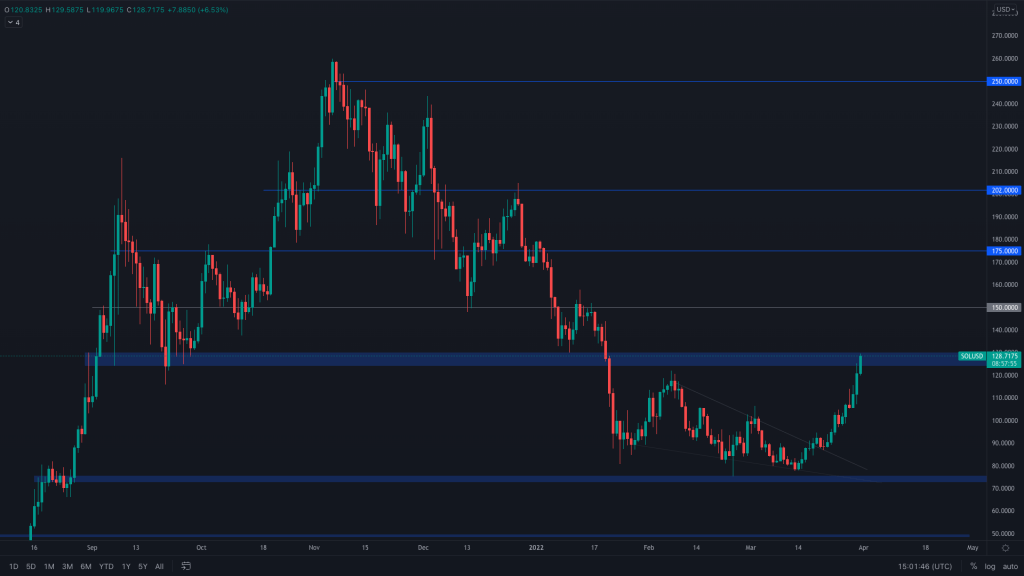
SOL has performed well since the breakout from the counter trend line. The swing trade played out nicely, and SOL has continued to push up after trading above the previous weekly lower high. Should $130 turn into support by the weekly close, we wouldn't rule out $175.
SRM
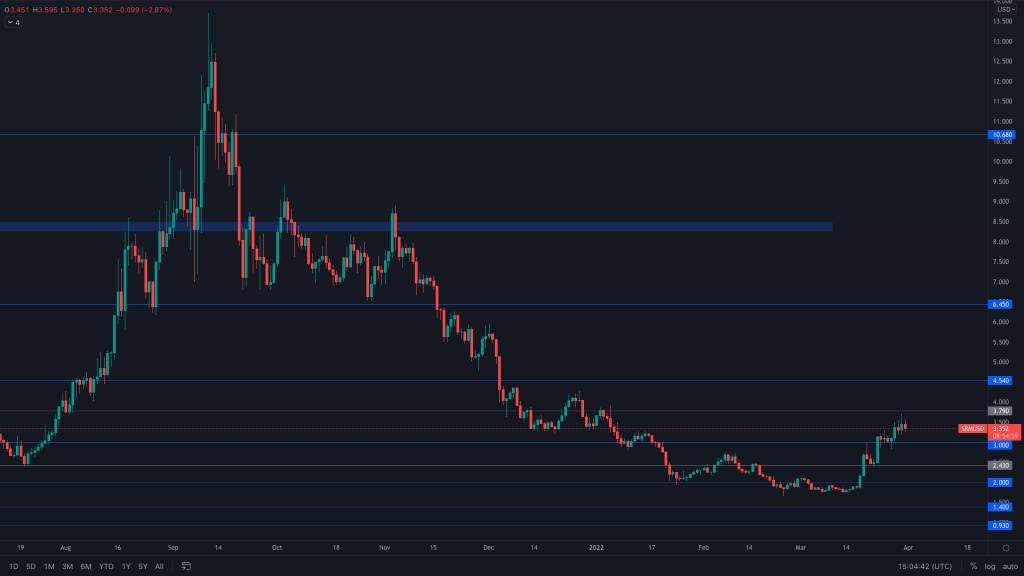
SRM also continues to attract volume and has continued to push up towards $3.79, already registering a high at $3.70.
FTT
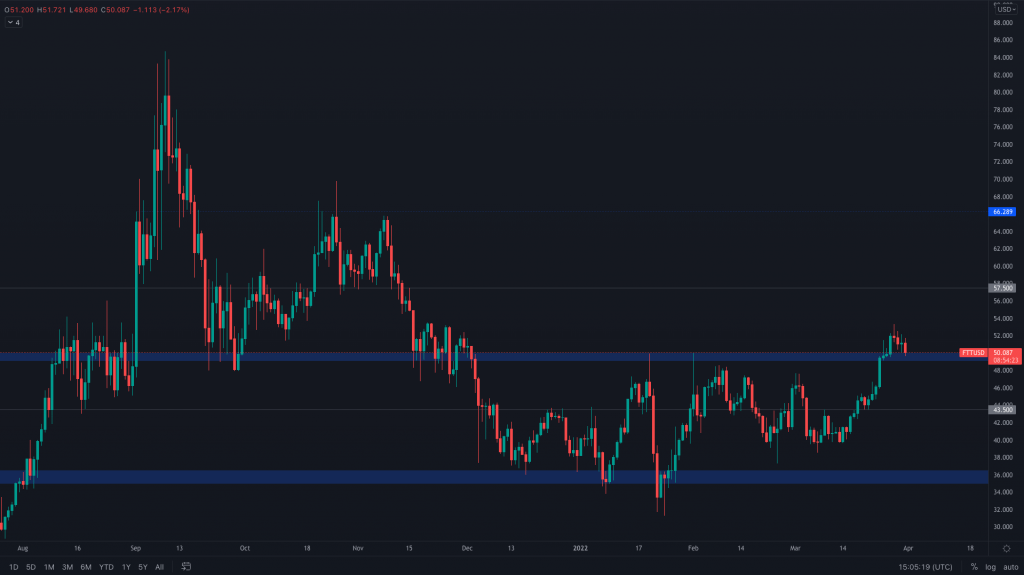
We have seen that solid breakout from $50, but we haven't seen FTT continue to move as well as the majority of the market over the past couple of days. If we see a pullback on BTC, we may see FTT lose this support. At the moment, that hasn't happened and this move is simply a retest of broken resistance. Like many assets, FTT's bullish structure wouldn't be altered even if this support was lost.
MINA
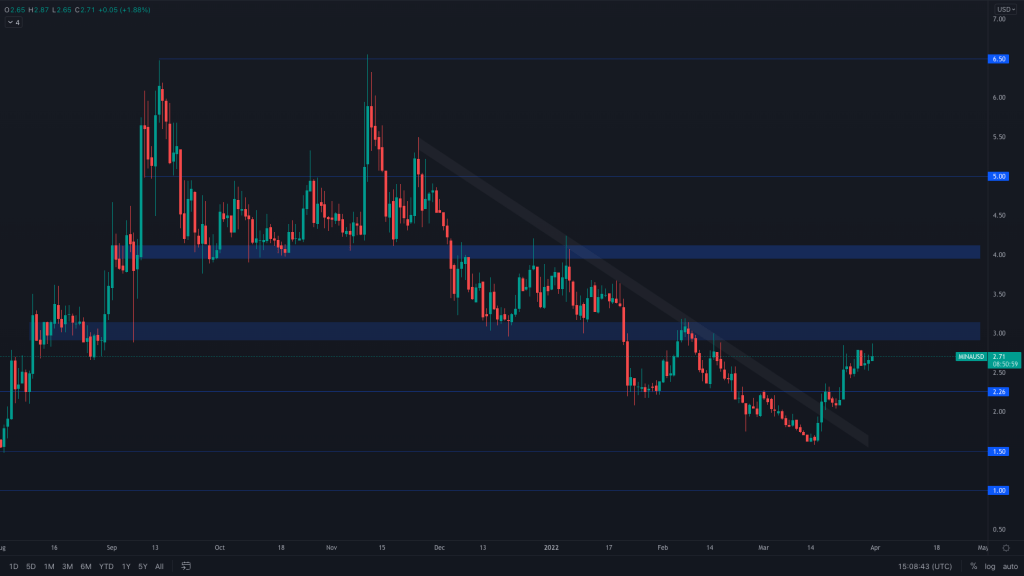
MINA's broken through two resistance levels since retesting the counter trendline. Although still averaging higher volume than before the FTX and Arrows Capital announcement, it has decreased on the latest advance on $3. It now needs to close above $3.15 to look to further appreciation in price.
dYdX
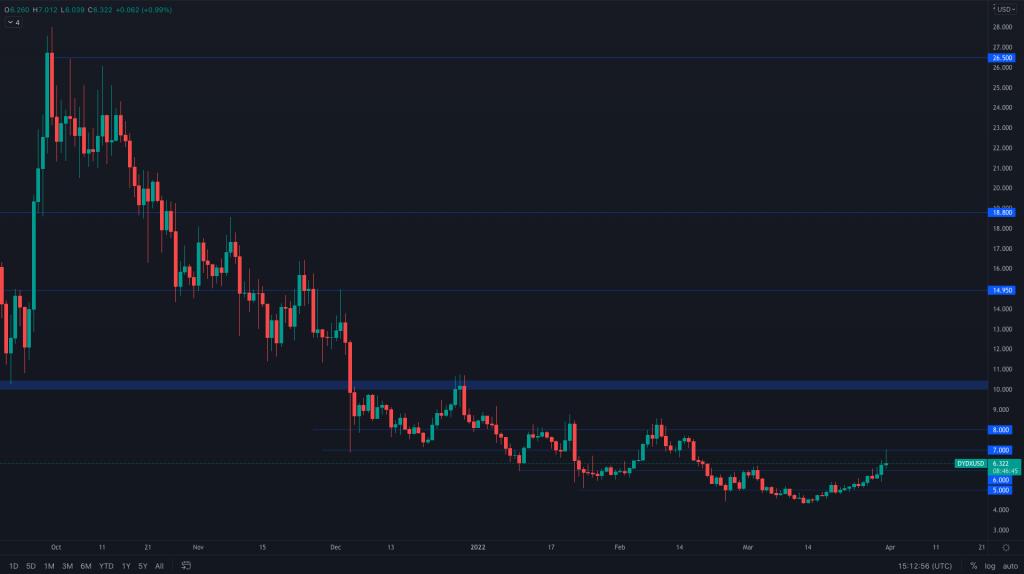
A perfect touch of $7 early on in the day, followed by a big rejection, retesting $6 as support. At this very moment, the 4H chart looks bearish with a bearish engulfing candle. Closing under $6 would bring $5 back into play.
THOR
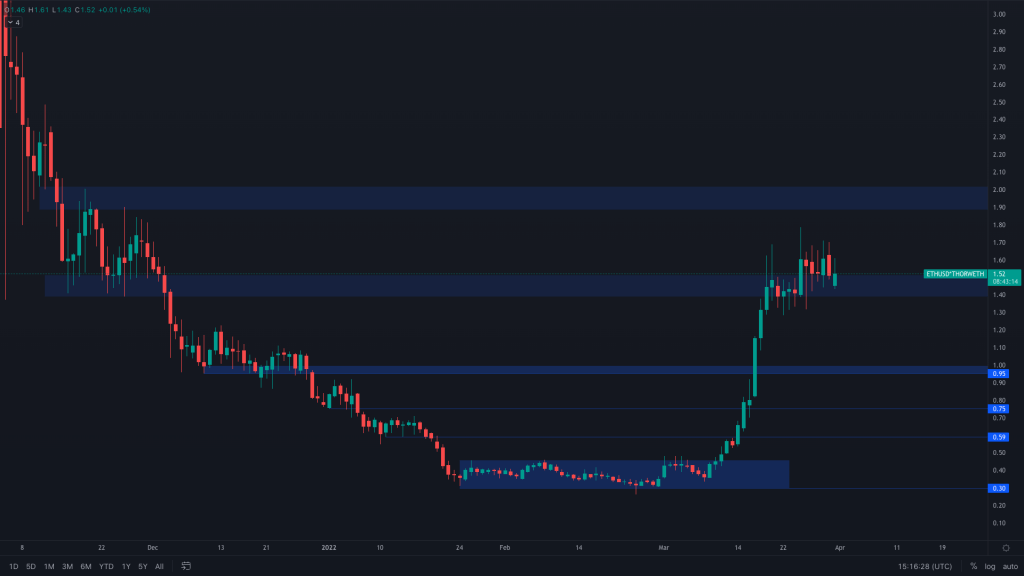
After breaking out of consolidation with 430% gains, it's only fair that THOR chills for a bit. It's managing to hold $1.40 as support. Should it lose that, the psychological level at $1 would be likely. We may not see levels respected as much as other charts with little historical price action and data points.
GLMR
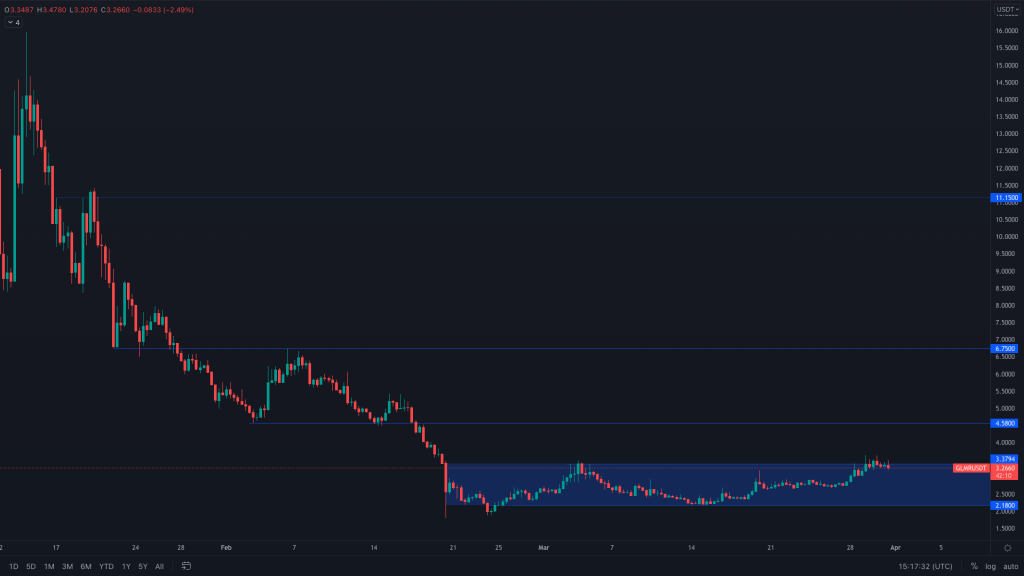
(8H chart used) GLMR is still in sideways consolidation, where a daily breakout of $3.38 should lead it to $4.50.
ACA
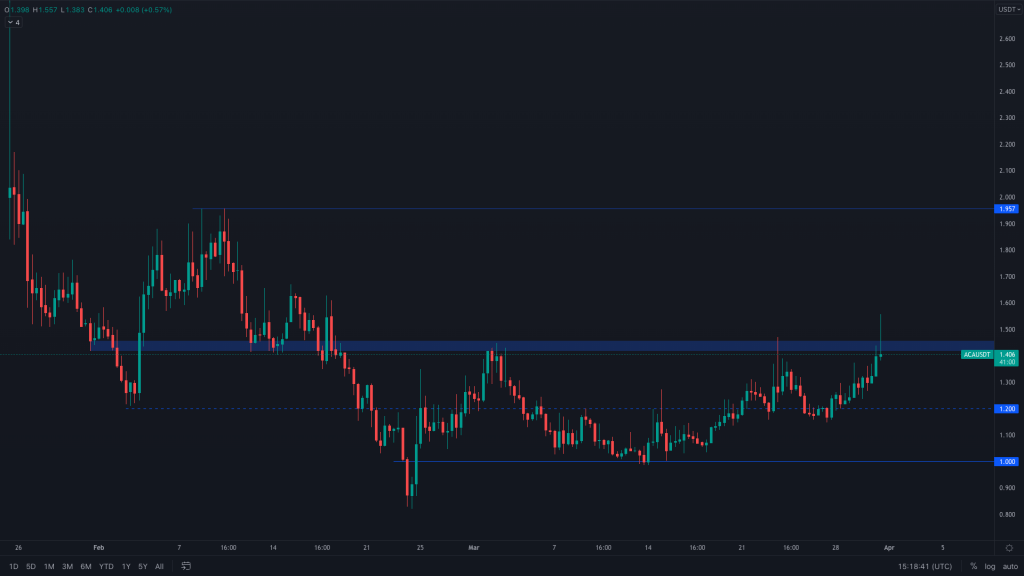
ACA also continues sideways between $1 and $1.40 but is seeing demand. Should it get a close above $1.50, that would lead it to $1.95 and beyond that, ATHs.
ASTR
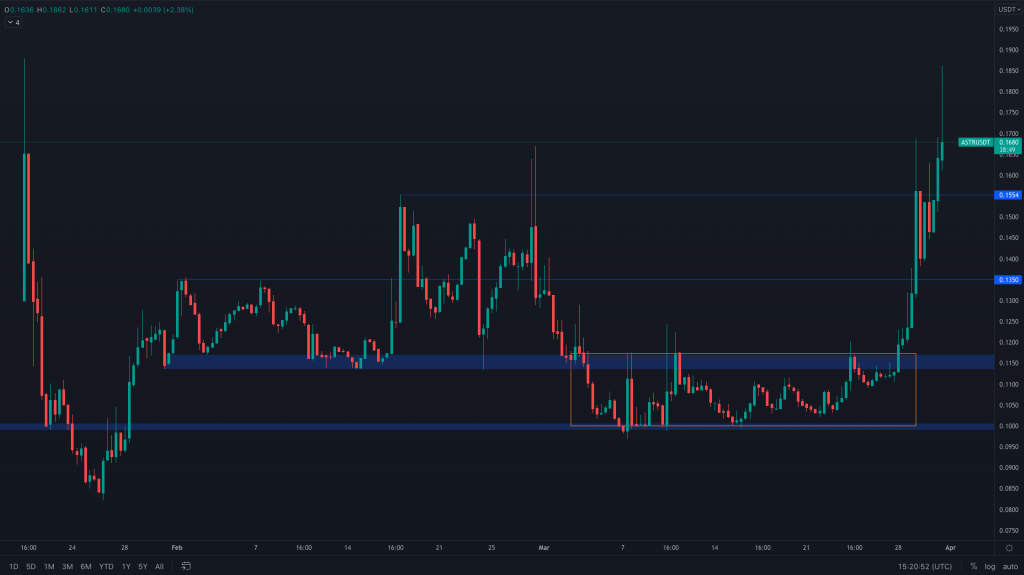
Like many other alts that we highlighted, ASTR had a bullish divergence on the RSI. It broke out of its sideways ranging and is now challenging the ATHs. Of course, to do that, it will likely need BTC on-side.
Recommended from Cryptonary


