Save 23% ($351) & Get a Free 1-1 Call with our Team ⏰ : 0d 2h 59m 43s

Disclaimer: Not financial nor investment advice. Any capital-related decisions you make are your entire responsibility and yours only.
Video Analysis
Market Indicies
Total Market Cap
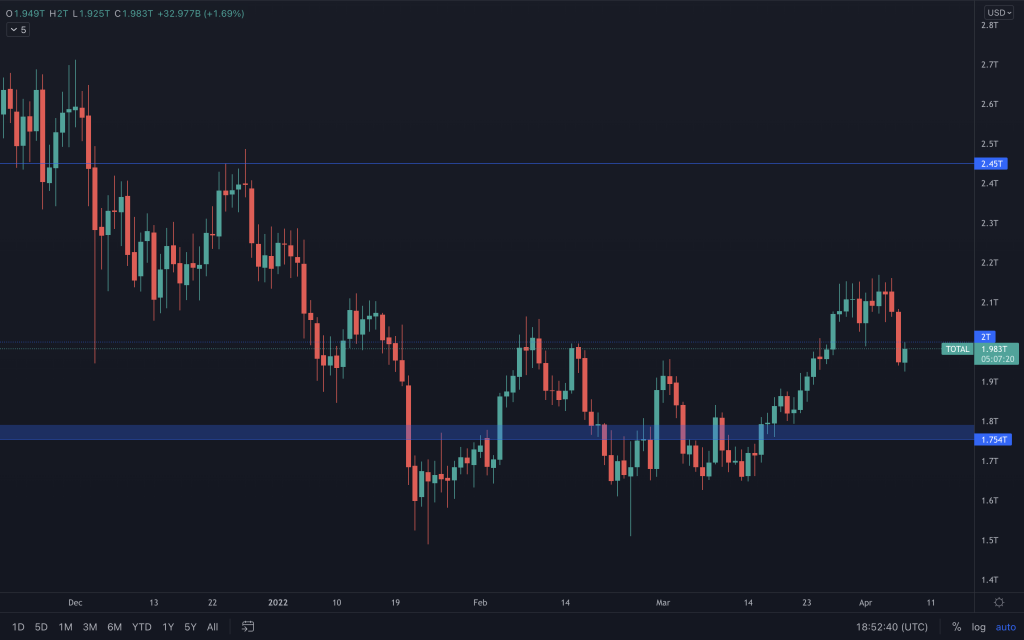
With the mention in daily technicals of BTC looking slightly bearish with the formation of a lower high, we'd obviously see the resulting downside move of Bitcoin reflected in the Total Market Cap. And we have, as the index has now moved sub $2T. With Bitcoin still able to fall further but maintain its daily bullish structure, this index could move towards, around $1,8T/$1.85T.
Altcoins Market Cap
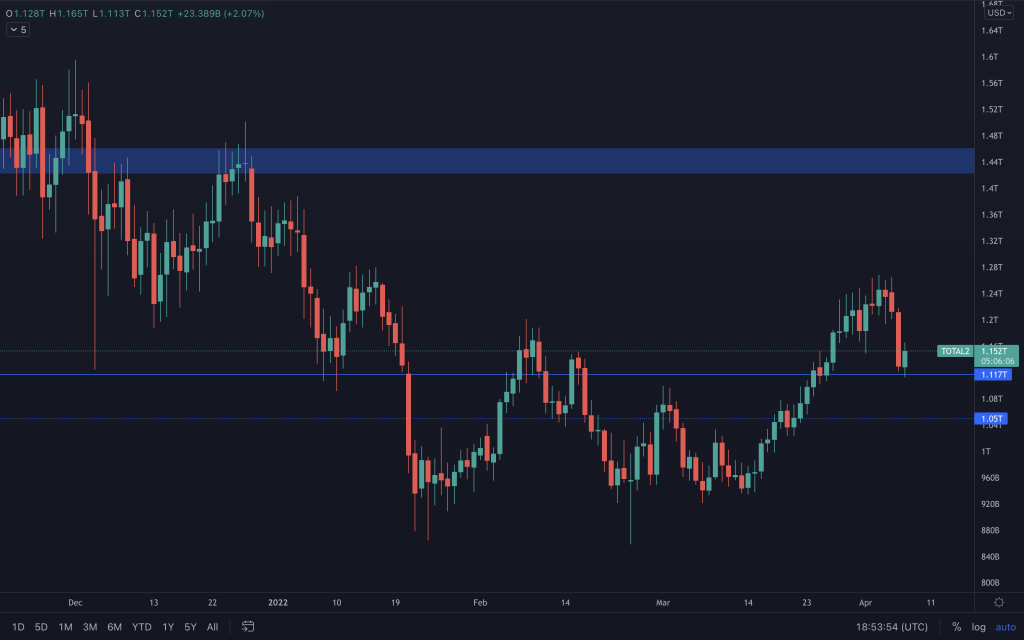
With the Total Market Cap's depreciation, the altcoins index moved straight to its support level at $1.117T. Yes, it is at support, but should the market dip further from here, $1.05T is the level we'd likely see it gravitate to.
Bitcoin
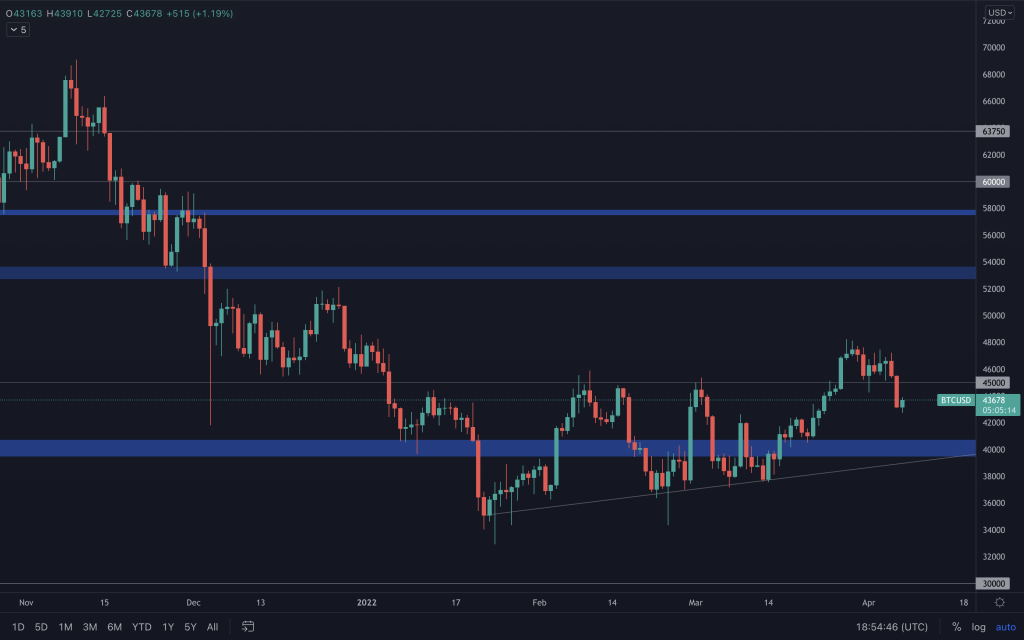
We mentioned that 8H lower high in our last daily technicals, and almost immediately after the daily closure, we saw the result as Bitcoin pushed below $45,000. With yesterday's candle also closing bearish and below $45,000, it does suggest that we may see a little more downside. Overall, that weekly bullish structure still stands, so we would continue to look for levels to long from.
Ether
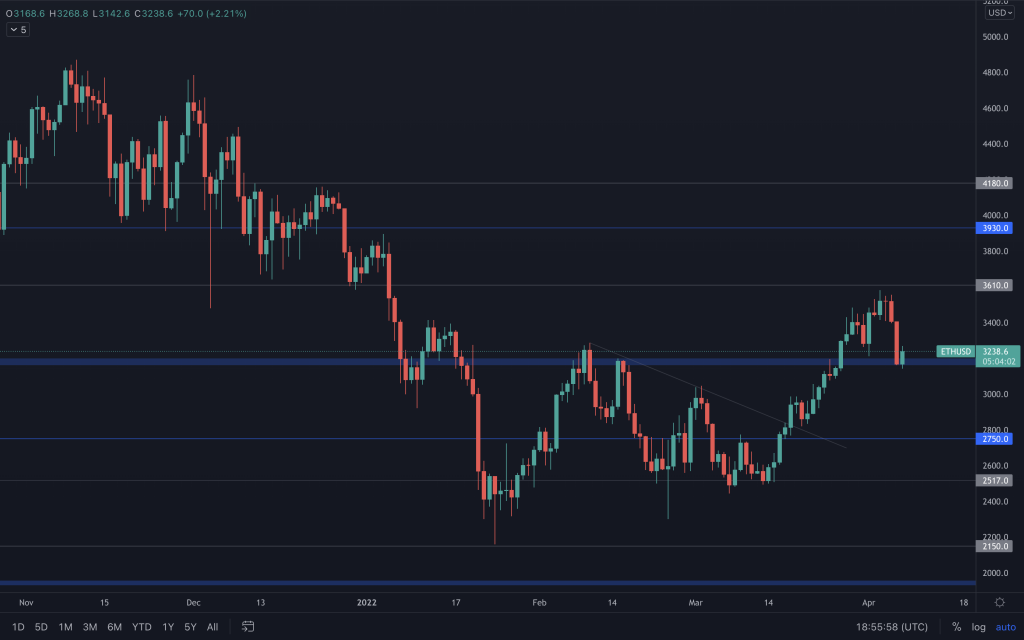
Ether now finds itself in the lower half of its range after seeing an increase in its sell volume to get there. Yesterday's candle closed bearish here too. With no wick being bought up, bears were fully in control. It is at a daily support level, and as we can see, it is finding support there. But without seeing a strong reaction and Bitcoin having room to fall, we could see ETH dipping further. Any dip would likely be towards the psychological $3,000 level. A price that we have often seen Ether bounce off in the past.
DOT
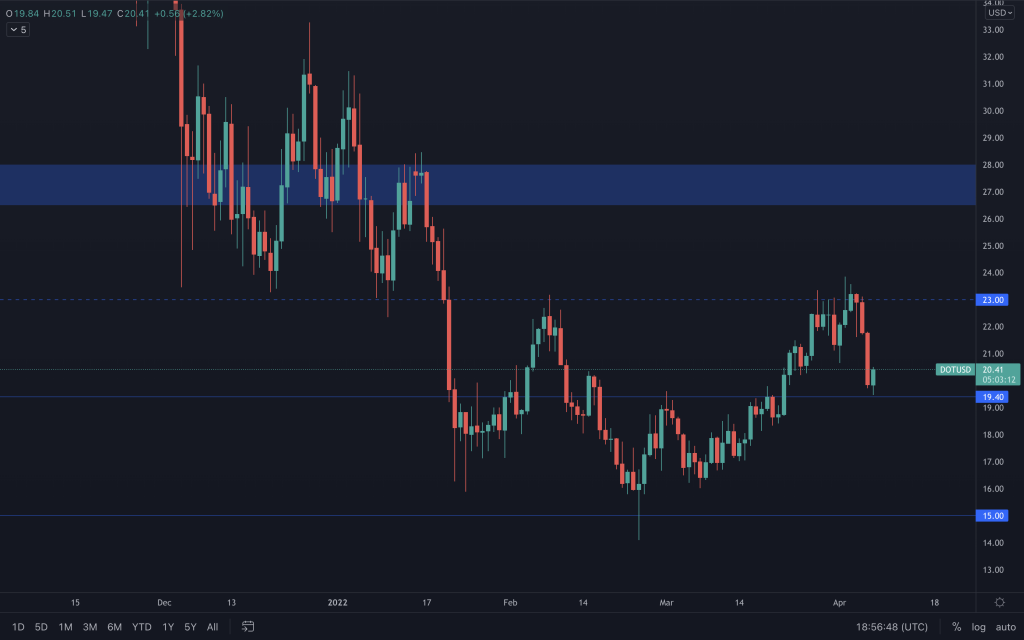
DOT is playing the range perfectly. Failure to get a convincing close above $23 has led it down to the $19.50 support, a level that we'd want to see it hold, certainly by weekly closes.
SNX
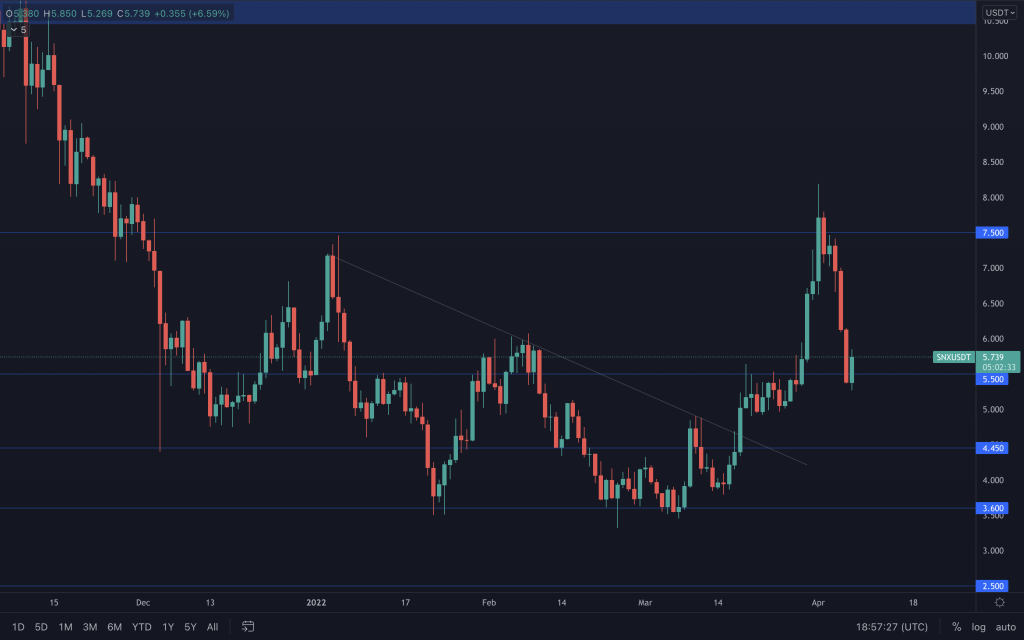
SNX has seen quite a decline in recent days, from highs over $8 to where it finds yesterday's candle closing, below $5.50. The joys of a volatile crypto market, hey! Once again, the volume to push the price down hasn't been excessive, and, as we mentioned a few days ago, SNX's price going to $5.50 doesn't alter the bullish market structure. Remember, the monthly candle was also a bullish engulfing.
RUNE
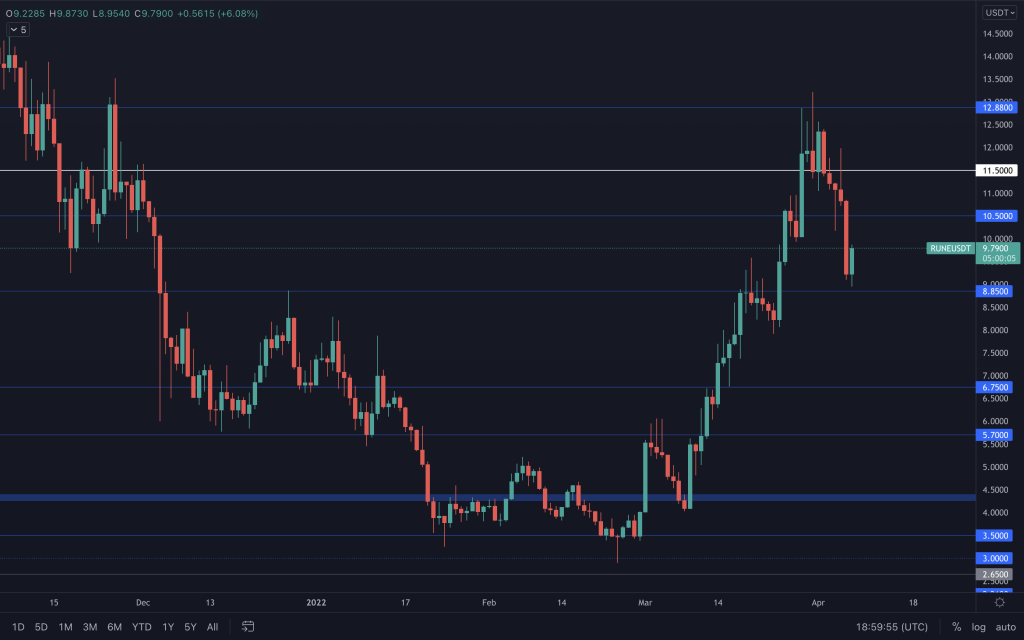
As we'd mentioned for RUNE in our last daily technicals, its 8H chart created lower highs. With the break under $10.50, its price headed straight towards $8.85. You often see that when an asset runs 'hot' for a long period of time (in RUNE's case, five weeks) and the market dips, these assets tend to have a larger % pullback from the highs. After all, they can afford to do this and still maintain a bullish structure. So, with that in mind, from a technical point of view, should the majors decline further, putting RUNE below $8.85, or RUNE's weekly close here, giving it a bearish engulfing candle on the weekly timeframe, that heightens the possibility of seeing it at $6.75. Of course, these are ifs and require observation of the chart as anything could happen in the meantime, especially with the fundamental news that has come out from THORChain affecting the price in recent weeks.
SOL
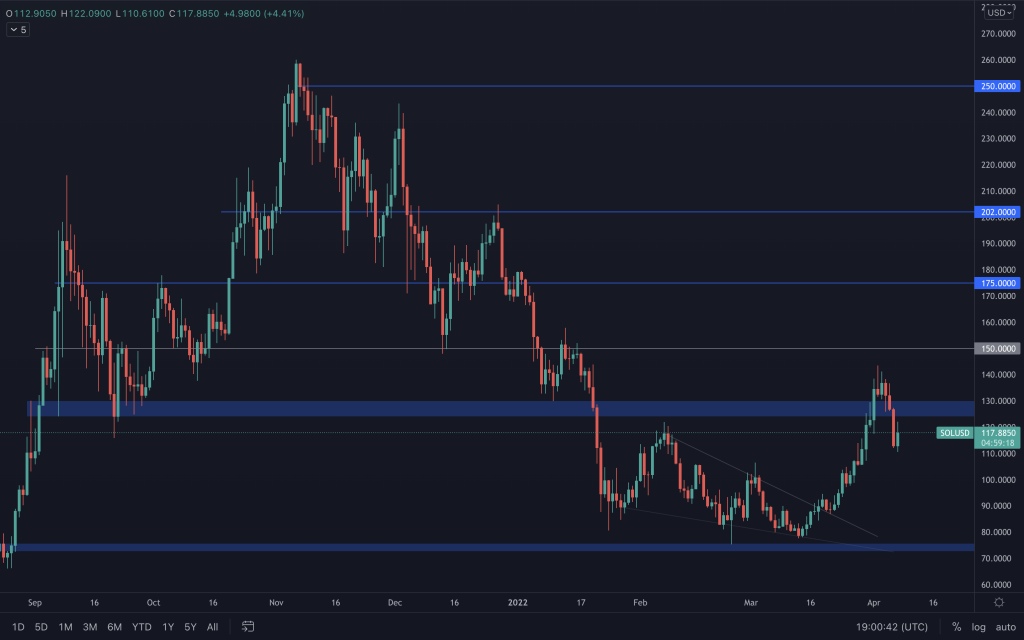
SOL failed to maintain its price above $130 and finds itself back in the old range of $75-$125. The plus is that it created a weekly higher high, so we're now on the lookout for the formation of a higher low. SOL, however, has failed to turn resistance into support, so, for the time being, we're expecting to see ETH outperform SOL.
SRM
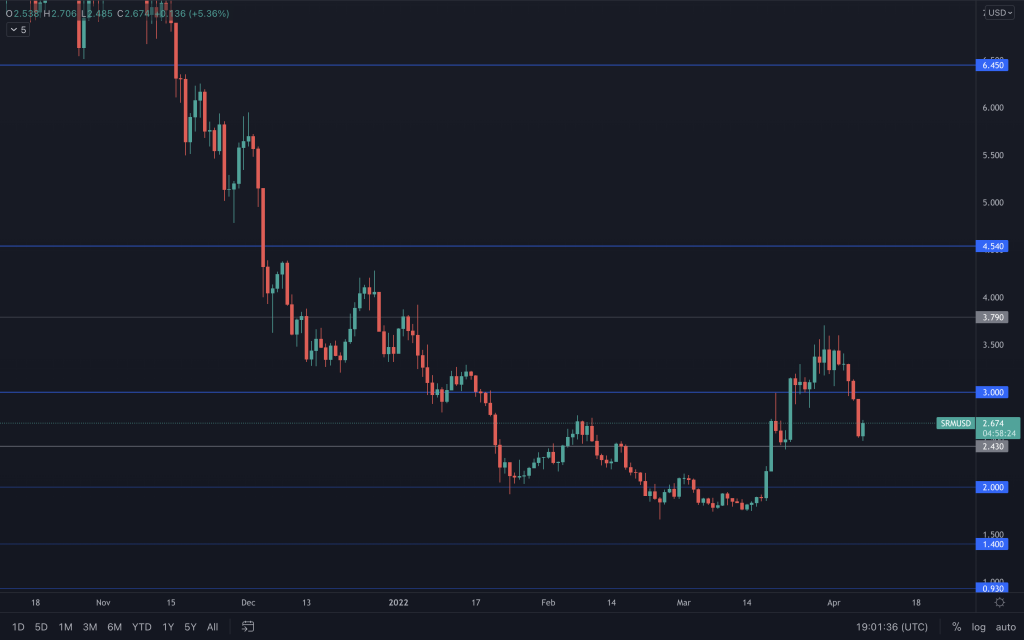
The last three weeks have seen a low to high return on SRM's price of over 110%. It's now down near a level that we look for it to maintain as support for bullish continuation, a level where it has found liquidity in the past. That level is $2.43. There's a visible decrease in volume as the price has decreased, suggesting dwindling sell pressure. With it being an important level, we're looking for buyers to begin to step in, but that may need the majors to show a little strength first.
FTT
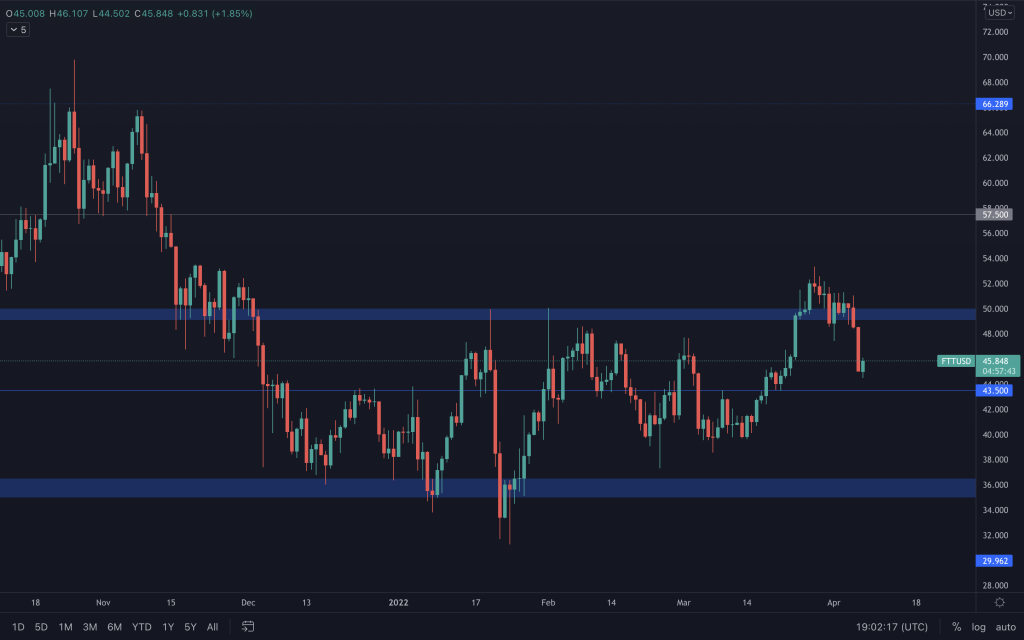
FTT is playing out pretty much as we'd mentioned, after making a lower low and closing below $50. The loss of $50 has taken it straight towards the middle of the range, and we're looking for this level to be respected. Any loss of it by a daily close would risk bringing $35 into play, which then risks breaking the bullish structure.
MINA
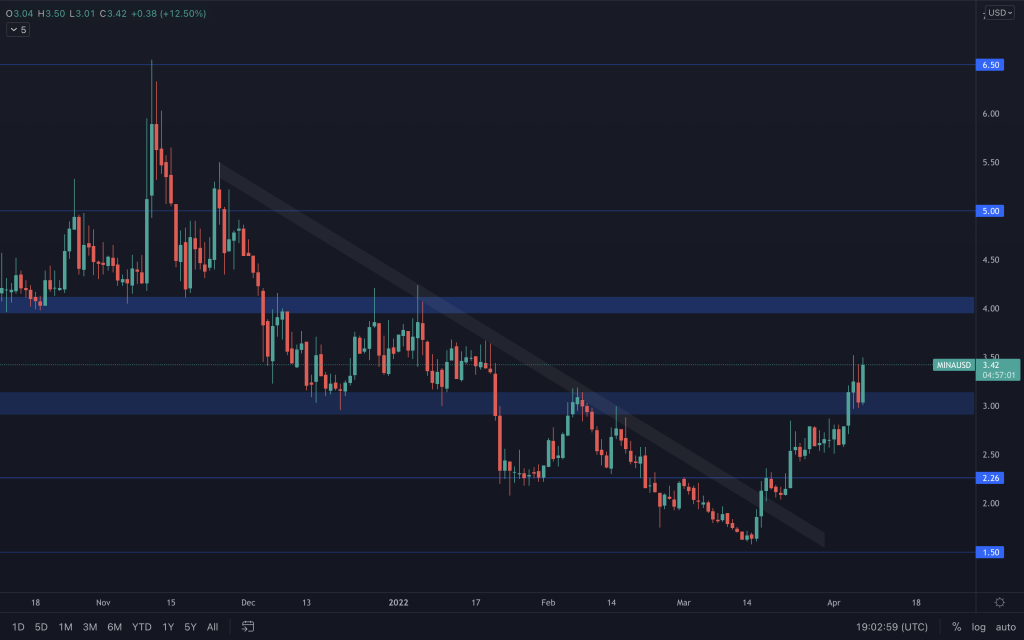
A solid performance by MINA, holding its price well through Bitcoin's dip and creating a weekly higher high. Its ETH chart is at a key resistance level, which has slowed its positive performance. If it can turn that level into support, we'd likely see MINA perform well.
dYdX
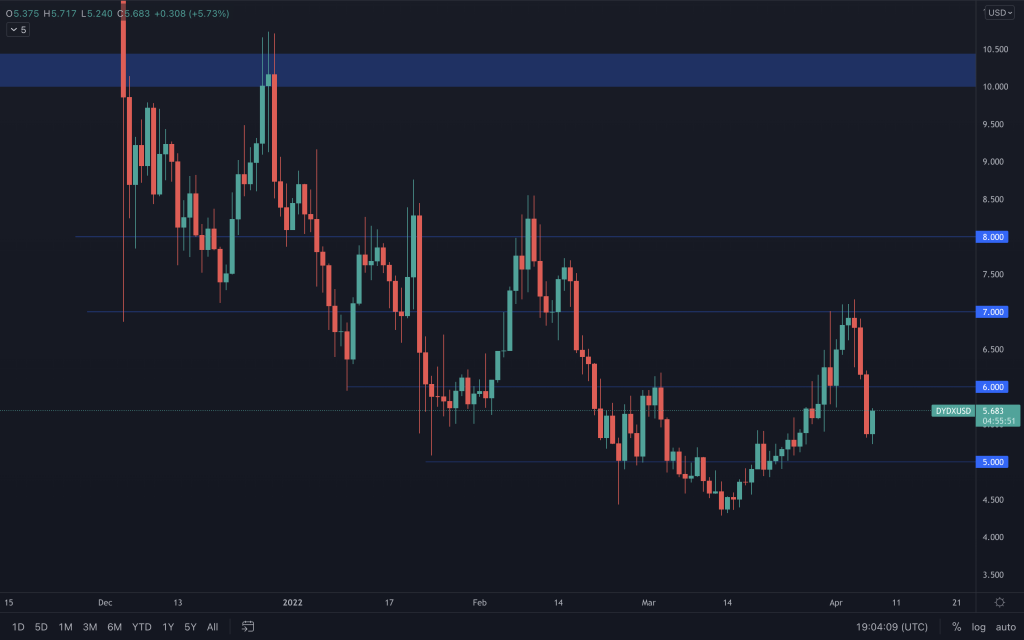
After a move all the way from $4.30 to $7, dYdX has dipped along with the market. It has a tough challenge as the weekly timeframe is still heavily bearish. Only the bullish divergence on the RSI hinted toward a turnaround in price. It needs to keep $5 as support, as that is the line in the sand, keeping it from further downside price discovery.
Recommended from Cryptonary


