Save 23% ($351) & Get a Free 1-1 Call with our Team ⏰ : 0d 2h 59m 44s

Disclaimer: Not financial nor investment advice. Any capital-related decisions you make are your entire responsibility and yours only.
Video Analysis
Total Market Cap

It's been another week of negative returns for much of crypto, with the daily average of this index being -4.5%. There are no apparent signs of an immediate bounce displayed in this chart. Still, the formation of a dragonfly doji may indicate a reversal - the subsequent candle closure tends to confirm it. Therefore, it has the chance to translate into relief for the market short term, at least. It's worth mentioning that 'V-shaped recoveries resulting from market moves such as this are rare. So the chances are that once the market eventually finds a bottom, price recovery would be somewhat slower, with Bitcoin leading the market first. Given the current economic climate, we lean towards that being the most likely outcome.
Altcoins Market Cap
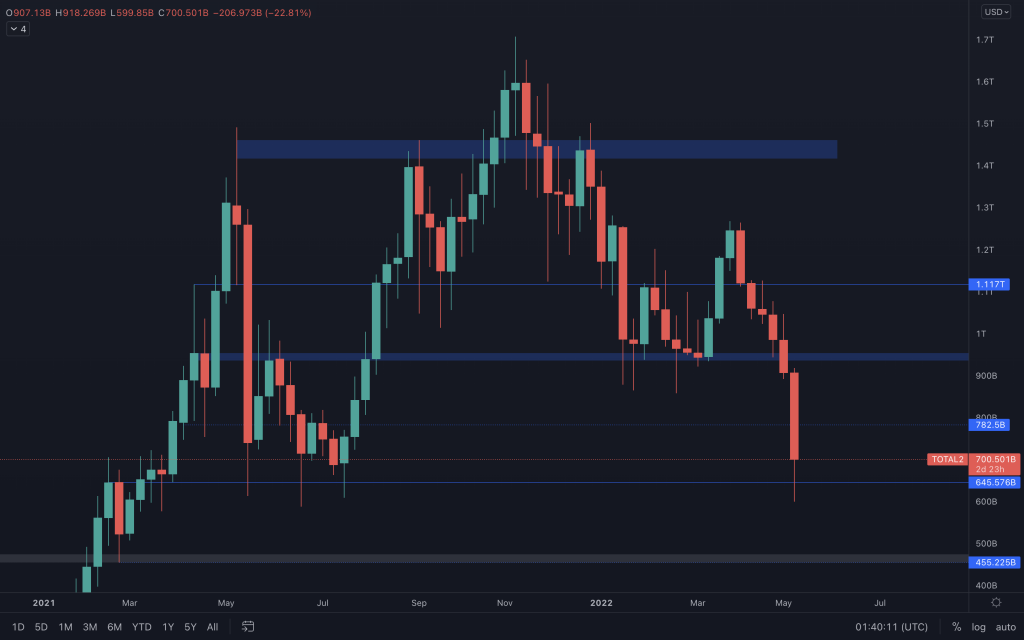
Very similar to the above chart for analysis. The altcoins market cap has retested its support level ($645B), where we can see that it has previously spiked on several occasions. A failure to maintain $645B as support and the altcoins market cap has $455B below, which would certainly be achievable if the total market cap reached around $1T.
Bitcoin
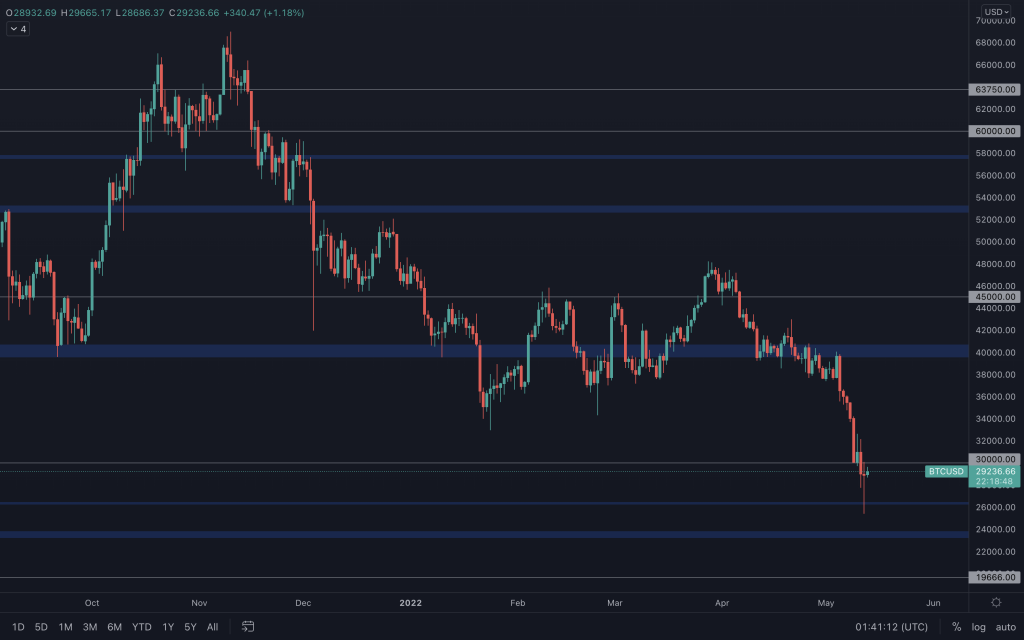
We've seen Bitcoin move down to the $26,500 support we have drawn and moved back to the top of the range. As low as the 4H timeframe, Bitcoin's charts continue to look bearish after having rejected $30,000. With the price still relatively close to resistance, it doesn't mean that it can't change though. We'd need to see the price reclaim $30,000, more so on the weekly timeframe, to indicate any chance of at least having a dead-cat bounce.
Ether
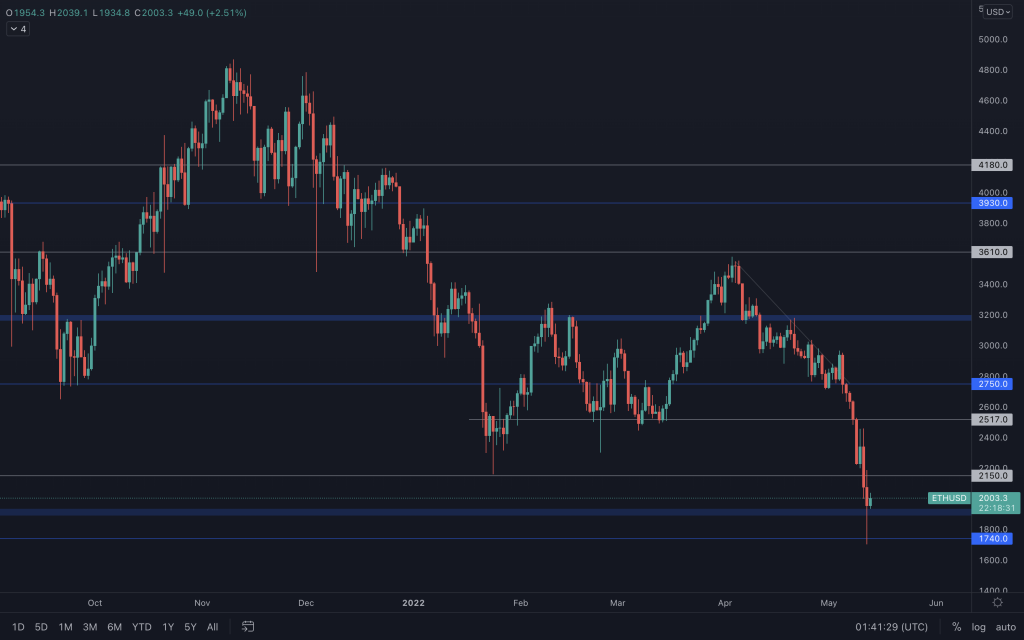
$1,740 has to hold on ETH, or $1,350 is possible. With ETH pulling back since tapping $1,740 and provided BTC's volatility lessens, there is a chance of seeing a bounce here. ETHBTC is also at its trendline support, meaning that any appreciation in Bitcoin's price now should see ETH outperform it.
ETH/BTC

DOT
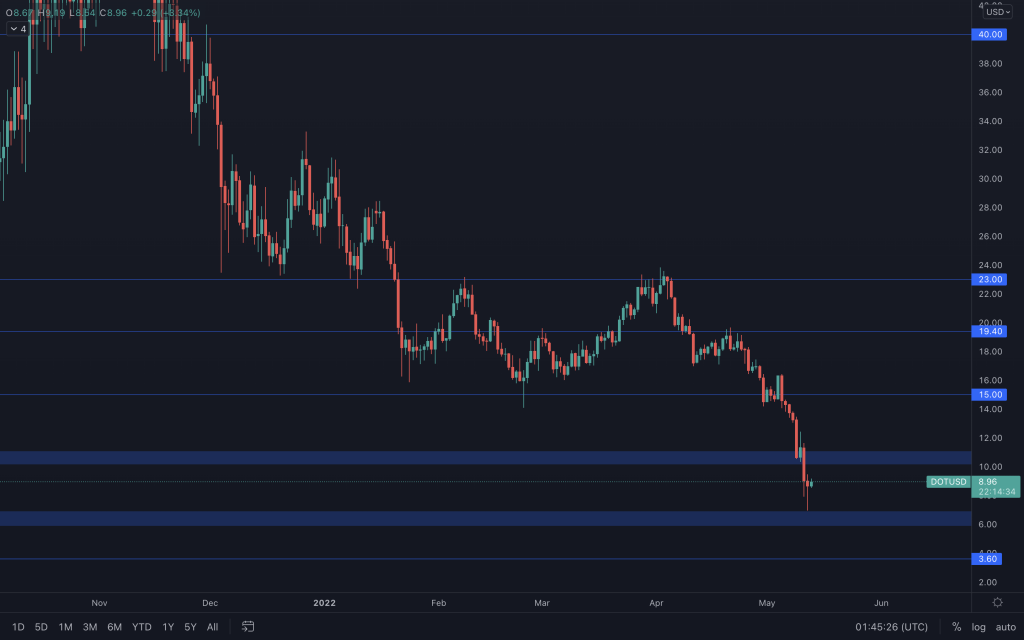
DOT's reacted after testing the top of the support range below. At the moment, there's nothing to suggest that it'll continue its move up. So, with the bearish M.S intact on all timeframes, it would need to close above $11. The lower timeframes show a declining volume as its price has moved up, which is not indicative of a bullish move.
SNX
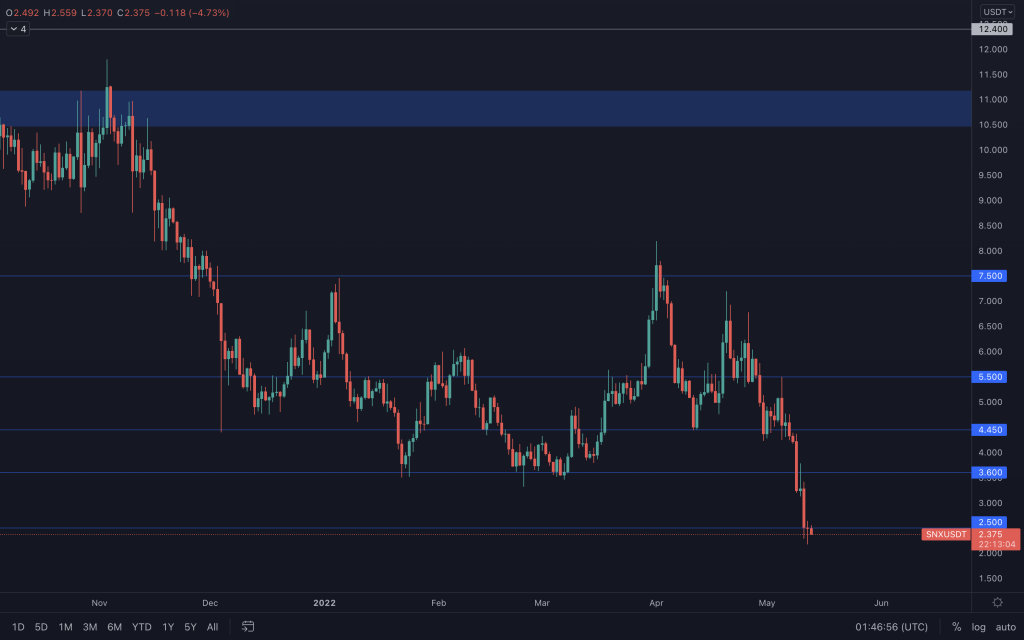
SNX is still sitting around its all-time lows, and although it hasn't moved much today, it needs to get a close above $2.50 soon. SNX/BTC and SNX/ETH are currently sitting above their respective supports, so there is a chance for SNX to appreciate and outperform the majors, providing they hold up.
RUNE
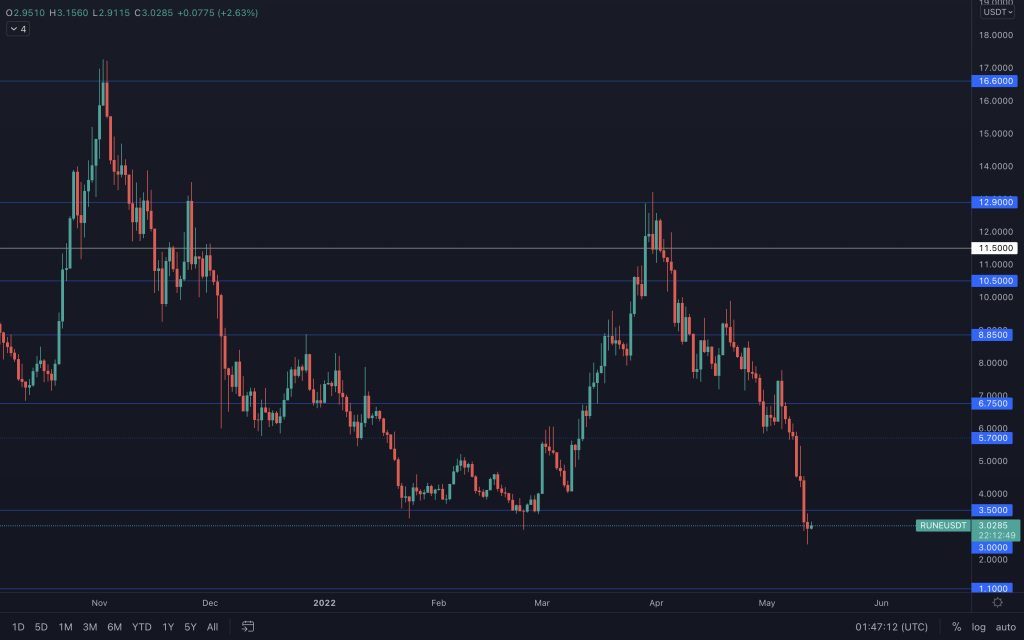
RUNE is also in danger of more downside, and the next support for RUNE comes in at $1.10. The bullish argument for RUNE (only if the majors perform well) is that it is in a similar position to SNX. It's very close to its support on RUNE/BTC and RUNE/ETH. But we'd need to see RUNE reclaim $3.50 to invalidate further downside.
SOL
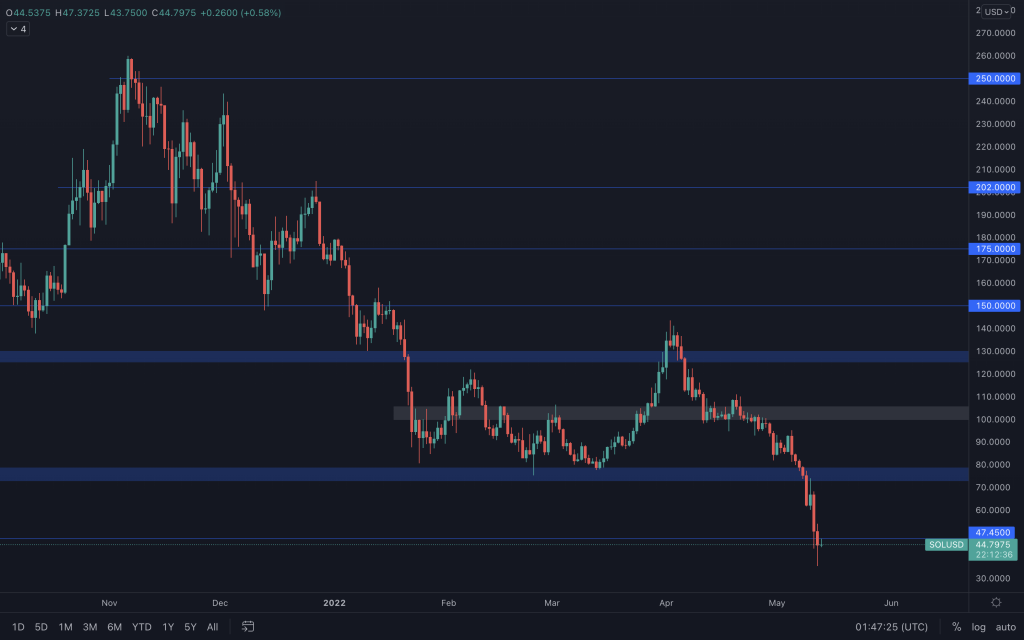
Another asset that is in a similar situation to the preceding two. SOL being below $47 doesn't look good, and the doors to $21 are open. However, Bitcoin does have a sizeable wick to the downside on its daily candle. This is the first time in this move down from $48,000 that Bitcoin has seen some demand. Of course, it is conditional on BTC performing well from here (lower timeframes may be needed to monitor this). If it does, then there's no reason these shouldn't outperform it.
SRM
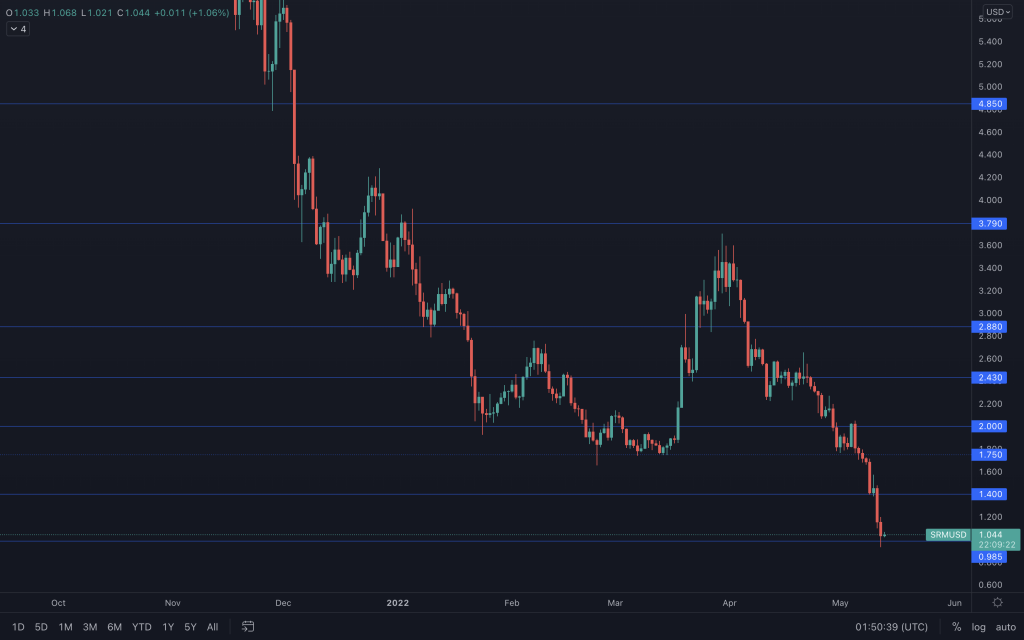
SRM has struggled to perform well in a downward market since making its highs around $14. Right now, it's standing its ground at the $1 final support. There's no support offered on the ETH pairing, but the BTC one also has a final support level, putting it in a similar situation to those above. As with the above, it is conditional on Bitcoin at least seeing a bounce and reclaiming $30,000. Otherwise, the downside would simply continue.
FTT
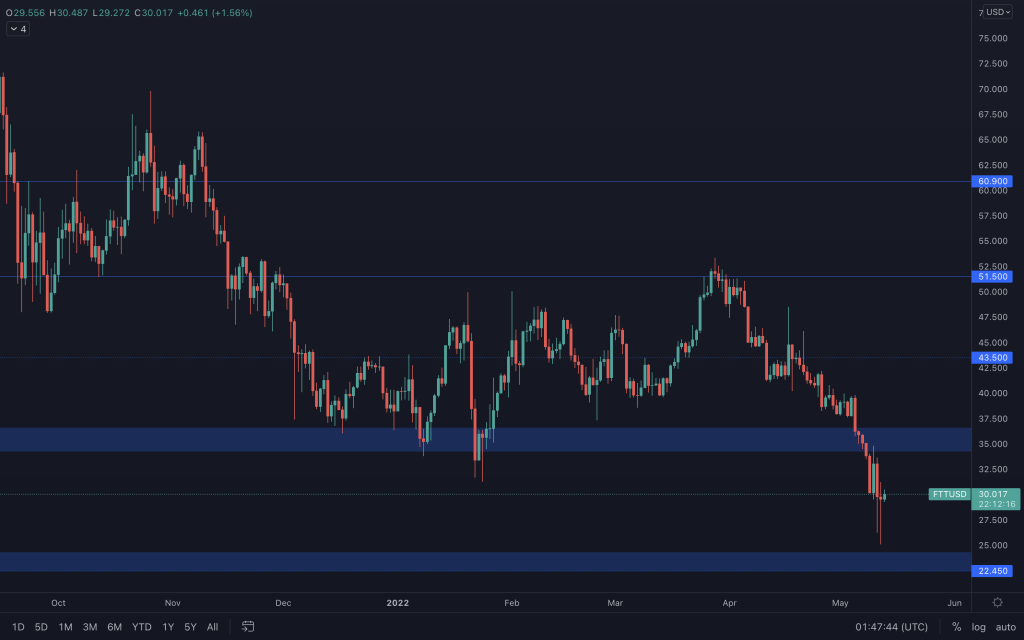
FTT hasn't quite tested support but finds itself mid-range ($22.50 - $35). There is a bullish divergence on the RSI (8H chart) and an increase in volume, which indicates a potential bounce to the top of the range.
MINA
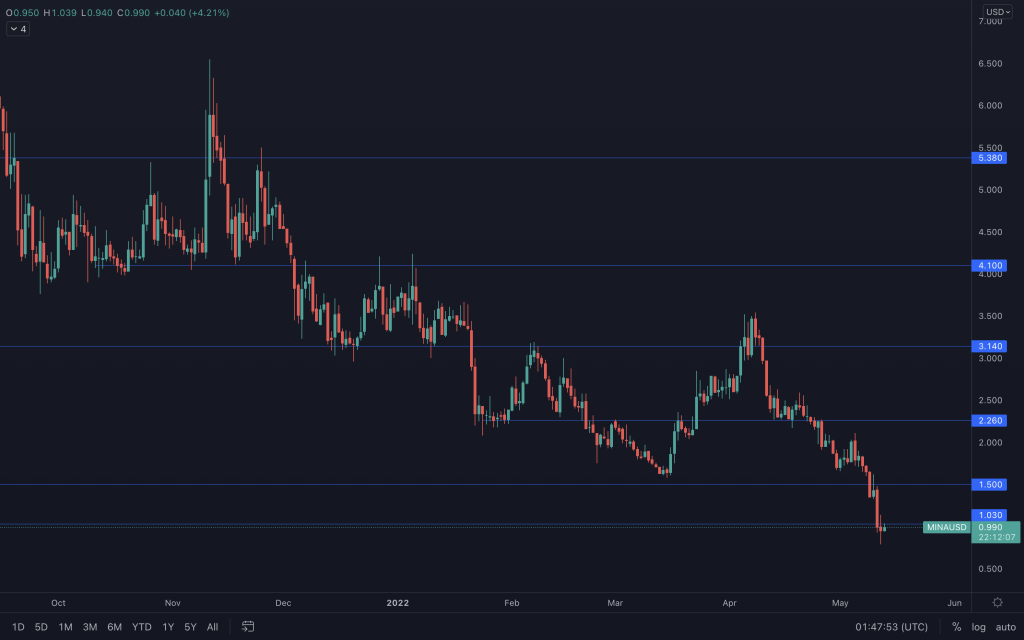
As MINA moved into new lows, the volume has significantly increased over the last two days. It hasn't yet managed to reclaim $1.03, but we'd want to see that happen first with no predetermined support below.
dYdX
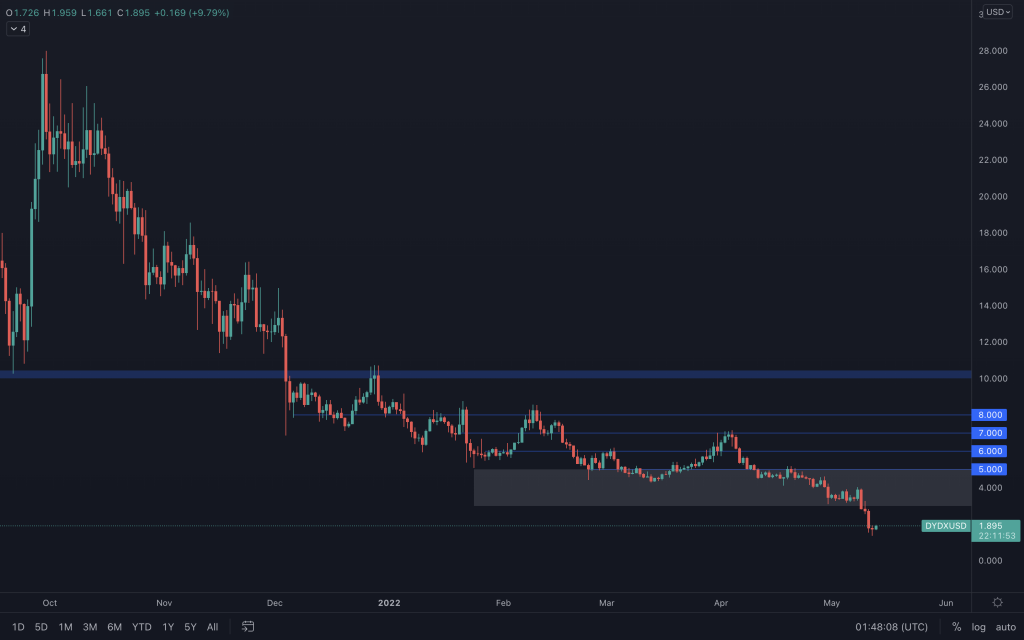
dYdX in its current structure remains bearish. Nothing here signals a change in direction yet. Increasing volume has pushed the price down, not what you want to see. Again, Bitcoin will likely lead dYdX as it has no major pairing support due to it being in downside price discovery on all charts.
Recommended from Cryptonary


