Save 23% ($351) & Get a Free 1-1 Call with our Team ⏰ : 0d 2h 59m 44s
Disclaimer: Not financial nor investment advice. Any capital-related decisions you make are your entire responsibility and yours only.
Video Analysis
Market Sentiment
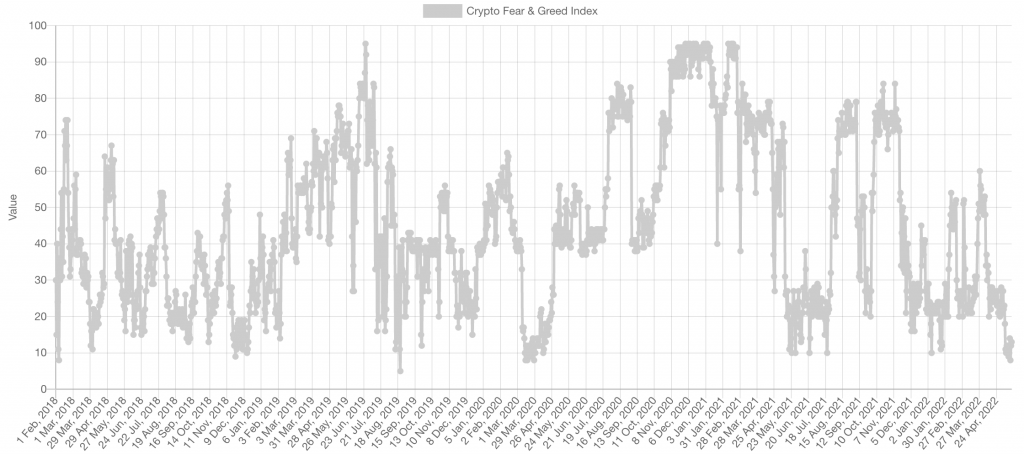
The Fear & Greed index is near the extremes, reaching as low as 8 two days ago. If we cross-check short-lived visits of the lows to Bitcoin's price action, this index becomes unreliable. This is what we have right now. However, when we compare the index hitting the lows for a sustained period of time, we often see that Bitcoin has formed a low. The result has reliably been an appreciation in price. So this is something that we look out for, certainly as Bitcoin is near such a crucial level.
The times that we have seen this happen were:
- December 2018
- March-April 2020
- May - July 2021
Total Market Cap
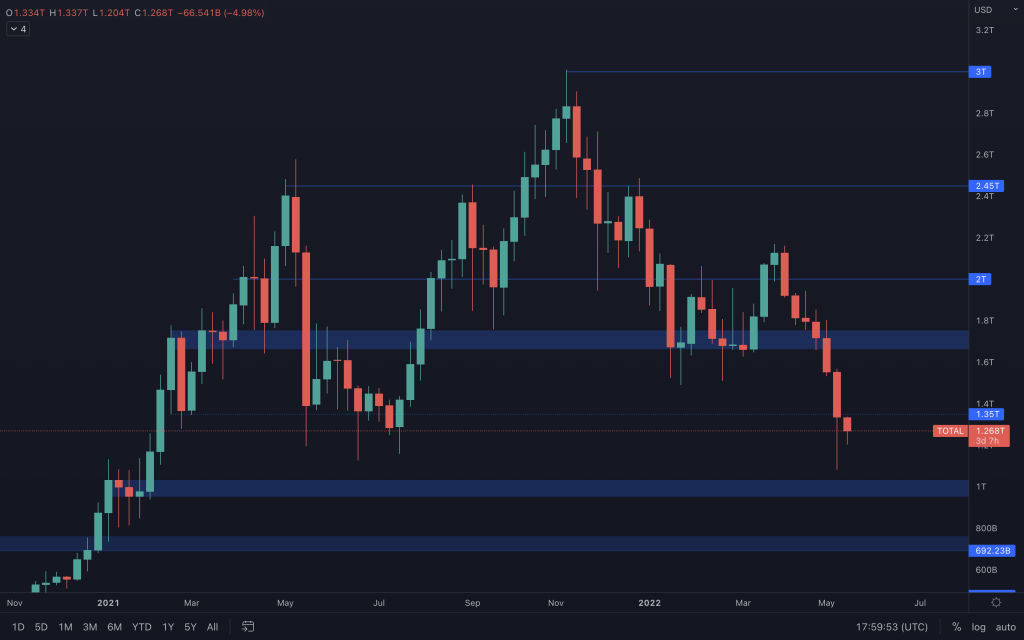 This week has seen the Total Market Cap index remaining below $1.35T. Unless the index can close above $1.35T in the weekly timeframe, we should be prepared to see the Total Market Cap head toward the technical and psychological level of $1T. After all, there has been nothing but downside since the $2.15T high back at the beginning of April, with even the daily timeframe unable to create anything that resembles a bullish structure.
Altcoins Market Cap
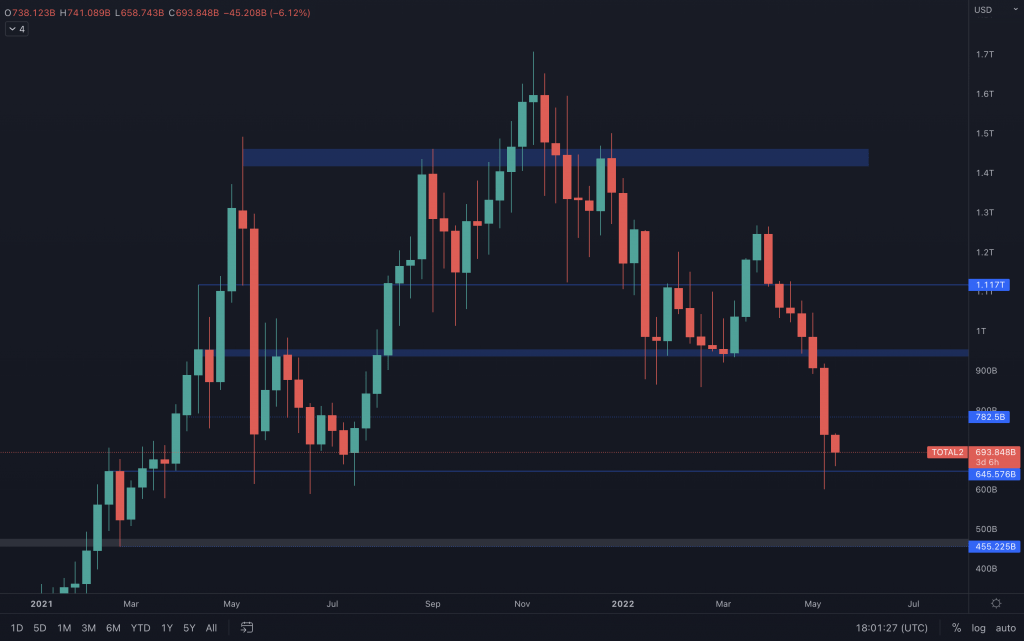
Since losing the $950B level, this index wasted no time heading straight for support at $645B, which has since moved sideways. Any loss of $645B should see the Altcoins Market Cap down at $455B, which is the old 2018 high— on the other hand, closing a weekly candle above $782.5B should see further relief for the index into $950B.
Bitcoin
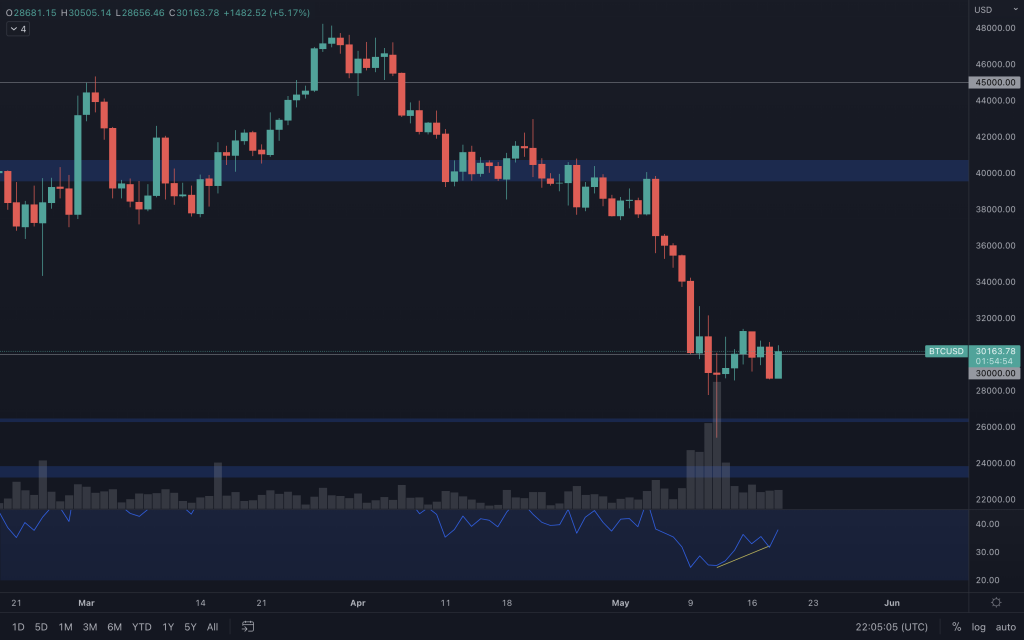
After making a lower low, around $25,000, BTC saw a demand that pushed its price back above $30,000 for last week's candle closure. We have yet to see a weekly closure below $30,000, but that is certainly something to watch out for as it puts $20,000 as the next established support. For now, BTC's price continues to chop around $30,000, with trading volume remaining relatively flat. Daily RSI shows signs of a potential bullish divergence, so it's worth seeing if that translates over into price action.
Ether
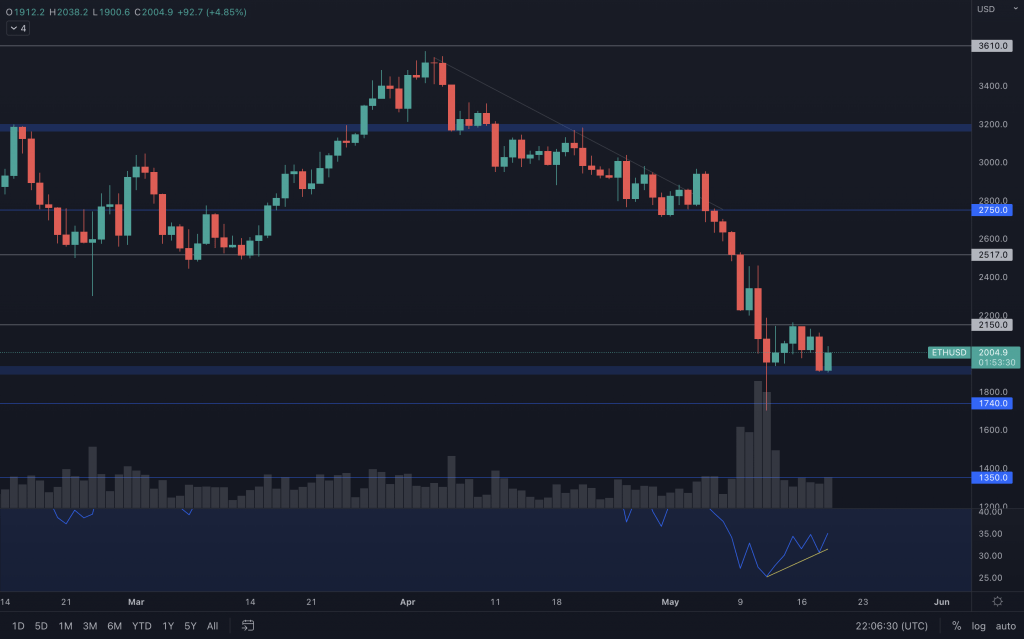
Ether's also moving sideways in a tight range between $1900 and $2,150. Again, RSI is showing potential bullish divergence, but volume remains unimpressive, reflecting the indecision in the market. A daily closure above $2,150 will have Ether challenging $2,500. $1,740 is the most crucial level to hold for supports below, as ETH stands to lose 25% if it closes below that.
ETH/BTC
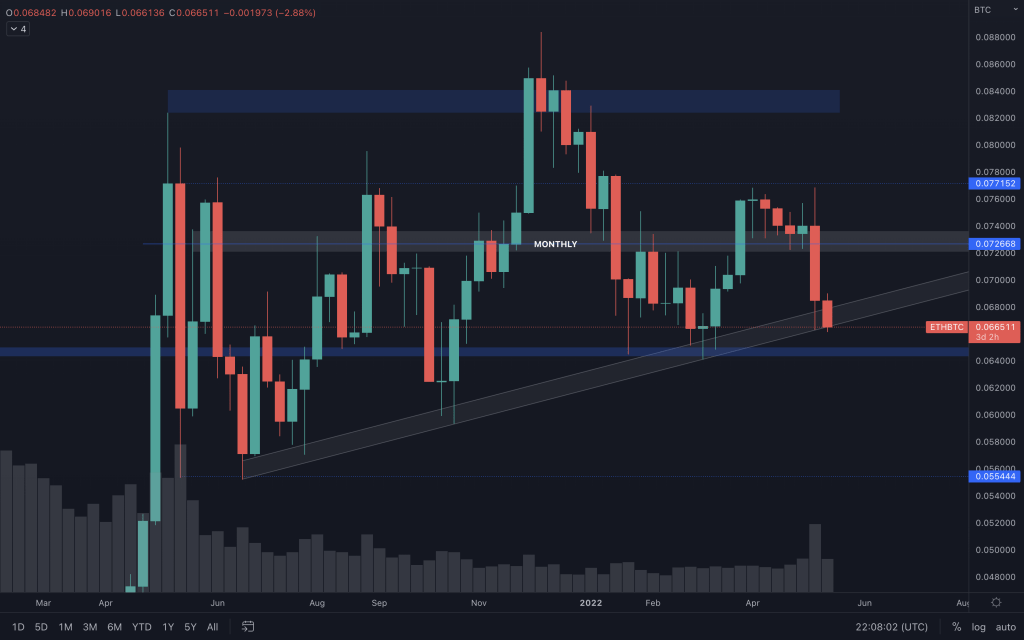
ETHBTC is still holding onto the supporting channel trendline, just. But as we mentioned a couple of days ago in our daily analysis, we wouldn't be surprised to see this over-extend to the horizontal support. Only a loss of that level would change the medium-term outlook to Bitcoin outperforming Ether.
DOT
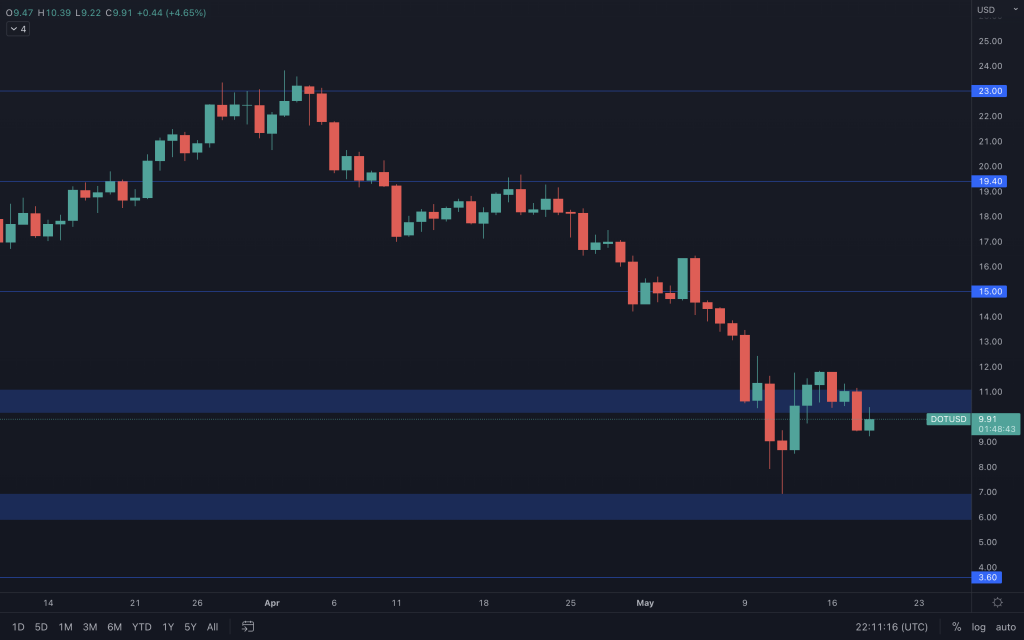
DOT's daily candles need to reclaim $11, certainly for the weekly close, or $6 will be up once again. Yesterday's bearish engulfing through support suggests that $6 is the more likely route, but, as we know, the market is indecisive due to BTC chopping around $30,000.
SNX

Another asset that has bullish divergence on the RSI and is right at a major support. Longing here, as on the other assets, comes with an increased risk of failure as the chart structure is bearish (favouring shorts from resistance), volume isn't supportive of any move up on the lower timeframes, and there is no chart pattern/candles to trade yet. With that said, it is a higher time frame support level - albeit the final support level. If the risk is managed well, the R:R is favourable, and a daily closure below $2.50 is invalidation. The danger is with SNX losing $2.50, as it would enter price discovery to the downside.
RUNE
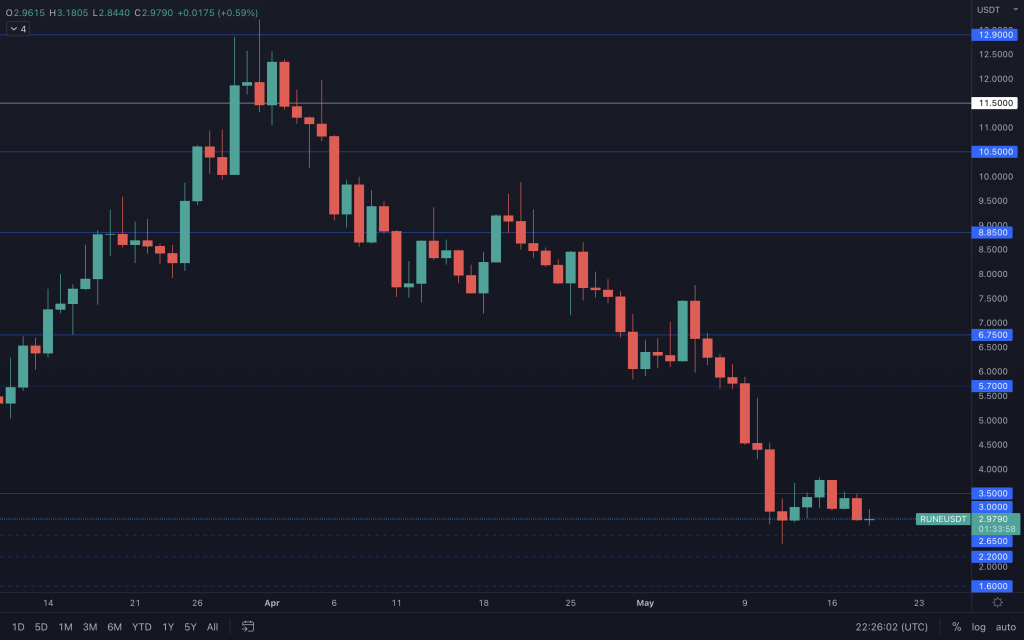
From a daily perspective, RUNE has lost the $3 support once again, but this time with a bearish engulfing candle. It certainly has its work cut out for achieving a decent weekly close. The one thing on RUNE's side is that BTC's price action is choppy, which has seen RUNE mimic it and recover lost support before. However, any negative move from BTC at this time will put pressure on RUNE as it has lost (USD) support by a daily closure. The RUNE/BTC chart is at a HTF support level, but if RUNE loses its support on the RUNE/BTC chart, it will add additional downside pressure on any of Bitcoin's bearish moves. We've now added RUNE's minor daily supports to the chart. But bear in mind that RUNE hasn't seen any prolonged price action at these levels, making them unreliable if price heads there. A weekly loss of $3 still makes $1 a possibility.
SOL
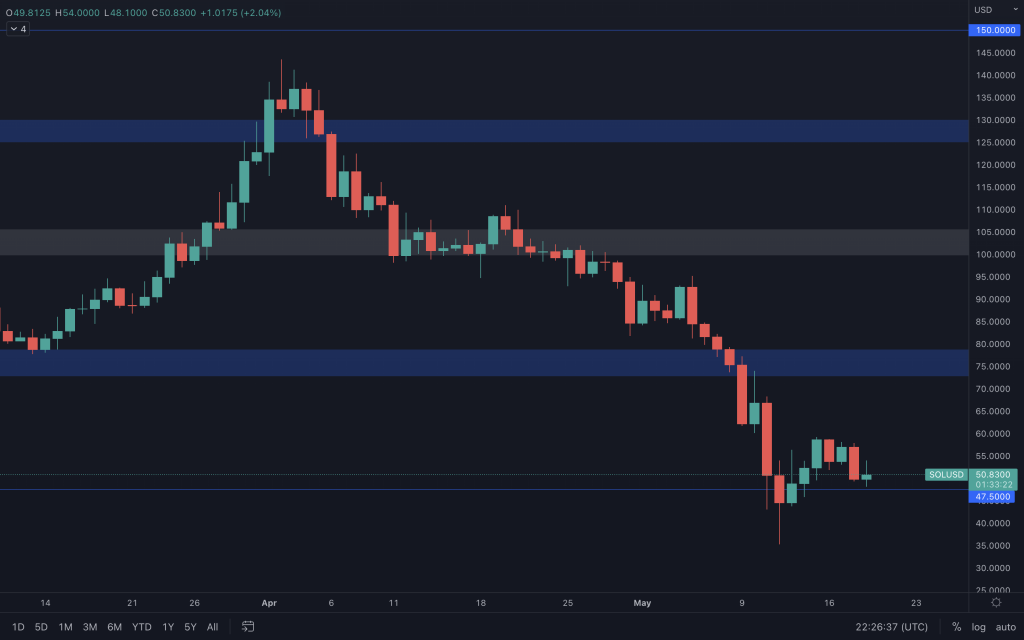
After a momentary loss of $47.50 on the 12th of May, SOL closed back above it the next day, where it is still trading. It's retested $47.50 as support, and, as long as it holds, a move towards $70 is possible. Invalidation is simply a closure below $47.50, and that brings $21 into play.
SRM
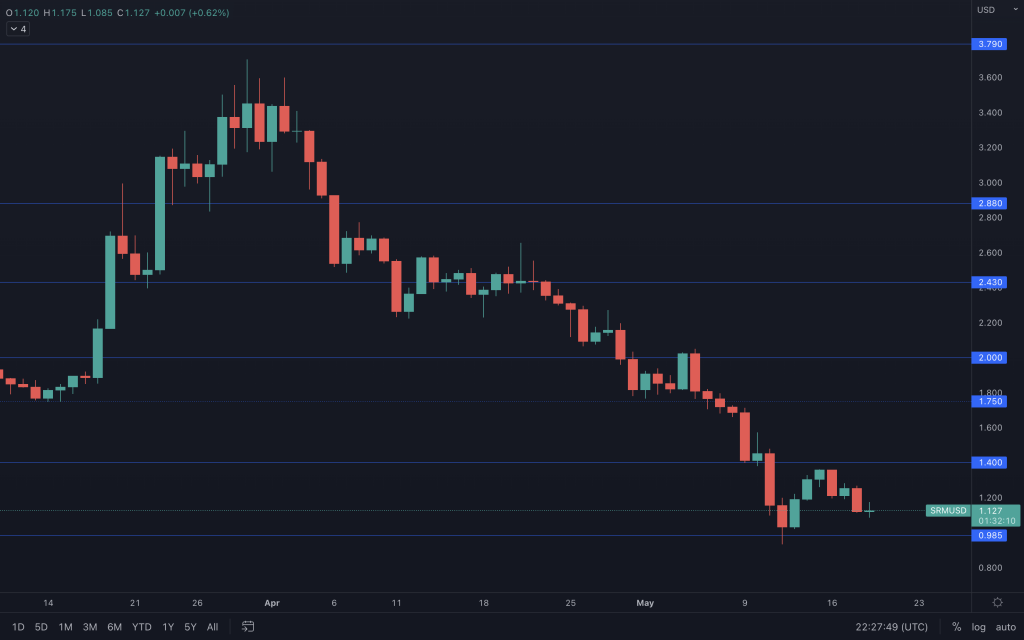
SRM moved, as expected, from range low to range high and now finds itself bang in the middle. It's pretty simple here, where we wait for a closure above $1.40 that should take SRM up to $1.75/$2, or it forms another low, loses $1, and continues down.
FTT
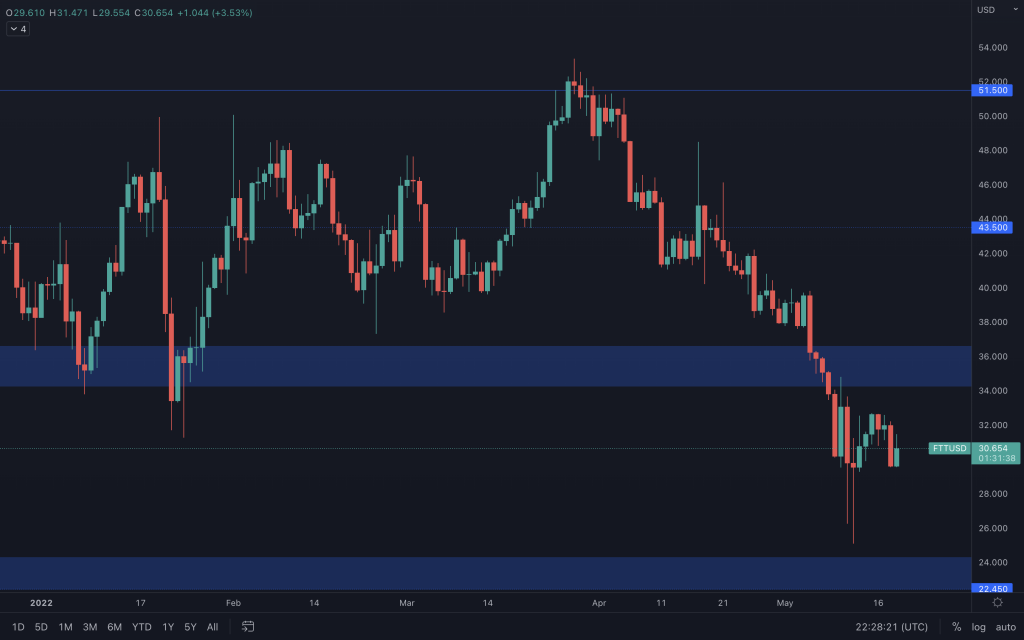
We're still waiting for a breakout of this range ($22.50-$36). Last week's candle shows a significant demand for FTT, but it still needs to translate into a close above $36 to suggest any further upside in FTT's price.
MINA
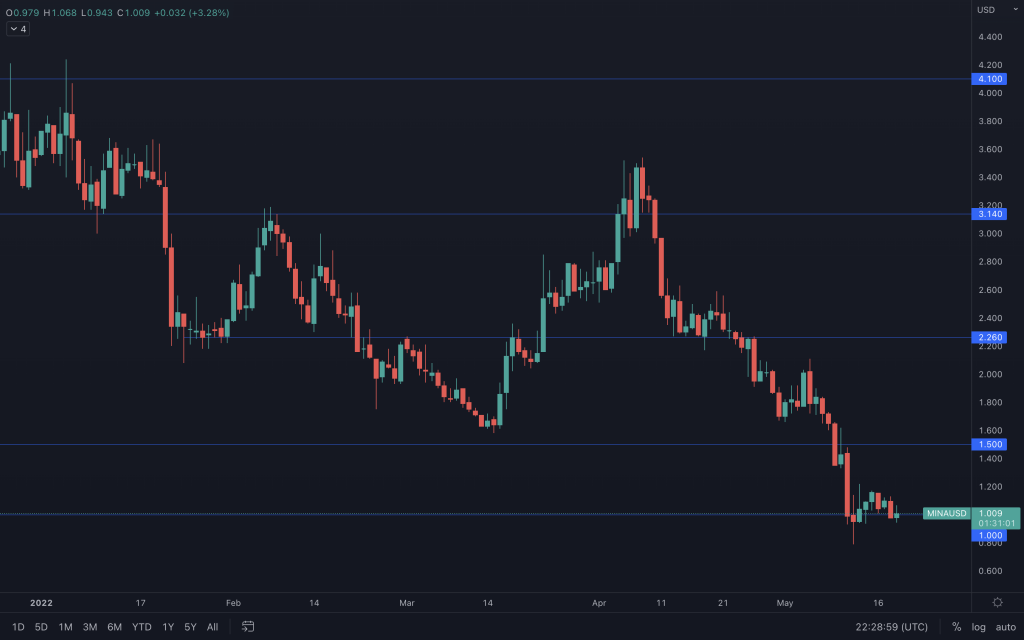
We're seeing more volume coming in on MINA as buyers and sellers battle it out around the $1 mark. Again, it's another asset at its 'final' support level, although this level is not as established as on other assets as MINA has only visited it briefly. Any positive change in the market's indecisive sentiment would make this an attractive buy.
dYdX
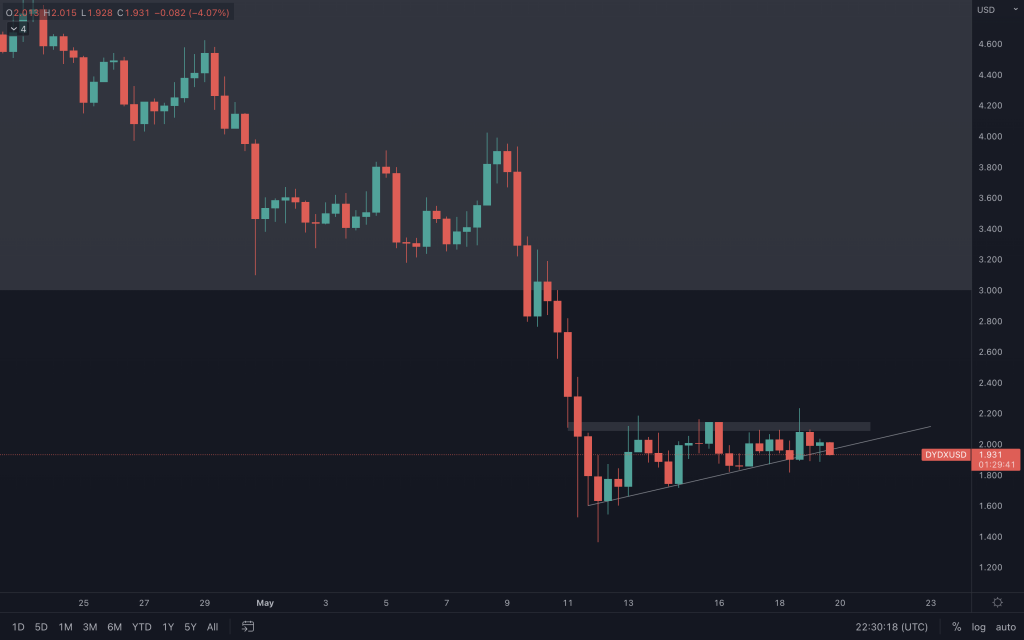
There's not been much price movement of late with dYdX, although we are watching out for a clear break from the ascending triangle.
THOR

Although THOR hasn't been on the market as long as the assets mentioned above, we can see that it, too, is testing its old accumulation range as support. There's nothing yet to indicate a change to the downside, as increasing volume pushes its price down, but we'll continue to watch its reaction around these levels.
SHDW
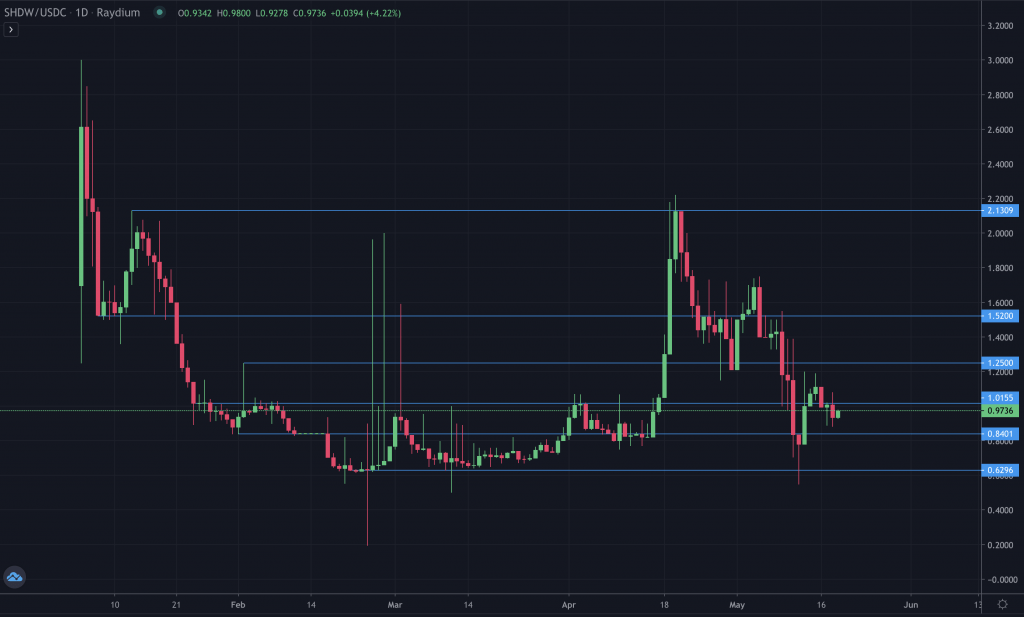
SHDW is another that has tested its higher timeframe support, and for SHDW, that was at around $0.60. From there, it saw a nice reaction by breaking back out of the old consolidation range ($0.6-$1). Even in doing that, we can see that the overall bearish market structure remains unaffected. So we look out for signs of continuation or change. SHDW is in with a chance of altering its daily market structure, but we'd need to see it go on to close above $1.20.
Final words: Many assets on this analysis are at/around a higher timeframe support level. Go to an asset on this list, click 'weekly' and zoom out. If the market were to see a relief rally, this would certainly be wheret we look to that happening. Does it have to happen? No. However, we still make sure to look out for (and highlight) potential/subtle changes when we spot them. A more conservative approach is to wait for confirmation first. Albeit by means of a daily market structure change/reclaim of support/indicators or whatever combination of analysis that you use. However, the one thing that you must get on point with trading is your risk management. Have your trades planned out beforehand. If you haven't traded before, try paper-trading (where you simply document a trade that interests you on paper). Note the entry price, stop loss, and TPs and learn to understand position sizing so that if a stop loss was hit, you don't lose more than, say, 1% of your funds. If you can't do that, your time trading will not be successful, and it will be very short-lived.
Recommended from Cryptonary


