Save 23% ($351) & Get a Free 1-1 Call with our Team ⏰ : 0d 2h 59m 43s

Disclaimer: Not financial nor investment advice. Any capital-related decisions you make are your entire responsibility and yours only.
Video Analysis
Market Sentiment
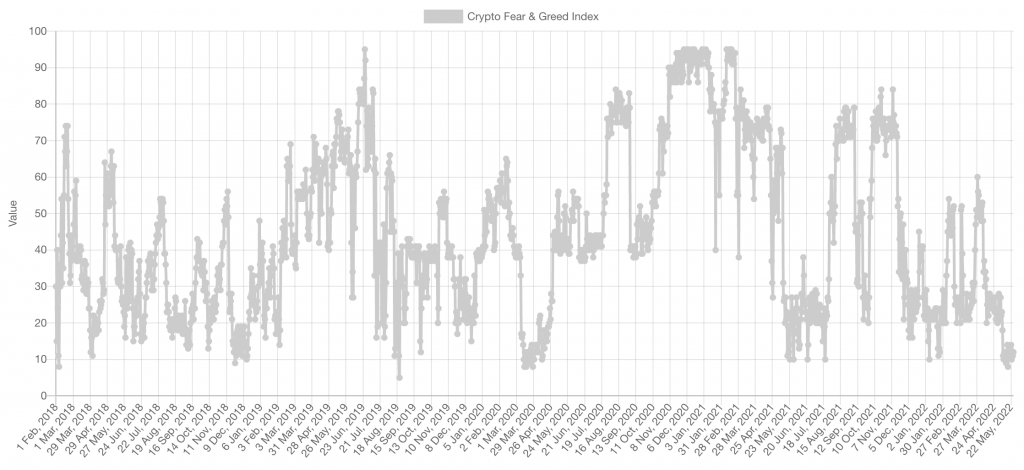
We've had just over two weeks where the Crypto Fear & Greed Index has failed to climb higher than 14. Historically, a bottom has been signified by a period of no less than three weeks at the extreme lows. We want to reinforce that this chart is a visual representation based on multiple factors, including volume, volatility, BTC.D, and even social media polls. It doesn't pinpoint a bottom or time the market, but it has historically been a reliable indicator, so it's worth using it as part of the analysis when it's at the extremes.
Total Market Cap
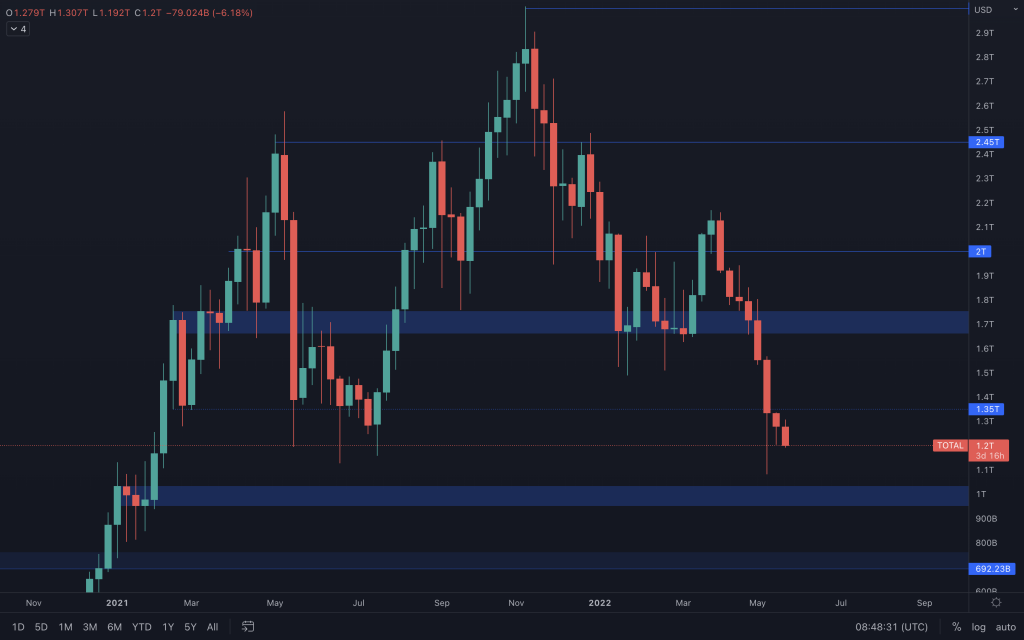
A week later, we're in the same situation, where the Total Market Cap has failed to make any advancement on $1.35T. Without any reclamation of $1.35T to invalidate downside, we should be prepared to see this index around $1T.
Altcoins Market Cap
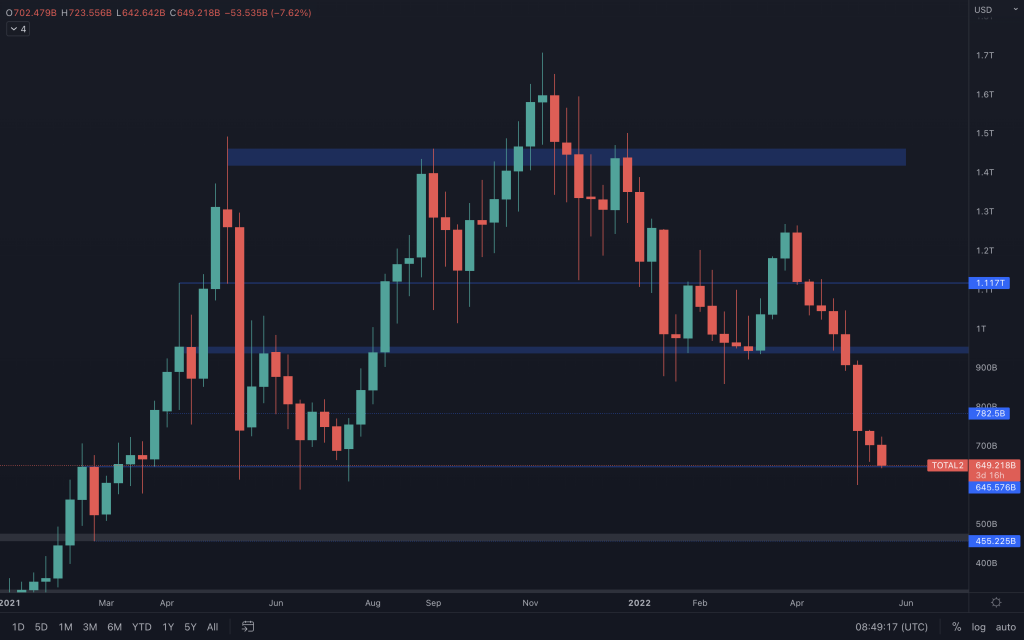
A similar situation is reflected in the Altcoins Market Cap, except it is hovering just above its $645B level. A move by the Total Market Cap to $1T would reflect negatively here, where we would expect to see this index heading towards $455B-$475B. On the flip side, reclaiming $782.5B should offer the market relief, if only for the short term.
Bitcoin
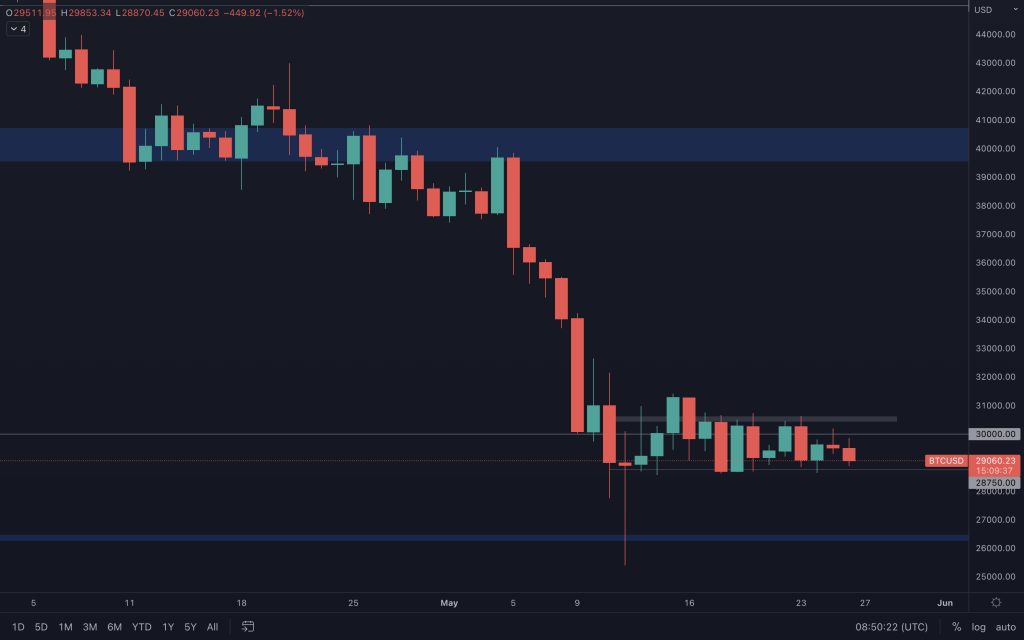
There have been no signs to indicate a change to the overall bearishness of the crypto market. However, Bitcoin has found itself trading in a small range ($28,750 - $30,500) for almost two weeks now. A breakout from this range should help to identify Bitcoin's next move.
Ether
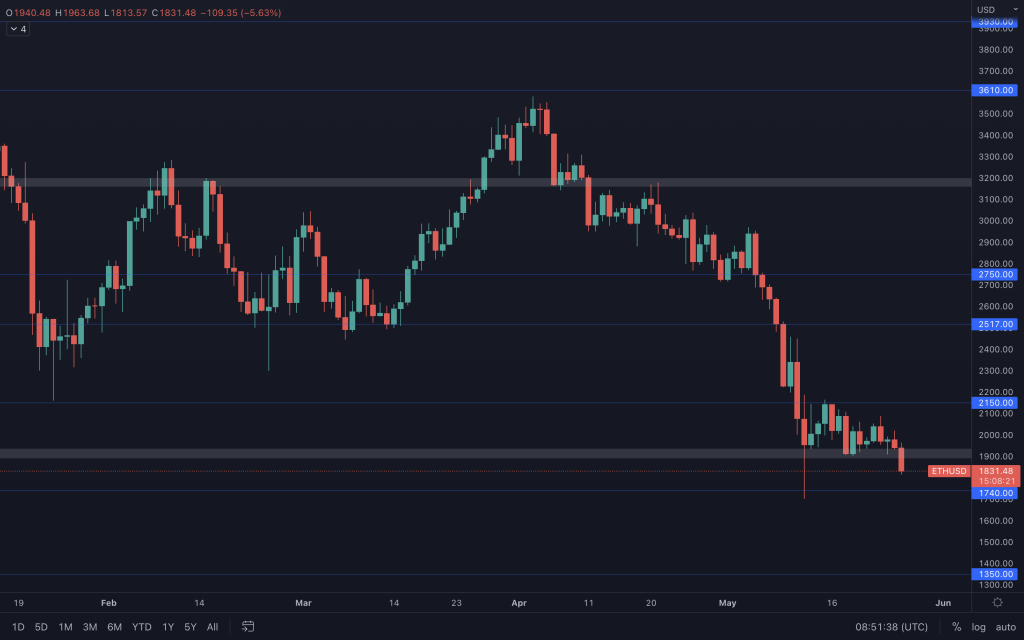
Ether has underperformed vs Bitcoin of late, which reflects in the ETH/BTC chart below. It's continued to close daily candles between $1,900 and $2,150. As we can see on the chart, Ether has continuously created lower highs as its price has failed to make any headway higher. Its intraday chart has now broken down through support, and a daily closure below $1,900 would solidify that and put Ether into a new range ($1,740-$1,900). $1,740 is a key level to hold, as this is the last logical level where Ether could see any relief rally in the short term. If $1,740 is lost by a weekly closure, $1,350 is next (-20%).
ETH/BTC
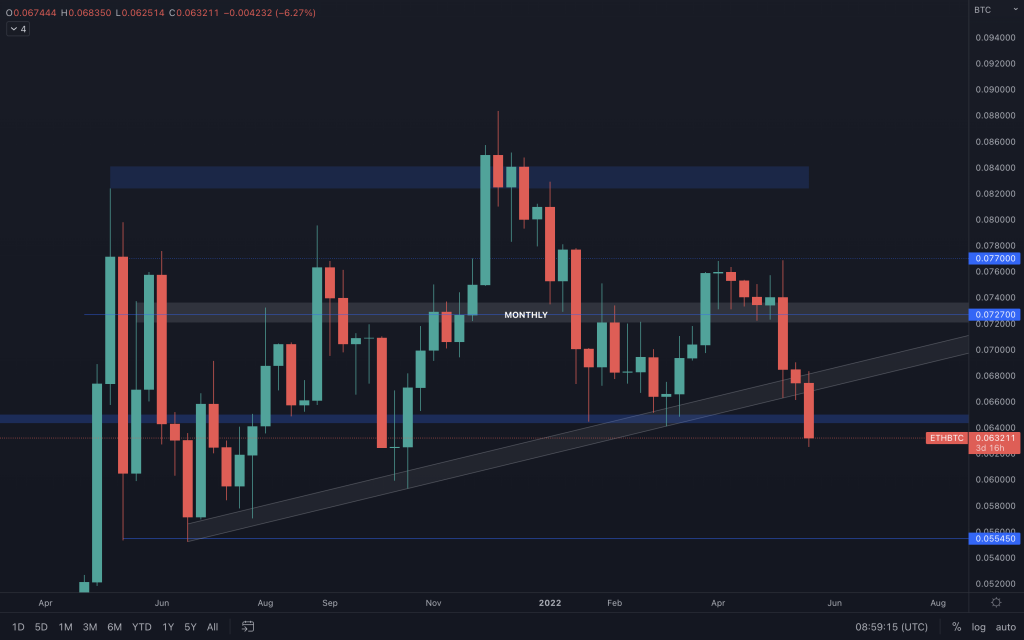
As we had mentioned in last week's Multi-Format Thursday, it's no surprise that ETH/BTC came to test support at 0.0645; a level that we were expecting to be tested. We have to see if this is a simple deviation from the supporting trendline above it. In the middle of writing this, I had an alert go off, lol. We can now see that ETH/BTC has moved below support and that there is a change to the market structure here. The weekly has now formed a lower low, bringing 0.0555 into play over the short/medium term. As ETH has continued to close above its support level of $2,900 and so has this chart, we still need a daily candle closure to increase the reliability of those mentioned above.
DOT
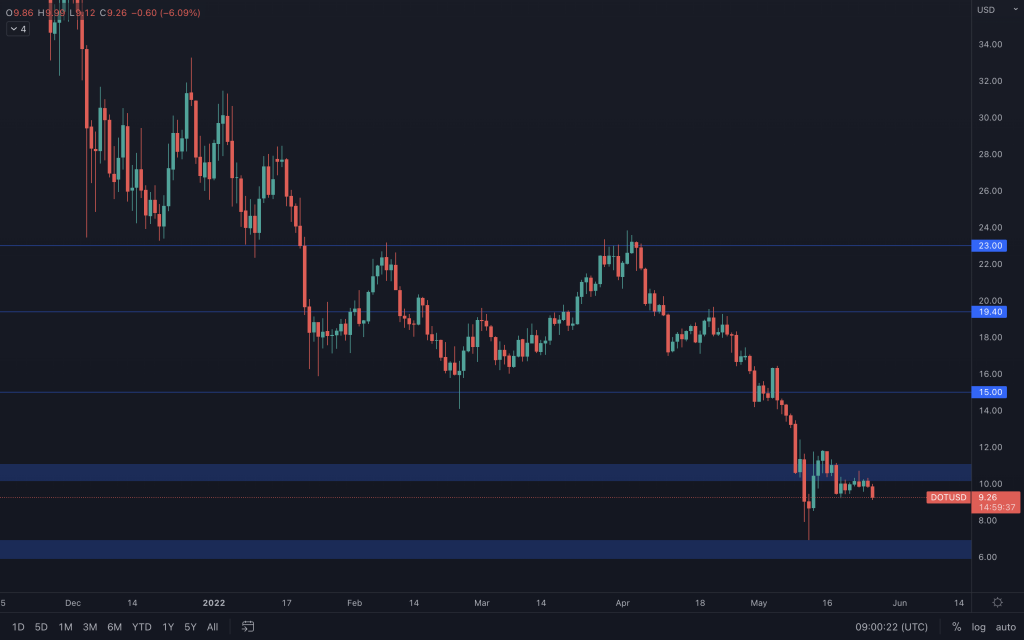
DOT's been unable to close above the $10.15 lower end of the support level, let alone the $11.10 that it needs to technically reclaim support. Along with all other altcoins, DOT has seen an early day dip. The inability to reclaim $11.10 gives a move to $6 higher odds.
SNX
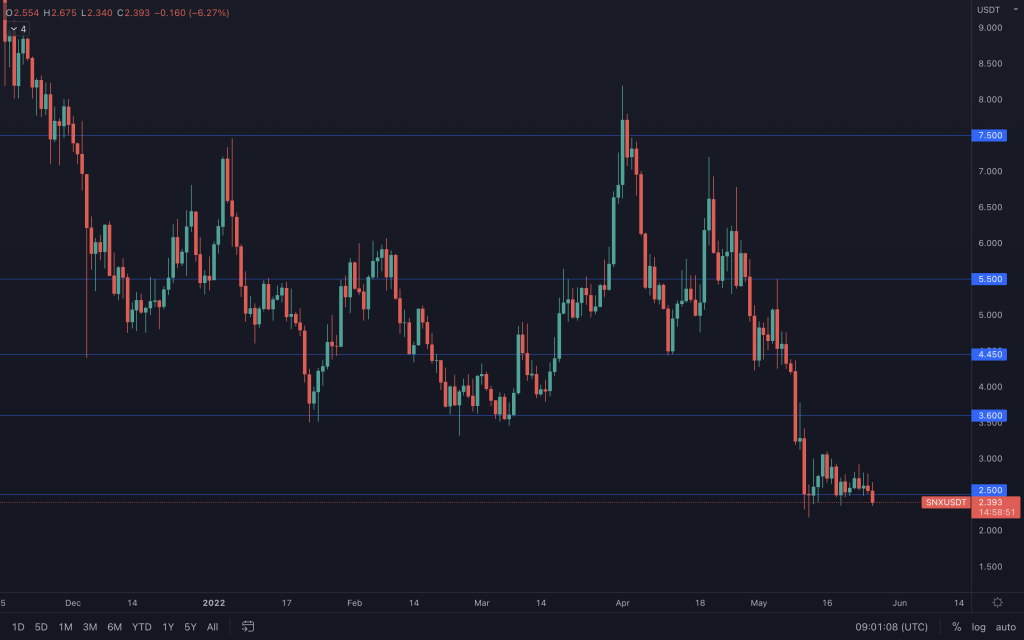
Any daily closure below $2.50 will not be great for SNX, where we then have to look at psychological levels. We've often seen it wick here and recover, so we'll have to see how tonight's candle closes.
RUNE
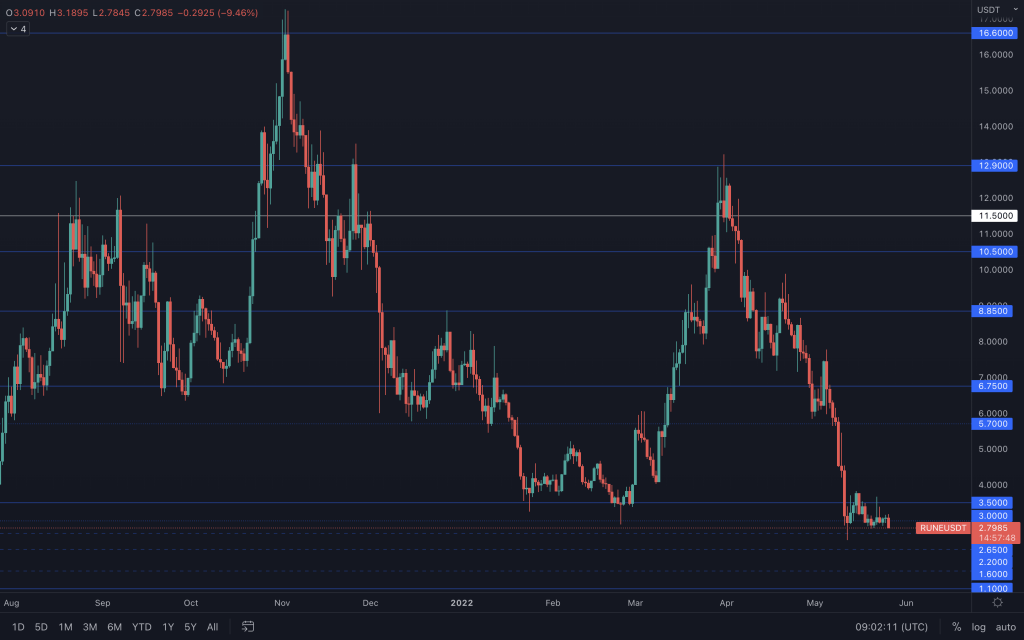
RUNE's still got one hand in the fire too. As good as a weekly closure above $3 is, repeated tests of slightly under $3 will eventually dry up buy orders and see RUNE move lower. That is unless there's a fundamental catalyst or BTC moves upwards out of the range. But it is much harder to gain traction based on fundamentals in a bear market.
SOL
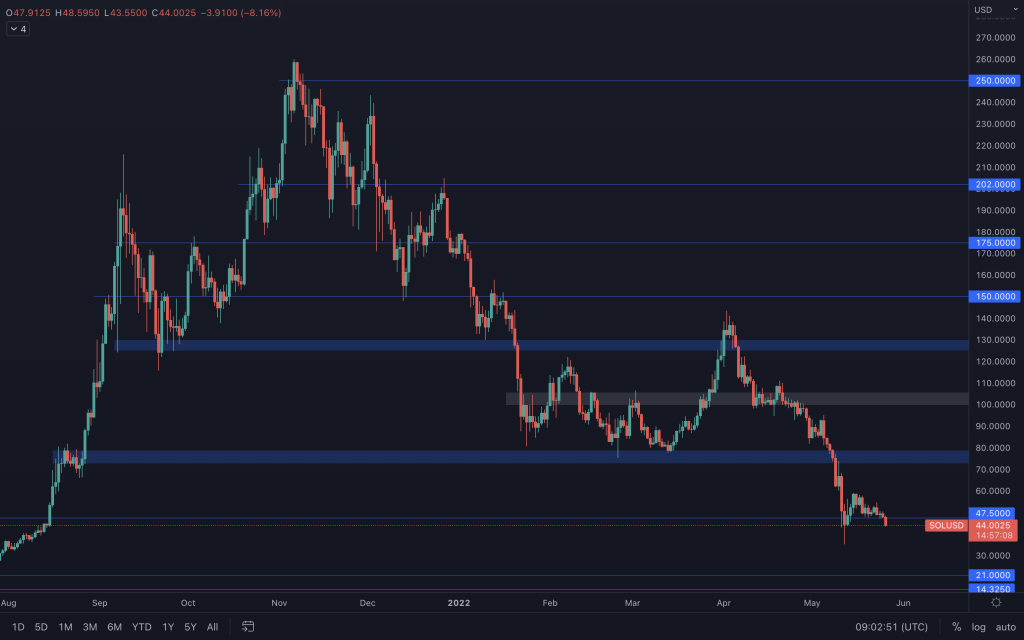
There's been no daily close below $47.50 yet. We can see that SOL is currently trading below that, and any closure here would need a swift recovery, much as SOL saw on the 13th of May. It's easy to act on impulse, but a support level isn't lost until the daily candle closes below it. With the bearish market structure, if we see a support loss, $21 does become the more likely route.
SRM
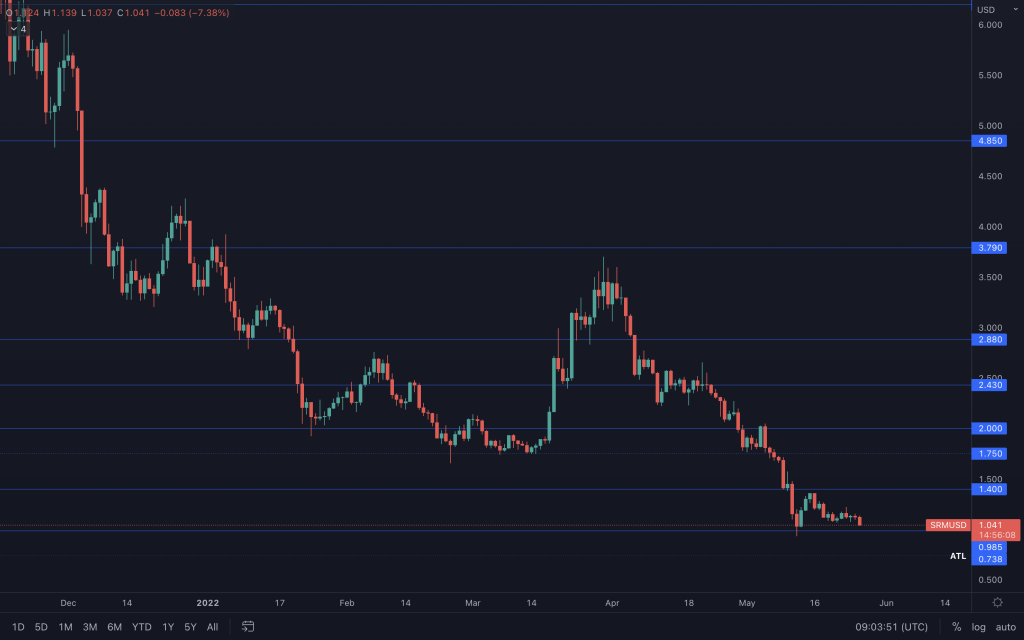
SRM continues sideways between $1-$1.40. $1 is a technical and psychological level that should hold until Bitcoin chooses its direction out of its range. Regardless, losing $1 will likely see SRM's price heading towards the all-time low of $0.74. Volume remains low across the board, displaying the uncertainty/lack of confidence around the current market.
FTT
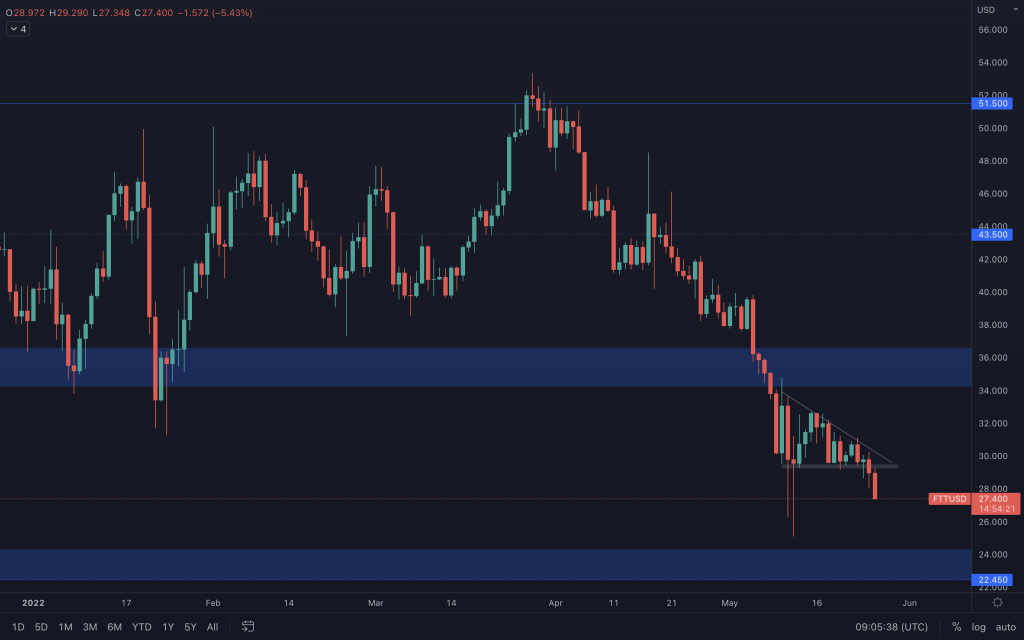
We'd been looking out for a daily closure below $29.15, and we had that yesterday. It looks like FTT is headed towards the lower end of its range which lies at $22.50.
MINA
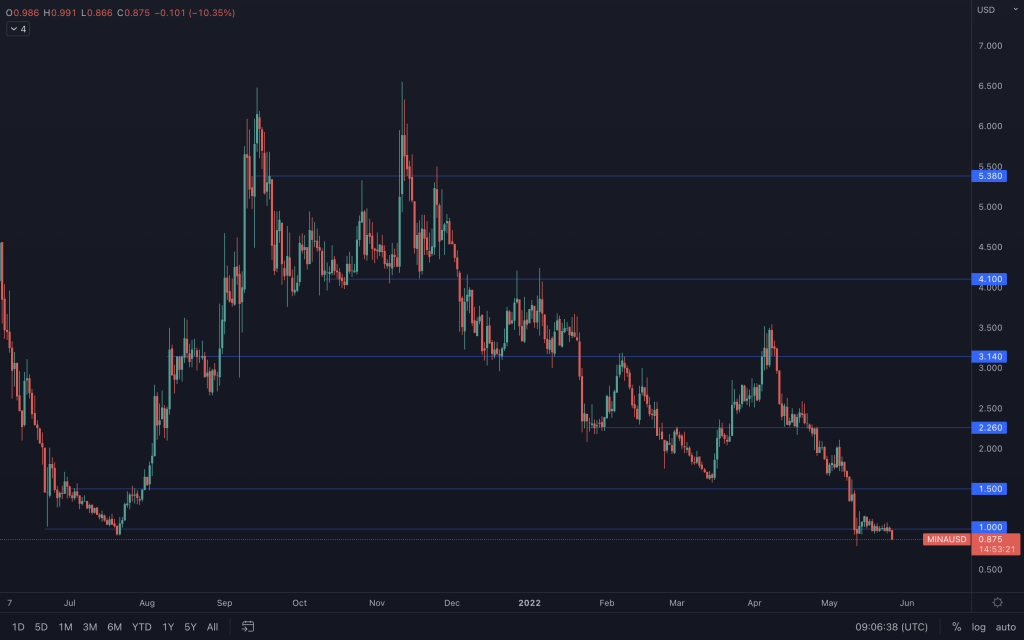
Although the daily candle hasn't closed, we see increased sell pressure coming in on MINA. With no support level below it to expect to see buy orders positioned, we've seen it dip over -10% today. It has a task on its hands to recover this by EOD as failure to get back up around $1 could see it entering into the all-time low territory in the short-term, regardless of what Bitcoin does.
dYdX
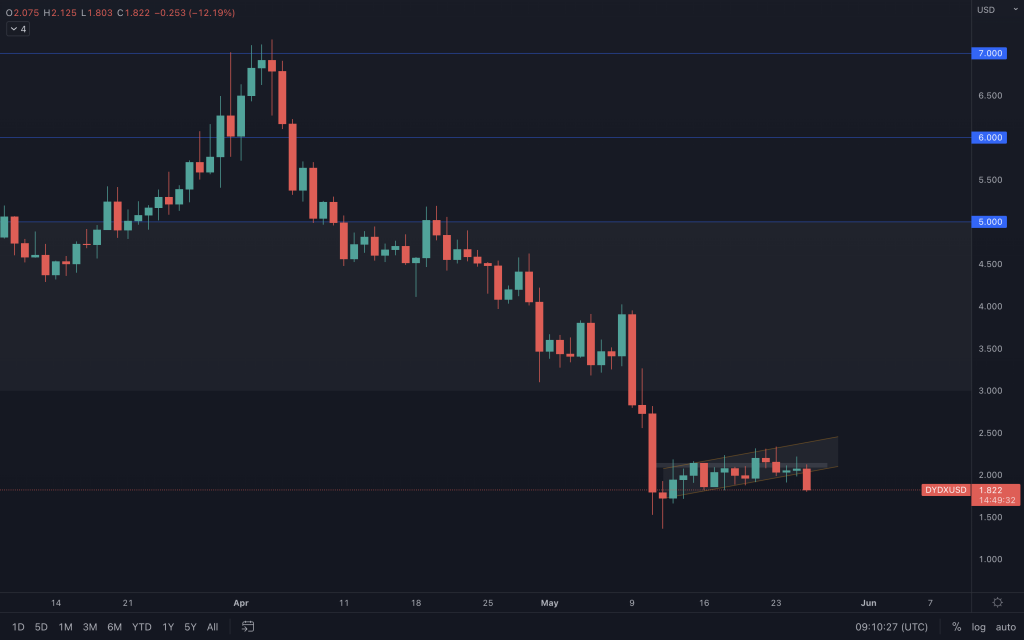
All it took was a quick intra-day range move down by Bitcoin (-2.5%) to see dYdX push down to -15%. This is because dYdX's is in price discovery to the downside, plus its volume has been extremely low compared to January 2022 and the previous. As we can see on the chart above, it has also broken down out of the channel that we highlighted in our daily T.A.
Recommended from Cryptonary


