Save 23% ($351) & Get a Free 1-1 Call with our Team ⏰ : 0d 2h 59m 44s
Disclaimer: Not financial nor investment advice. Any capital-related decisions you make are your entire responsibility and yours only.
Video Analysis
Market Sentiment
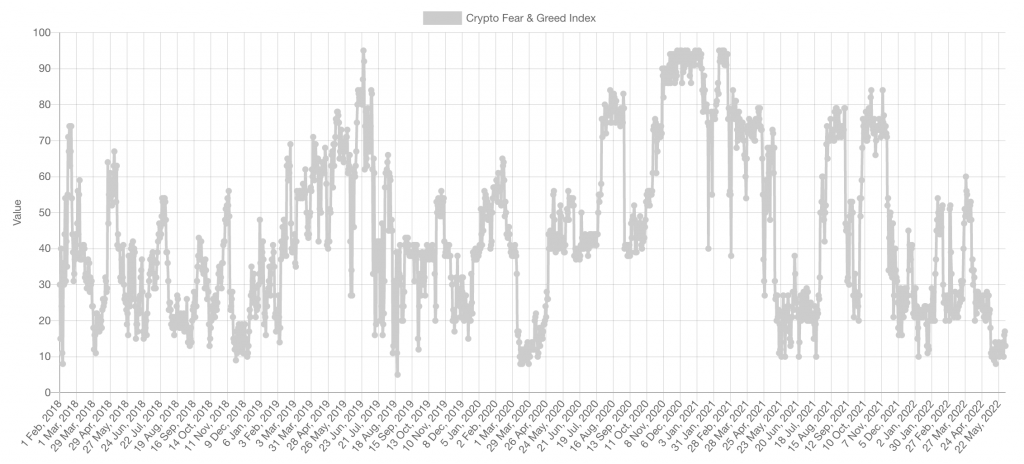
The Crypto Fear & Greed Index remains at the lower extremity. We've entered the minimum period where the Fear & Greed index has historically indicated that this market is near a bottom. In mid-2021, we'd seen this index continually revisit the lows over three months, which is why it can't be deemed reliable for timing the market.
Open Interest & Funding Rate
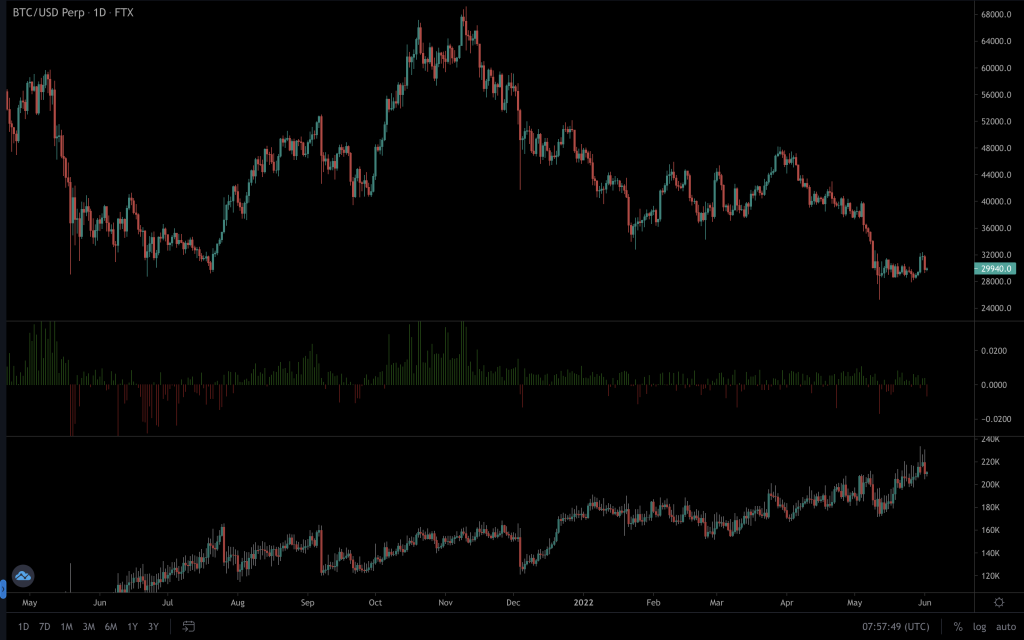
Now and then, the market sees a violent move that washes out over-leveraged traders. The last such action was the one from $40,000 to $25,000. What's interesting is how quickly the Open Interest has recovered to head back into the highs. Unfortunately, there's no bias yet, as the market has mostly moved sideways during this period. The funding rate remains relatively neutral, suggesting a healthy amount of shorts v longs. Only when the funding rate turns negative for a sustained time (even better when it's -0.01 or more) does it indicate that we may have a local bottom. The opposite applies to a top, and neither of these is the case here. But we must remain alert, as with the O.I being at the highs once again so quickly, there could be another quick move ahead.
Total Market Cap

From a monthly perspective, we can see that the Total Market Cap has seen an early pump (almost) up to $1.35T. Unless we were to see this level reclaimed by a weekly closure, the likely route is seeing downside to the $1T level. We have formed a local support level at $1.2T, so closing below that should signify the beginning of a move down towards $1T.
Don't forget, the crypto market and stock market have been closely correlated of late. June the 1st signals the start of the FED reducing the size of its balance sheet (quantitative tightening) to combat increasing interest rates, and this will be ramped up in 3 months. The actual effect of this policy has yet to be seen. Still, it does begin to reduce liquidity from a market that has seen considerable inflow during the Covid pandemic, thus increasing the dollar's strength. With a slowdown in economic growth, the stock market is undoubtedly facing additional headwinds, which we may see reflected here.
Altcoins Market Cap

The Altcoins Market Cap is clinging onto $645B, but losing this level would add considerable sell pressure to altcoins that have already seen more pain than BTC. This is reflected in the BTC.D chart, which looks like it's headed in the direction of 50%. We'll talk about this more on the Bitcoin chart.
BTC Dominance

No explanation is needed here. We've included this chart for reference.
Bitcoin

We know that Bitcoin has created a local bottom of around $28,685 and that this ties in nicely with where Bitcoin has historically wicked to back in 2021; it is what we have referred to in the past as a 'high-value' area. Should BTC lose this level (certainly by a weekly closure), downside would likely be the outcome. If Bitcoin is to see any relief from here, this is where we would expect to see it. Bitcoin has formed nine continuous weeks of red candles, a record for this chart. The past two weeks have seen decreasing sell volume for the first time during these nine weeks. Over the past three days, the price action has also given Bitcoin's daily chart a higher high, so all that is needed now is the formation of a higher low. Should we see a move up, Bitcoin's chart looks healthier than many other assets in this analysis. Whenever the market signals a change, funds tend to flow into BTC first. When we include the BTC.D chart in this analysis, that helps to indicate that we will see Bitcoin outperform the market in the near term. That can happen two ways, though; BTC drops less in value than altcoins or it outperforms altcoins in price appreciation. We've also shown the 8-hour chart multiple times in our analysis, and yesterday's candle came down to retest the breakout from the descending triangle. To be clear, downside isn't invalidated and we can attribute the move up in price to the end of month volatility, but we have highlighted the ways in which it could become valid. Volume across the market remains relatively low, so any pump in price would likely be short-lived.
Ether

ETH is also at support, like Bitcoin, but its market structure is lagging behind Bitcoin's, should we see a bullish move. It's entirely possible that with ETH being considered one of the two majors at this moment, if Bitcoin sees relief, we see that reflected here. But for that to be confirmed, a market structure change would need to occur. This could be by creating a higher low and then a higher high above $2,000. If that is the outcome, then a retest of $1,900 may be a nice location for a long. If the market moves quickly, then a reclamation of $2,150 should offer a move up towards $2,500. Waiting for a confirmed change is the safest bet as the market is moving on low volume. From a weekly point of view, moving with the market's bias and looking for shorts will continue to be the 'safest' play. Only seeing a change to a weekly structure would alter the bias. So, after talking about the potential upside, we have to be fair and talk about where Ether currently is. $1,740 is a level that ETH needs to hold as support. Closing below that would continue the bearishness evident in the chart.
ETH/BTC

ETH/BTC has lost the supporting trendline and its higher timeframe support level, giving a bearish outlook over the medium term. Last week closed above an intermediate support range that gives ETH the potential to outperform BTC in the near term, but we'd need to see that confirmation on Ether's chart - something that hasn't happened yet.
DOT

DOT closed last week below $10, which gives it a bearish outlook. If we see it close above $10.50, we expect to see some relief that could stretch as far as $15.
SNX

Believe it or not, SNX is one of the strongest looking altcoins at this point. Volume has sustained at healthy levels for over 12 months, indicating that when the market turns positive, SNX should perform well. We have seen its price depreciation slowing, with it holding the fundamental $2.50 level. We know that any closure below wouldn't be good for price action. Right now, looking out for a higher low may see SNX move towards $3.60 again and possibly even $4.45.
RUNE

A little information here: Binance will be supporting the BNB.RUNE to Native RUNE swaps, taking place on June the 6th, indicating that THORChain is looking to move to what is officially labelled as 'mainnet' relatively soon.
Back to price action. RUNE needs to close above $3.50 to stand a chance of seeing any relief. We've seen one failed attempt, but in keeping with its bearish market structure and BTC's dip in price, it simply became a retest of $3.50 as resistance. The weekly chart in its current state points towards RUNE heading in the direction of $1. So we must be prepared for that to be the case unless we see an invalidation.
SOL

SOL continues to paint a bearish outlook as it takes the steps down to lower prices. The weekly chart points to us seeing it at $21 eventually, and the daily chart doesn't indicate otherwise. Reclaiming $47.50 by a weekly closure would provide SOL with an invalidation of that theory.
SRM

SRM hasn't lost, and whilst that is the case, we expect to range between $1 and $1.40. It hasn't managed to alter its bearish structure within this range, so the pressure does remain to the downside, and it isn't out of the woods.
FTT

Like many assets here, FTT had a perfect retest of the $29.25-$29.50 intermediate level that we had drawn from previously. We saw an indecisive daily candle, slowing price appreciation, and a retracement back towards the lows. $22.50-$24 continues to be the likely route.
MINA

After closing last week at its lowest price ever, MINA paints a pretty bearish picture where we have to look at the lower psychological levels for signs of relief. We've seen a failed attempt to close above $1 on the daily timeframe, which doesn't look too good and gives way to higher odds of lower prices.
dYdX

dYdX finds itself stuck within a range that stretches between $1.50 and $2.10. Waiting for a break in either direction should indicate its next move. It is trading on extremely low volume, so expect the negative moves to continue to be larger than those on green days.
THOR

THOR is still within the old consolidation range and continues to be bearish. A break out above it may offer a nice move into $0.75, but this would only likely happen if BTC is on-side. For now, expect further ranging and a gradual move towards the lower end of the range.
Recommended from Cryptonary


