Disclaimer: Not financial nor investment advice. Any capital-related decisions you make are your entire responsibility and yours only.
Video Analysis
Total Market Cap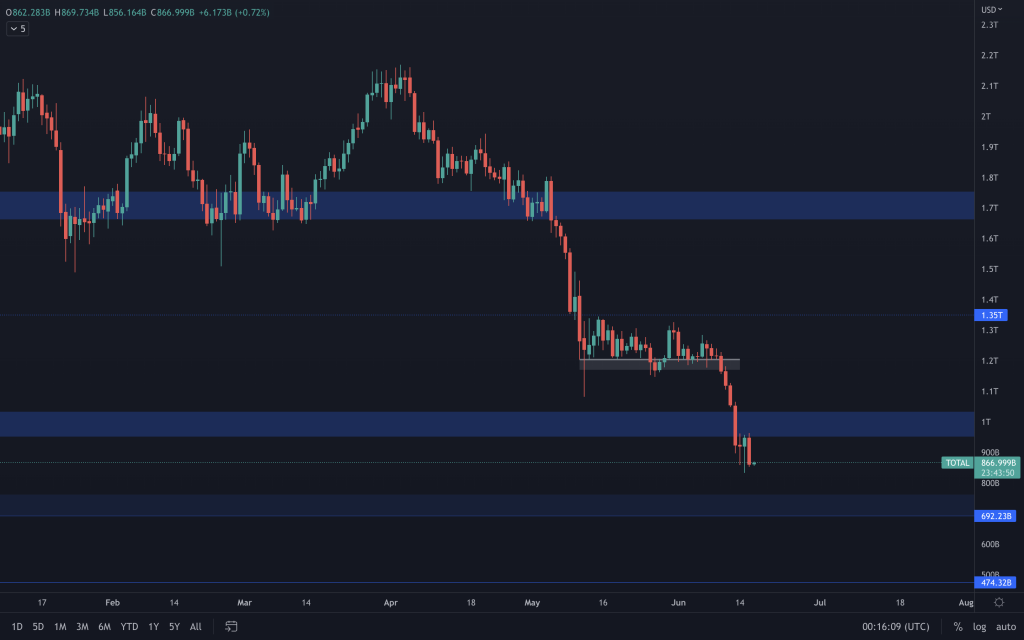
With the total market cap having created support at $1.17T, a chance of seeing a relief rally was on the cards if it could reclaim $1.35T. Then came the higher-than-expected CPI data, which immediately affected financial markets. With the FOMC meeting taking place just days later, there now loomed a possibility that the FED would go with a higher rate hike in a more aggressive attempt to tame rising inflation. As such, we saw markets begin to account for a rate hike higher than the 50bps Jerome Powell had hinted towards in March's meeting. The result continued the bearish trend, losing the $1.17T local support and eventually moving sub $1T, giving us support around $700B (the old 2018 high). With today's bearish candle, we'll likely see this index heading towards support unless bulls show up soon.
Altcoins Market Cap

The altcoin market cap is just above its $455-$475B support level (2018 high). It will likely be short-lived if we see any relief in this index. Yes, it may make sense that we see a bounce across altcoins, with Bitcoin's dominance decreasing and this index testing the 2018 level as support. But the market conditions at this time aren't favourable. Therefore, we must remain cautious and wait for the chart to develop. As we've now mentioned Bitcoin's dominance, although we're seeing it decreasing, much of the funds are currently moving into stablecoins rather than ETH or alts. This explains why we see a worse performance across alts than one would usually expect; we aren't seeing that usual rotation from BTC into alts.
Bitcoin
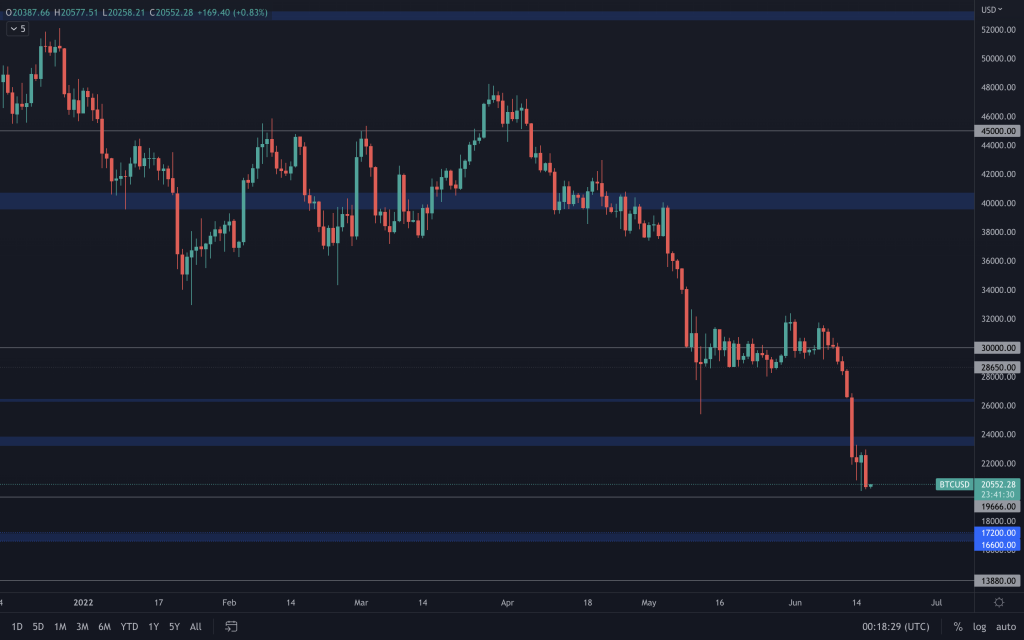
Although Bitcoin closed bullish on Wednesday, we stated it was too close to the FOMC press conference to be a reliable closure. The bullishness would have needed to continue today, along with reclamation of $23,850 to indicate the likelihood of any further relief. That didn't happen, and we now see a bearish Bitcoin pushing back down towards $20,000. A closure below $20,000 brings $17,000 into play. One would usually expect $20,000 to hold some weight as support, given that it's a psychological and technical level (2018 high). In our Weekly Technicals Digest, we highlighted that the weekly 200MA sits just above $22,000, which has historically been a reliable indicator of a bottom. The RSI is also at an oversold value that Bitcoin has never been at on the weekly and monthly timeframes. These indicators may suggest that a bottom is in/close, but we have to remind ourselves that the market is highly bearish (price depreciation hasn't slowed), and it's sensitive to current global events. We can use all of the indicators in the world to show that prices should go up from current levels, but that doesn't mean they will. It's why we observe the charts and look out for confluence. Until we see that, there's every chance of the price following the trend. Bitcoin (and crypto) has never experienced war and global inflation of this magnitude before.
Ether
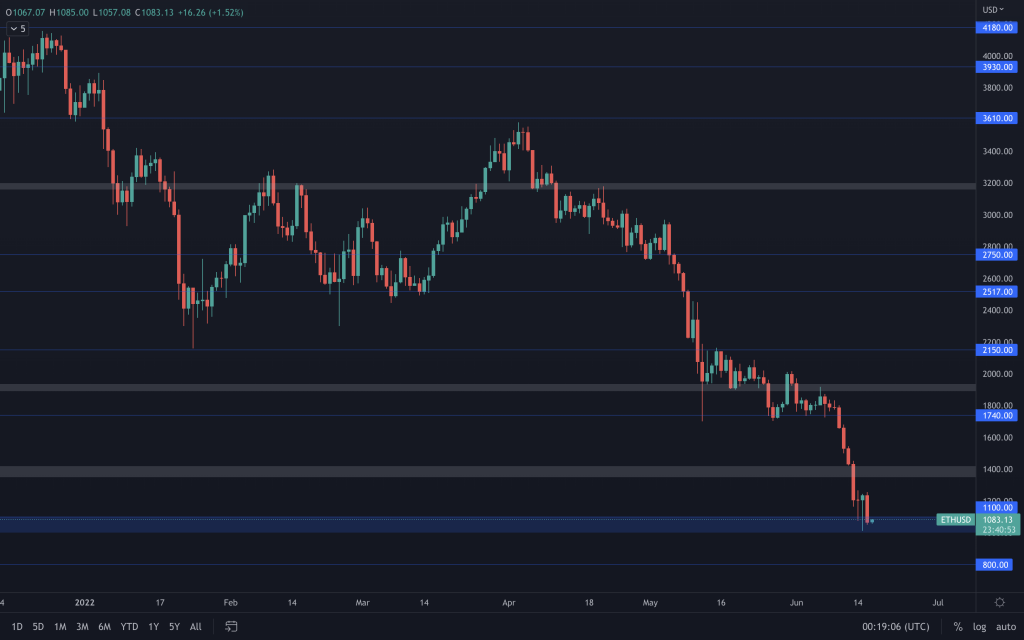
Ether closed Wednesday with a hammer candle too. But, as we'd mentioned, it would have needed to close above $1,420 to indicate any further upside. It didn't. ETH now needs to hold $1,000 as support because closing below will open it up to a minimum 20% drop to $800.
DOT
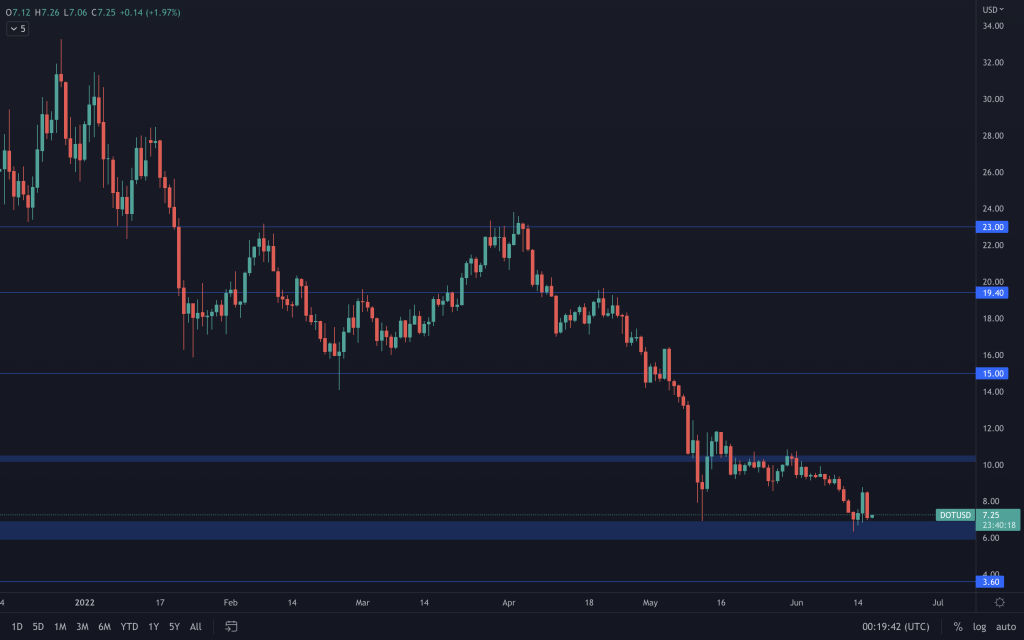
With Bitcoin leading the way, DOT failed to break above the resistance at $8.80, rejecting it and keeping its daily bearish market structure intact by forming a lower high with a bearish engulfing candle. Before looking at the other charts, this is probably the case for many altcoins. With the bearish structure intact, there's no entry point or pattern to trade. But a closure below $6 would bring $3.60 into play. At this moment, it's worth noting that we'd need to see BTC moving below $20,000 for that to become a possibility.
SNX
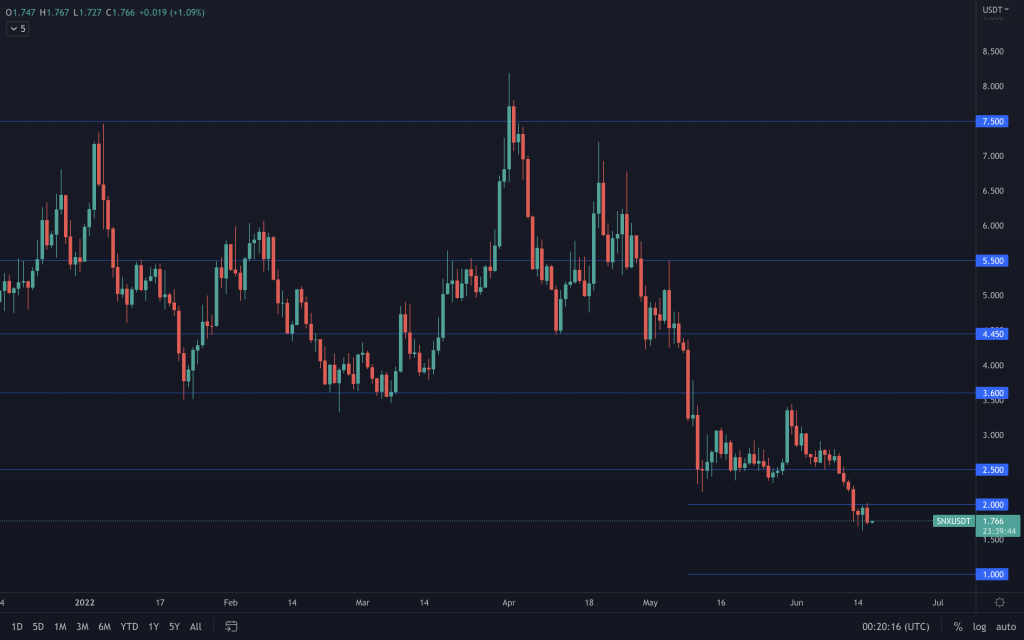
SNX has closed with a bearish engulfing candle from resistance ($2). This opens it up to a drop to $1.50 and potentially $1. Keeping an eye on Bitcoin and the altcoins market cap is essential given that they are both at support.
RUNE
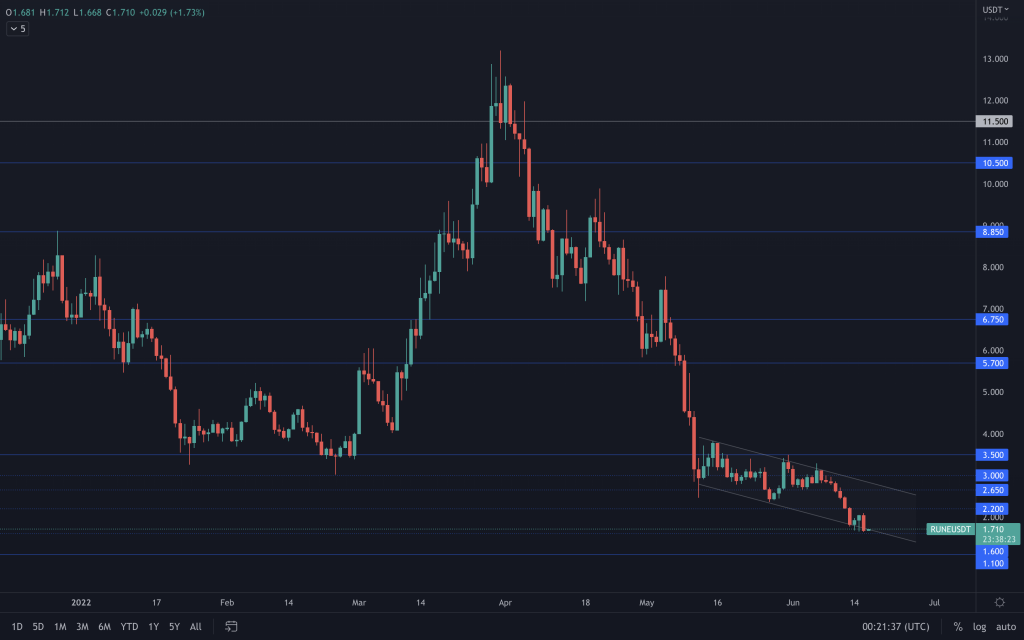
In keeping with the rest of the market, RUNE is moving down. But it's doing so within a channel. Seeing a breakdown from it and a loss of $1.60 as support would line RUNE up for a visit to $1.10. Of course, after such a bearish daily closure, BTC has its work cut out. Any relief there will see RUNE continue within the channel.
SOL
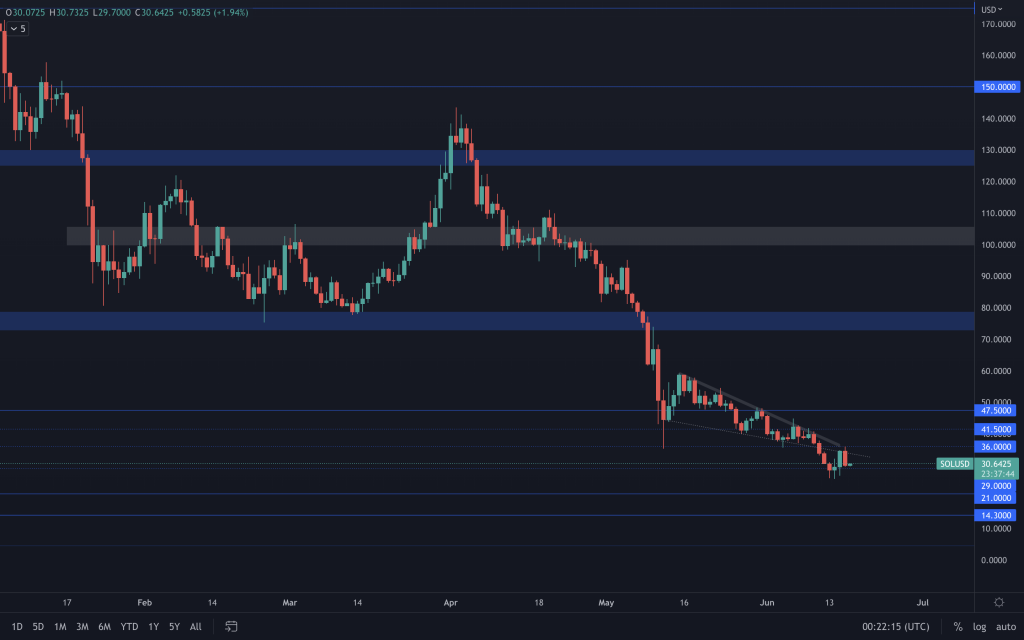
SOL broke out of its descending triangle to the downside and has since retested it as resistance, creating another lower high in the process. Losing $29 as support by a daily closure would put $21 up next. On the flip side, if BTC were to see relief, then we'd be looking for the beginning of a change in daily market structure.
SRM
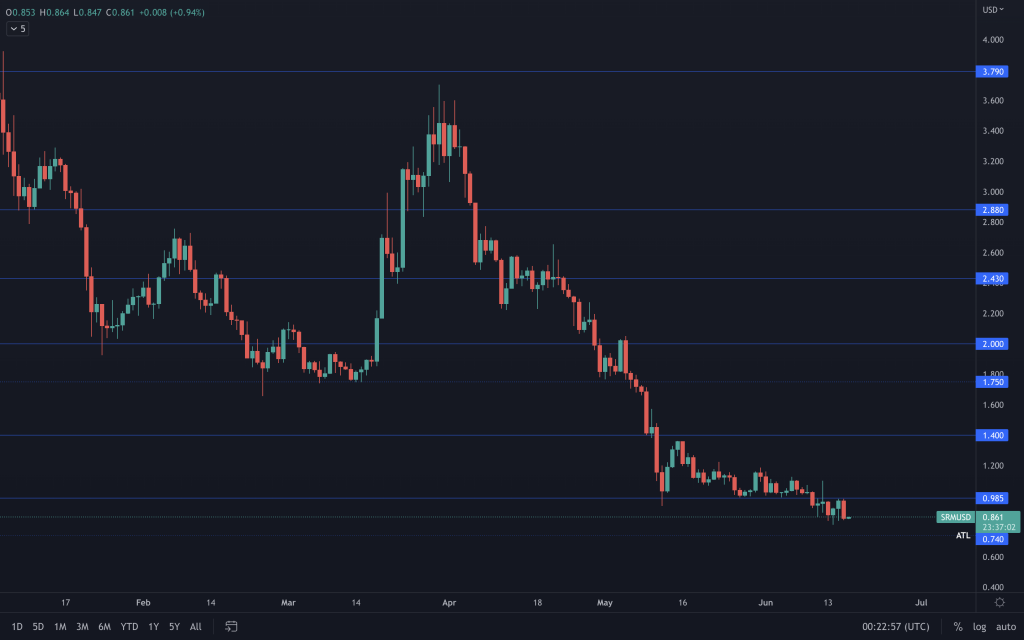
After failing to close back above $1 and (you guessed it) a bearish engulfing candle, SRM looks set to continue its bearishness down towards $0.75.
FTT
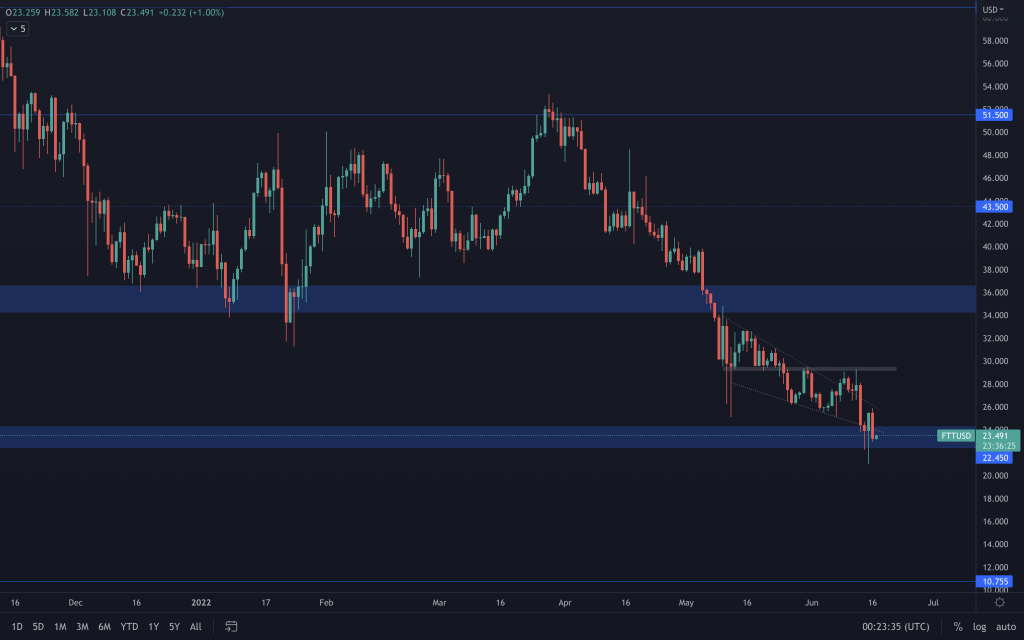
FTT is coming to a decision-making time on its USD and BTC charts. As you can see in the chart above, the price has now come down to test support at $22.50. Thursday's candle closed as a bearish engulfing candle but hasn't closed below that support, so we can't yet presume further downside. If it does close below, there is potential for a 50% drop in price. Meanwhile, the FTTBTC chart has appreciated well the past fortnight and is now at a resistance that has proven to be tough to break. The volume through the move has been relatively low, though. So, the chance of breaking through it is slim, as high volume and positive price action need to go hand in hand. But it is certainly something that we'll be keeping an eye on.
MINA
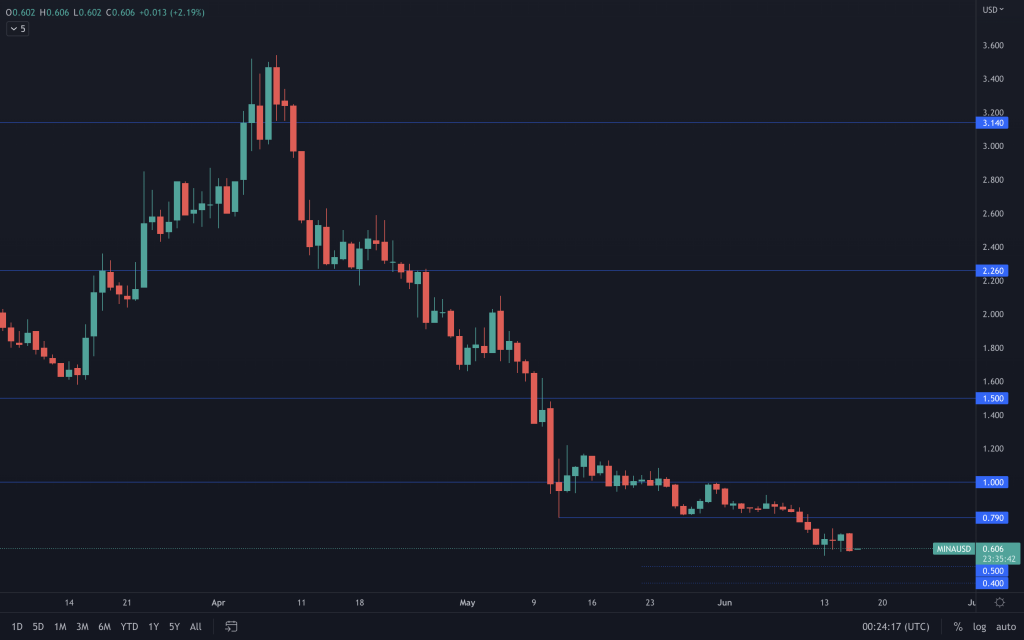
To date, MINA's failed to make any advance on $1, and with no indication of that turning around, it still leaves $0.50 (possibly lower) on the cards.
dYdX
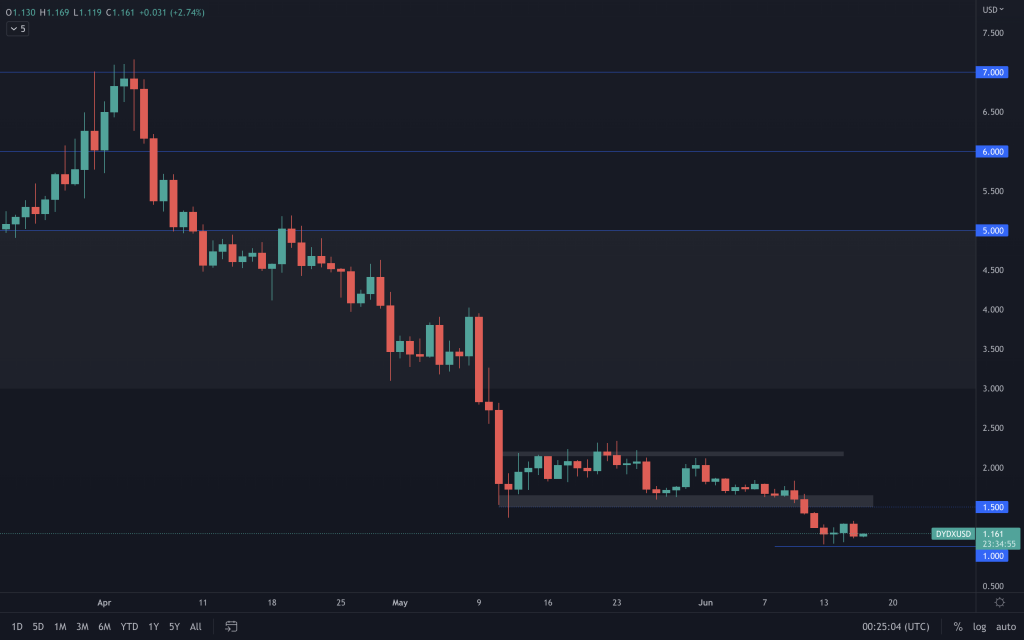
Downside price discovery has brought dYdX down to test the psychological $1 level. With the market continuing to show bearishness, there could well be further downside in store. There's no doubt that dYdX is at an attractive price, but waiting for better market conditions is the safest bet.
Recommended from Cryptonary