Save 23% ($351) & Get a Free 1-1 Call with our Team ⏰ : 0d 2h 59m 43s
Disclaimer: Not financial nor investment advice. Any capital-related decisions you make are your entire responsibility and yours only.
Video Analysis
Total Market Cap
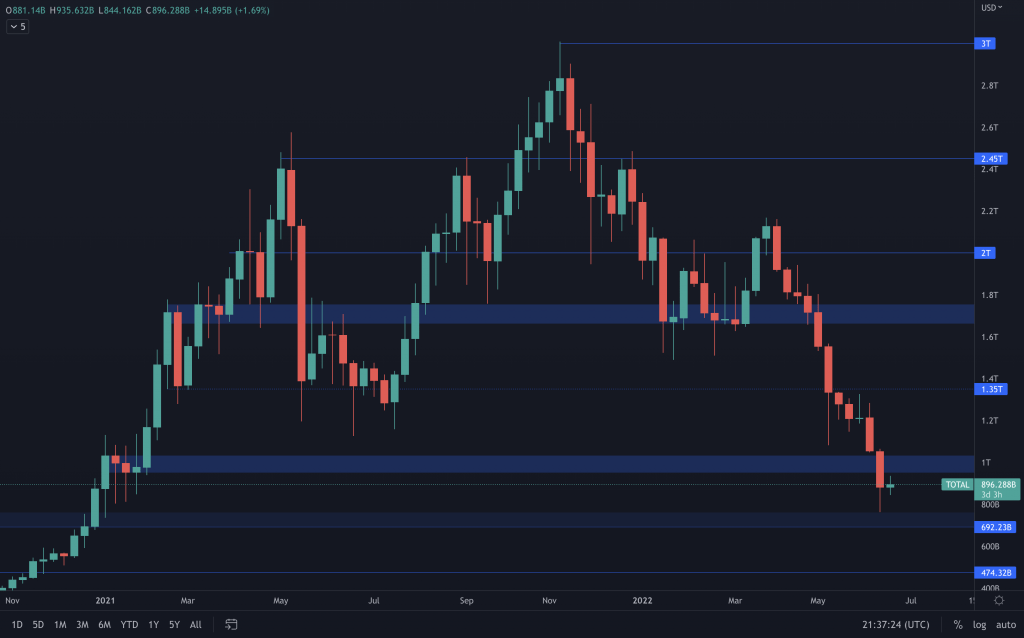
The Total Market Cap has continued to drop since our last Multi-Format Thursday, visiting the highs created in 2017. It eventually pulled back enough, meaning that Bitcoin was able to close the week above its 2017 high. At this point, there is little difference between where last week's candle closed to where the index is now. If we look at the daily timeframe, we can still see an inability to create any meaningful bullish structure to push the index back above $1T.
Altcoins Market Cap
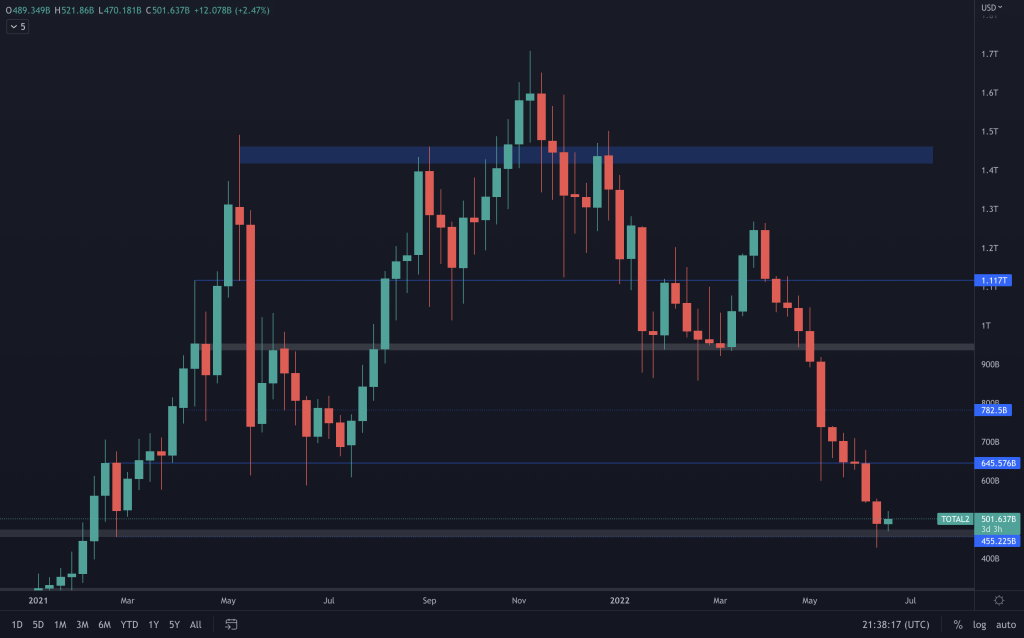
On the other hand, the altcoin market cap is sitting on support at $455B (another 2017 high) after seeing 11 weeks of straight red candles. But it, too, is in the same boat of not being able to gain any upside momentum. Each moment of relief is met with suppression. Unless that changes soon, it'll be a matter of seeing the index closing below $455, bringing more pain to altcoins.
Bitcoin
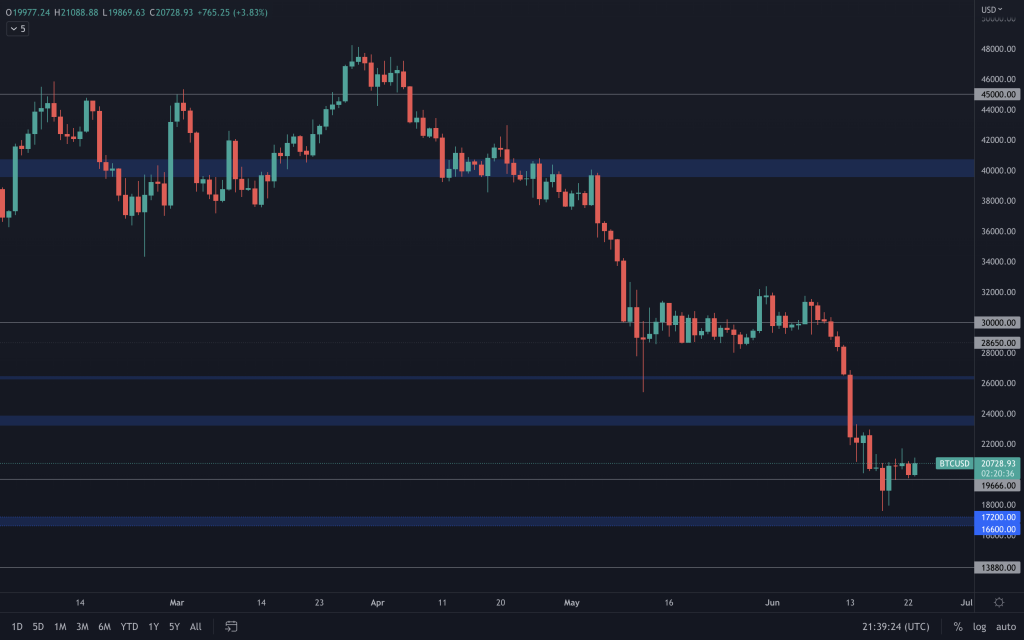
After a heavy sell-off last week that saw Bitcoin's price plummet by over 22%, it's now sitting just above its 2017's all-time highs. It's a level that has only seen interaction a handful of times, making it more of a psychological support level than a reliable one with supporting historical price action. We must be careful, as Bitcoin can easily drop below it once more, and we could still see further capitulation. The daily timeframe has also failed to make any progress regarding moving bullish.
Ether
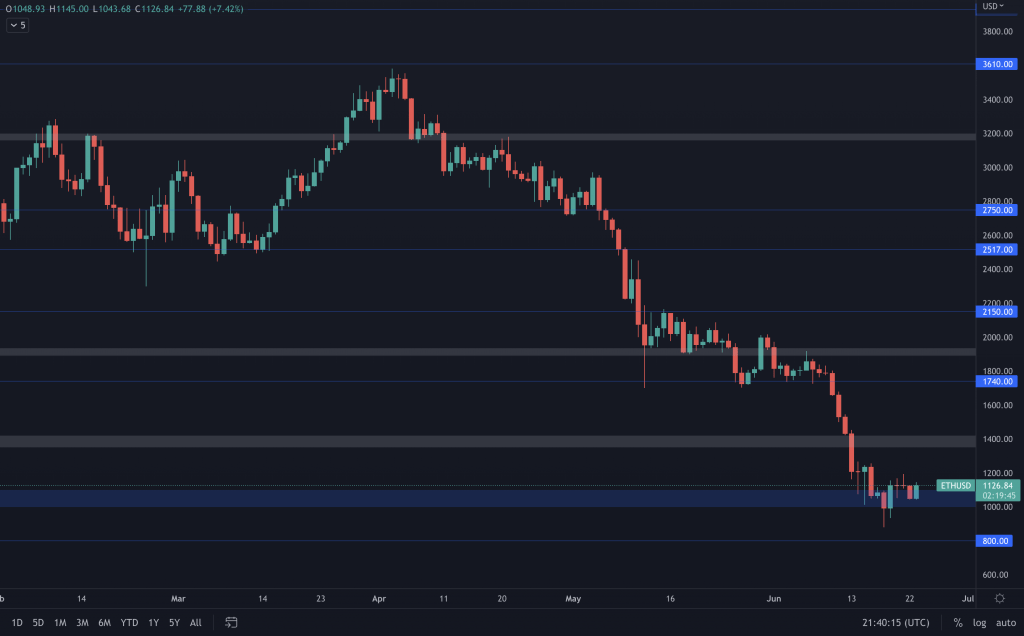
It's been a relatively quiet week for Ether as it has failed to make any ground either way. Its volume has slowly returned to more normal levels seen before the fall through its 2018 all-time high. It's not painting a great picture as you'd typically want to see more of a fight from bulls to reclaim it. Instead, it's continuing to slowly devalue where a loss of $1,000 will have it moving towards $800 once more.
DOT
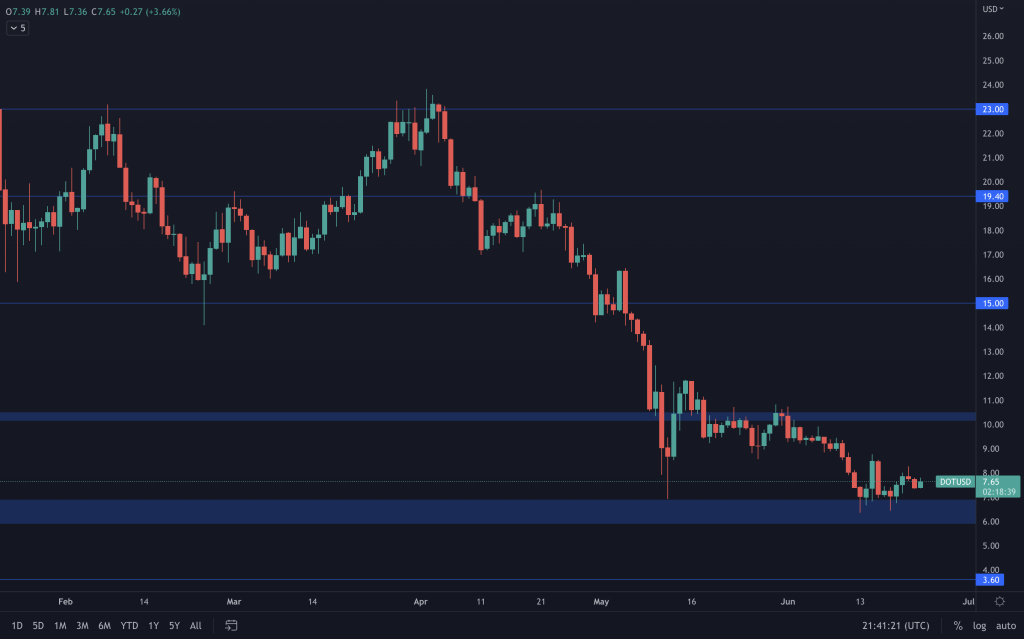
After an impressive push last week that saw DOT push up over 40% from its lows, it didn't do anything to alter the bearish bias of the chart. DOT, too, continues its bearish trend and, breaking below $6, will see further downside, towards $3.60.
SNX
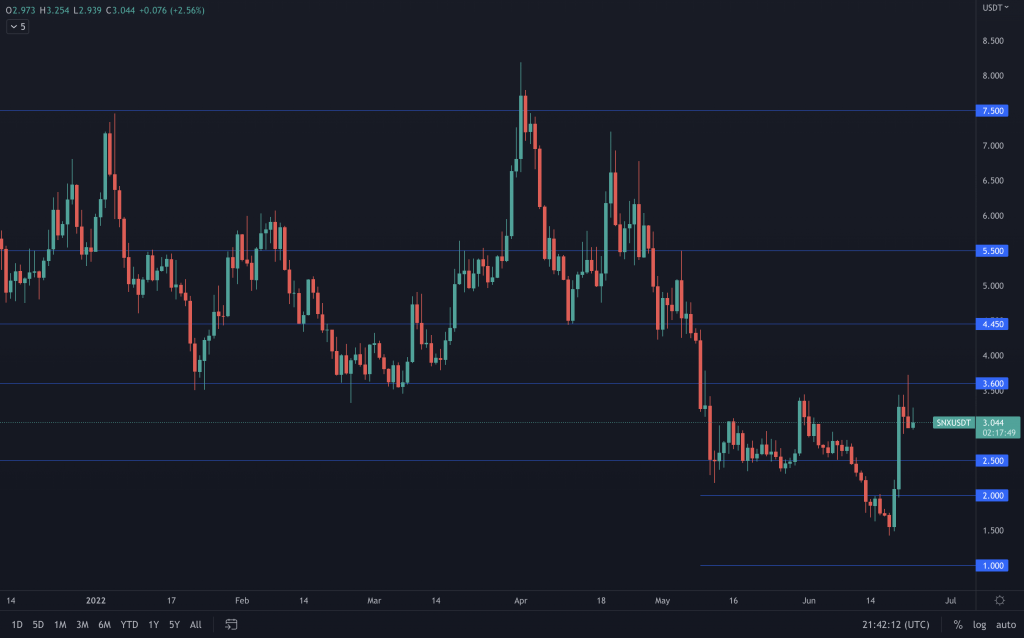
SNX's price increased as atomic swaps went live, which saw its daily volume almost double to over $200m. It's naturally had difficulty getting above $3.60 with it being a weekly resistance level. Firstly, we're looking to see SNX close the week above $2.50, as anything below will have it heading back into the lows. But a weekly closure above $3.60, if it can manage it, would be impressive and put $5.50 within reach. For this to happen, it would very likely need Bitcoin on-side. Because if it drops below $20,000, all it's done is give SNX more breathing room.
RUNE
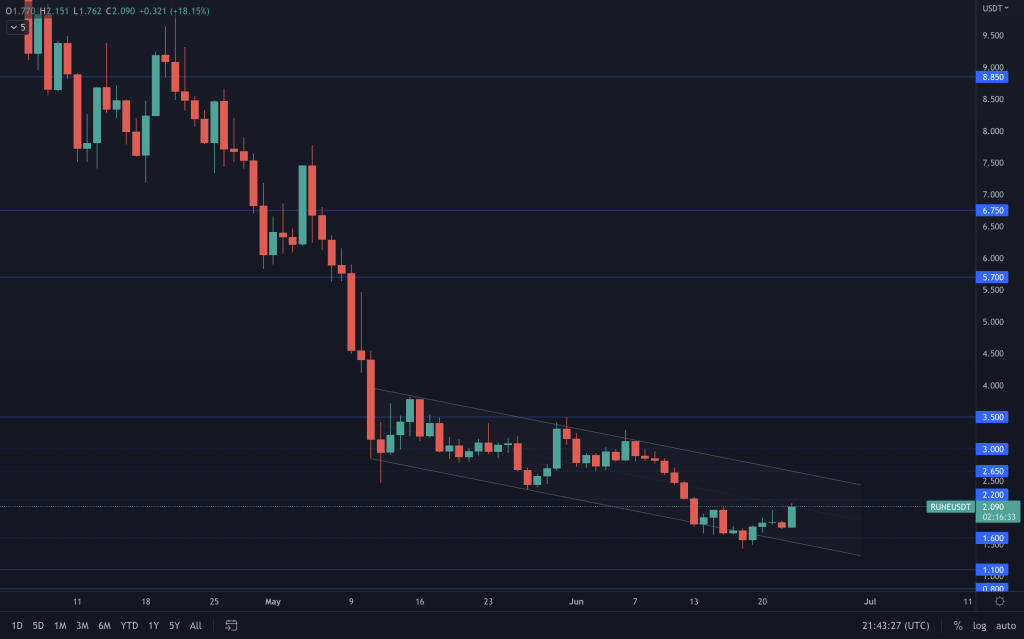
Today, the THORChain team finally announced the transition from CHAOSnet to mainnet, even though a core dev announced it last week. It hasn't changed anything in relation to price action, as we can see that RUNE continues to move down within a channel. Any break from the channel should indicate RUNE's next direction.
SOL
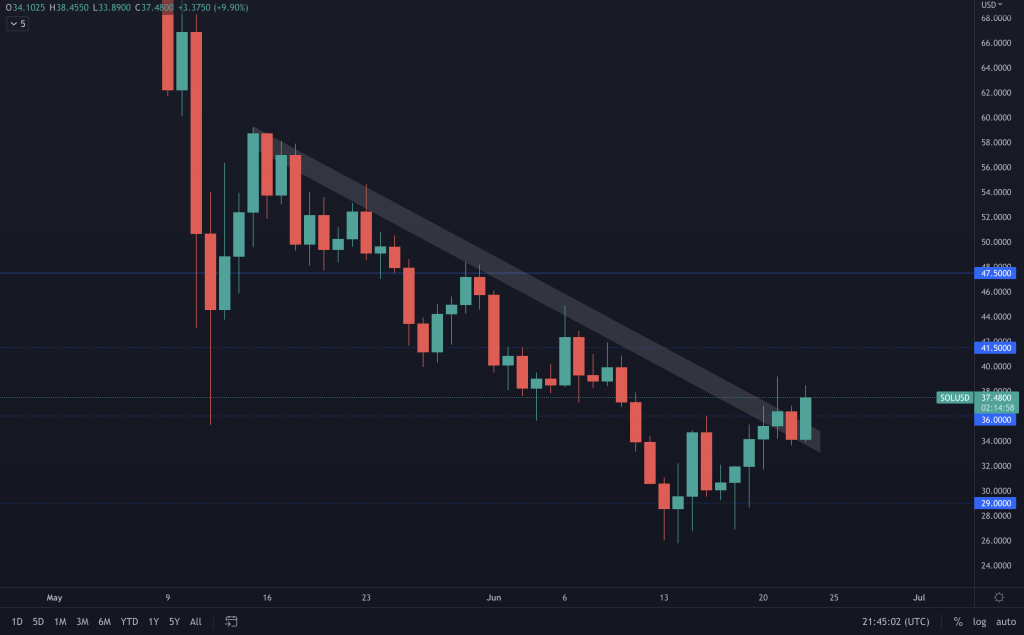
SOL is one of the few assets that has created a daily bullish market structure. If it can hold onto it by the daily close, the next level on its radar is $41.50. We highlighted a potential double-bottom set-up in the pro channel a few days ago.
SRM
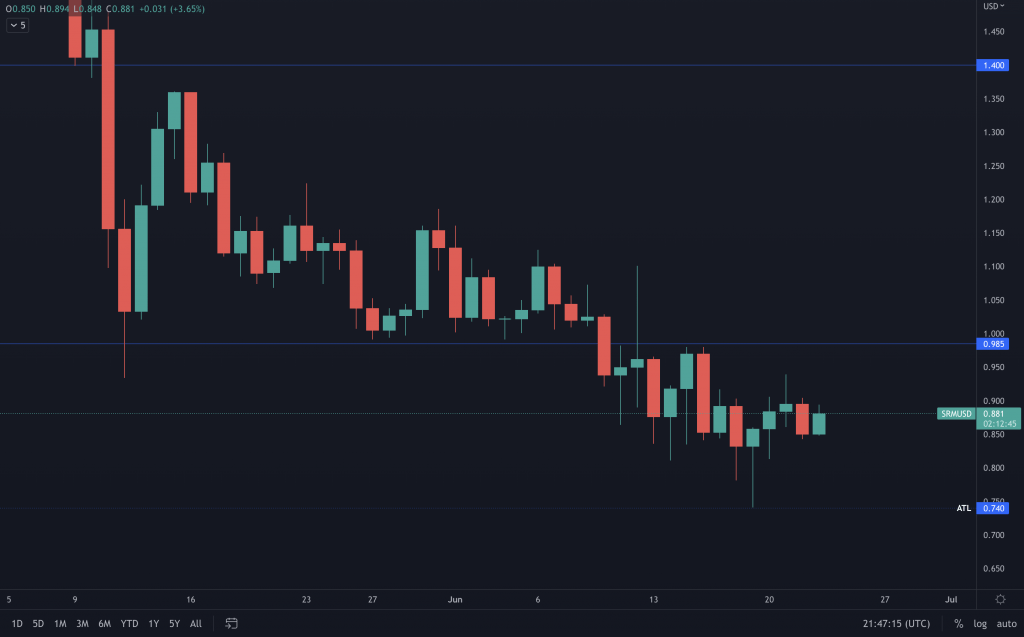
Whilst SRM is below $1 and taking the steps down into continuous lows, it's not looking too great. We're waiting for it to either reclaim $1 or close below $0.74, which will see it move into uncharted lows, with $0.50 being our next level of interest.
FTT
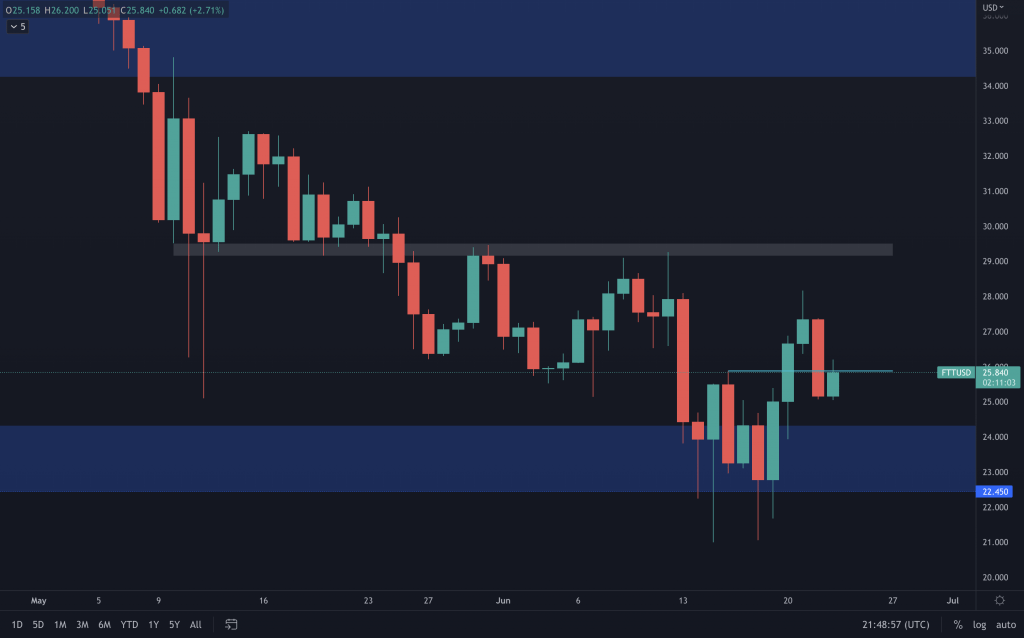
Like SOL, FTT has created a daily bullish market structure. Yesterday's candle closed as a bearish engulfing, which does urge caution, as the price can easily push lower should it not be able to close above $25.88 any time soon.
MINA
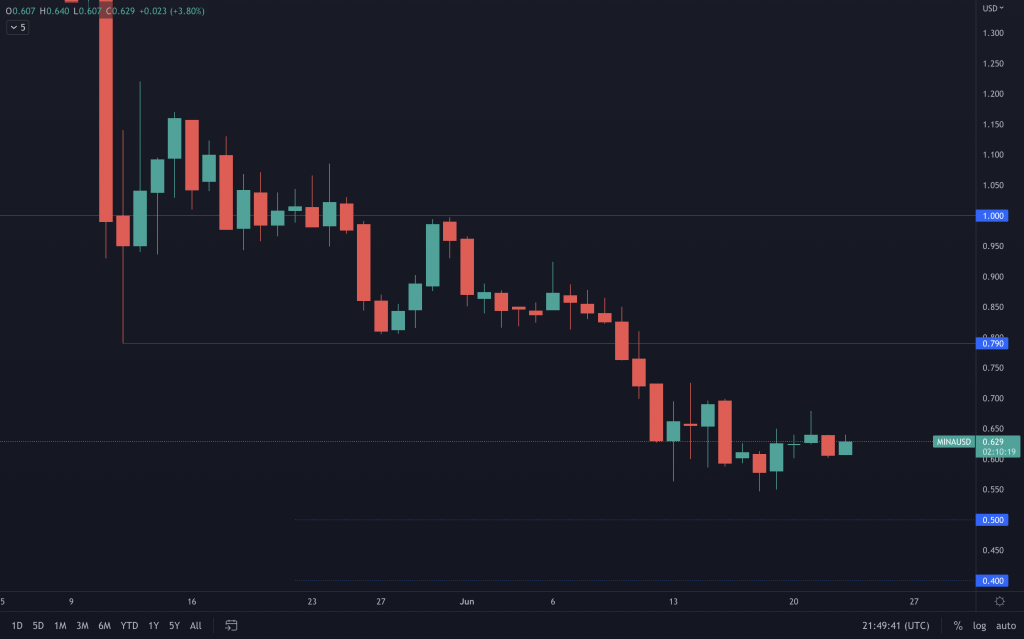
Up to now, there's no indication that MINA is about to alter its structure, and unless it does that, $0.50 is where we continue to look.
dYdX
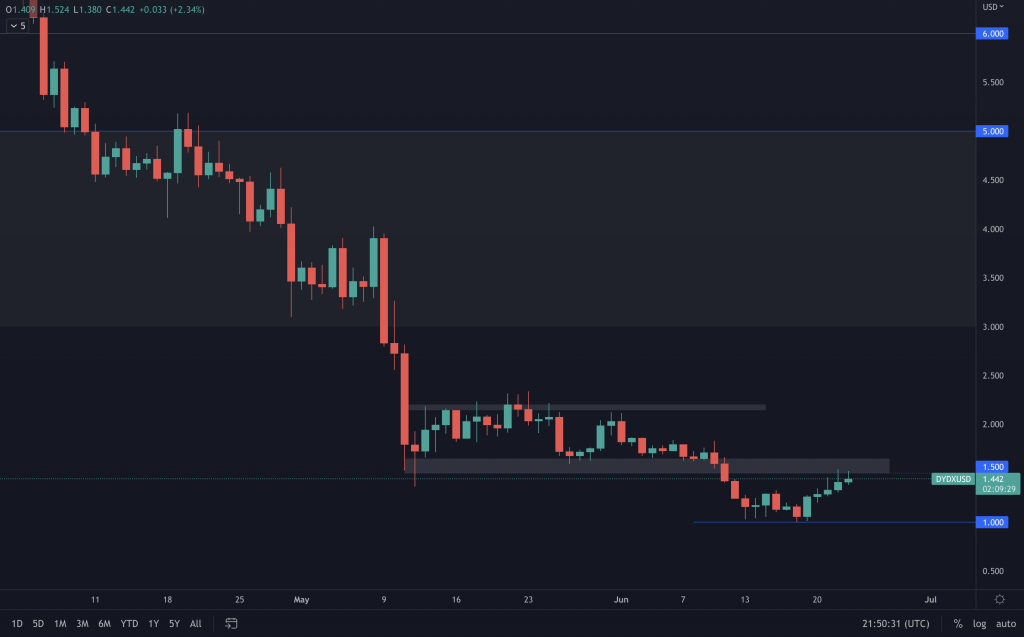
After last week's visit to $1, dYdX pushed up from the psychological $1 level and came up to the resistance range that is around $1.50-$1.65. From here, we'll be looking out to see whether dYdX creates a higher low to confirm a change in daily market structure and whether it can reclaim $1.65. At the moment, there is no indication of rejection from resistance with dYdX moving up on a supporting trendline on the lower timeframe.
Recommended from Cryptonary


