Save 23% ($351) & Get a Free 1-1 Call with our Team ⏰ : 0d 2h 59m 44s
Disclaimer: Not financial nor investment advice. Any capital-related decisions you make are your entire responsibility and yours only.
Video Analysis
Whilst the Funding Rate has turned negative, it's not at a rate or any period of any significance that suggests an incoming short squeeze. But what we can take from this chart is that as Bitcoin's price has declined, the Open Interest has continued to increase. Along with the Funding Rate decreasing to the point that it is negative (meaning shorts are currently paying longs), it points to us seeing a build-up of short positions.
Total Market Cap
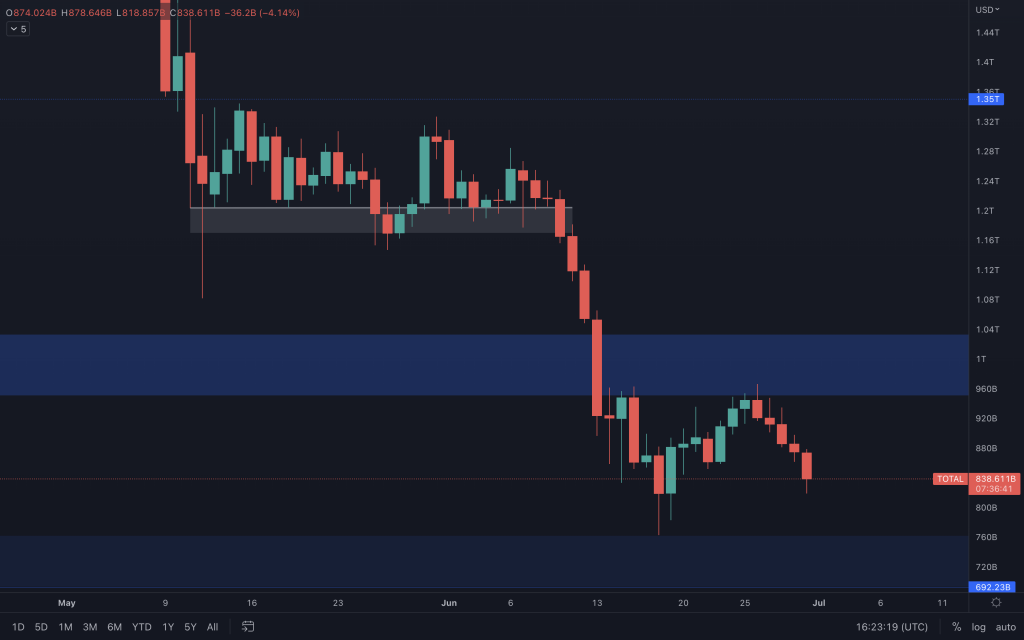
We're now on the last day of the monthly candle, where it's fair to expect to see increased volatility, especially when we consider that the majors are trading around quite significant levels. With the Total Market Cap failing to rotate the $1T level from resistance into support, we are seeing it head towards the bottom of its range, with support coming in around $700B-$750B.
Altcoins Market Cap
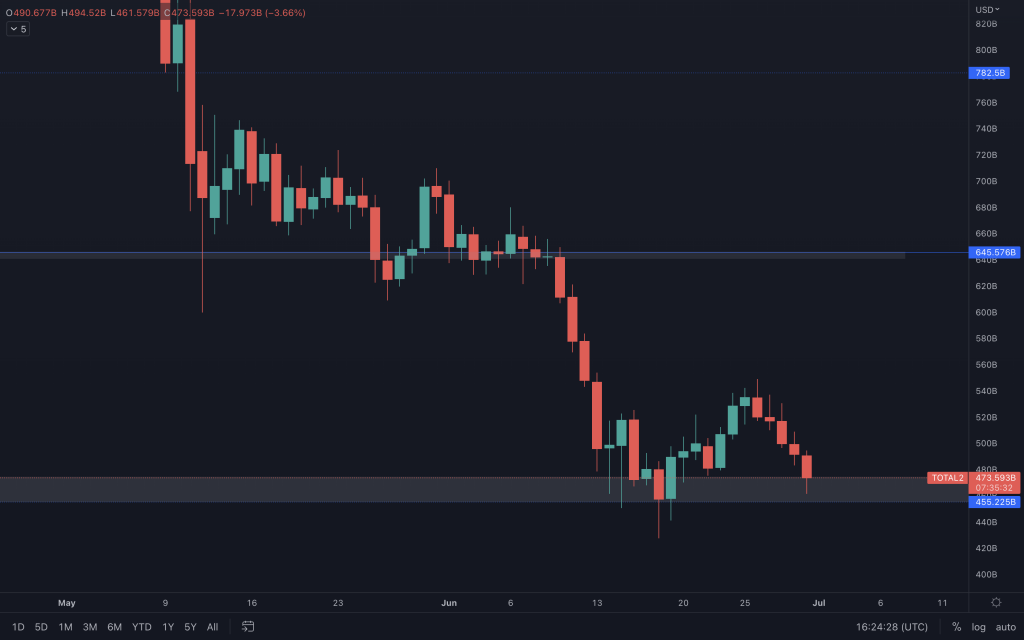
The Altcoins Market Cap is at support, so naturally, we'll be looking out for an indication of strength. As it's only tested support, there's nothing to highlight unless the level is lost. The monthly closure is tonight, and closing below $475B wouldn't look too great.
Bitcoin
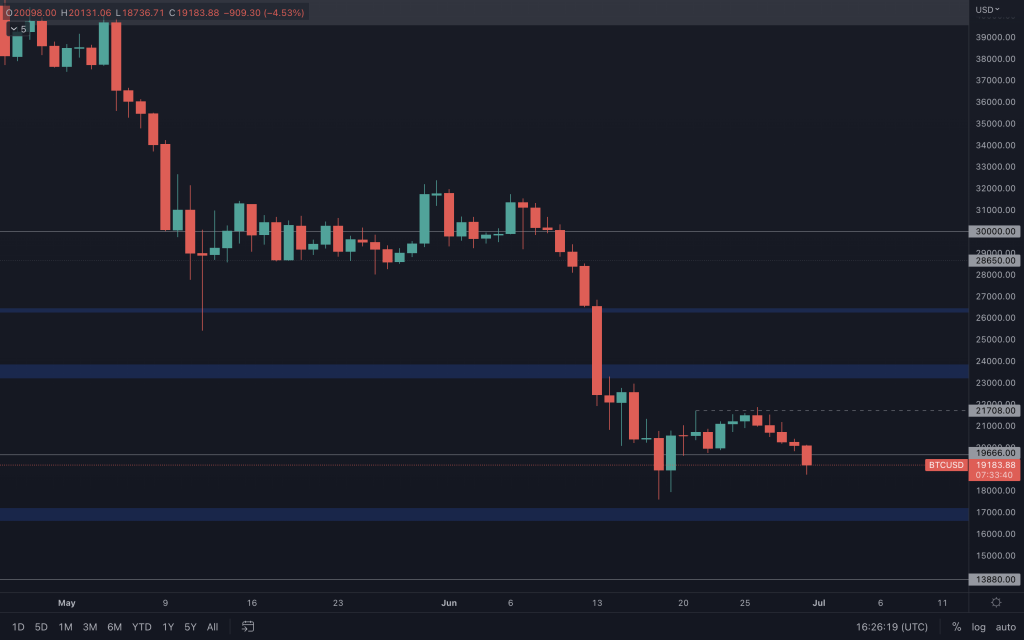
After failing to get a closure above $21,700 to confirm a daily bullish structure, which would have offered BTC a chance to push up towards $23,000, Bitcoin's price declined and is currently trading below the $20,000 level we need to see it hold by the monthly close. Of course, we expect heightened volatility for the next couple of days as we transition into a new month and new quarter, so it's fair to say that bulls and bears will be fighting over this 2017 all-time high until the monthly candle closes. A daily closure below $19,666* wouldn't look too great for Bitcoin and leaves $17,000 open for a revisit. What it means from a monthly standpoint we'll address in our monthly digest tomorrow. Even though the charts are clearly bearish, a monthly closure above $20,000 would, at least, leave a possibility of relief as we head into the new month. Bitcoin certainly has its work cut out, and it's improbable that the market would turn around from here, especially when we take into consideration the Fed continuing with QT, the war in Ukraine, and what is going to be close to a 40% drop in Bitcoin's price in a month. *Different exchanges have different prices for Bitcoin's 2017 all-time high, so you'll want to ensure that your charts match the exchange they are based on.
Ether
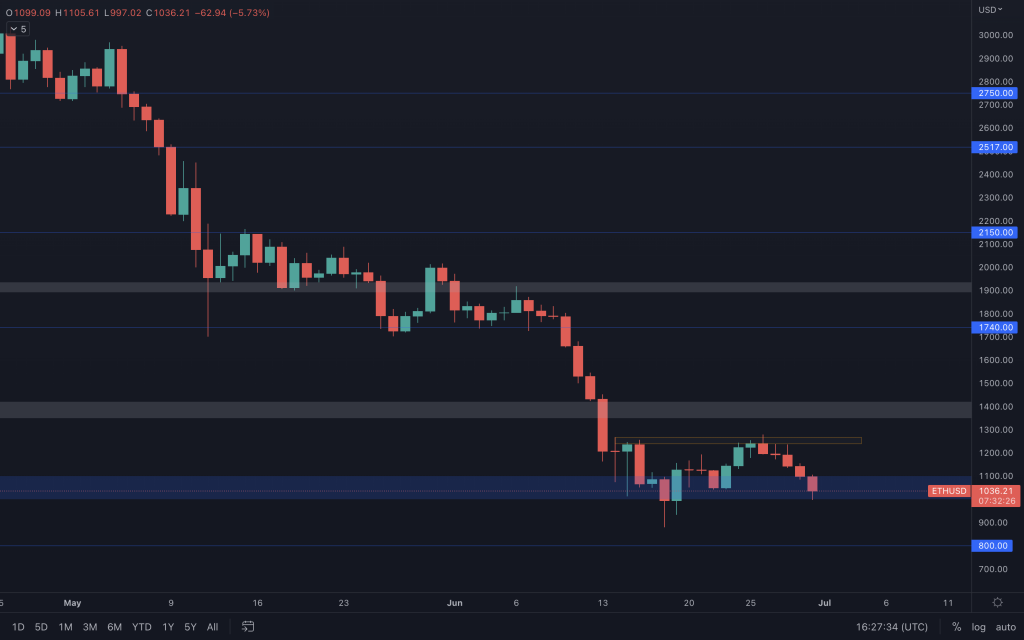
The daily bullish structure has been invalidated, and $1,000 is now the line in the sand. If Ether closes below that, $800 will come into play. If not, expect further ranging for now.
Polkadot
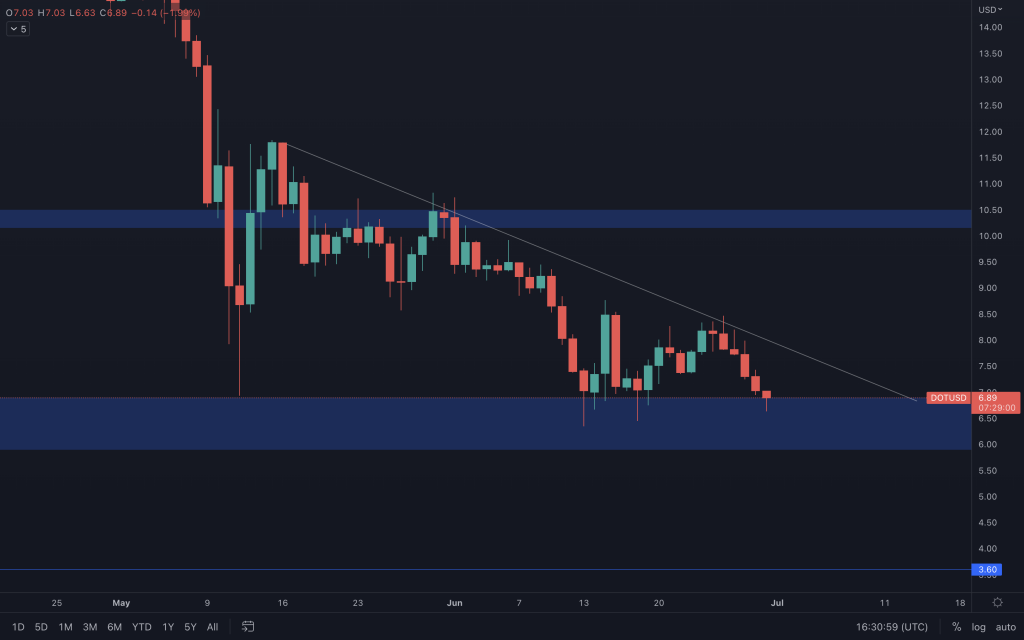
DOT's failed to make any meaningful progress in turning its bearishness around. Consistent lower highs lead us to watch whether $6 can hold. A closure below that and $3.60 is its next support.
Synthetix
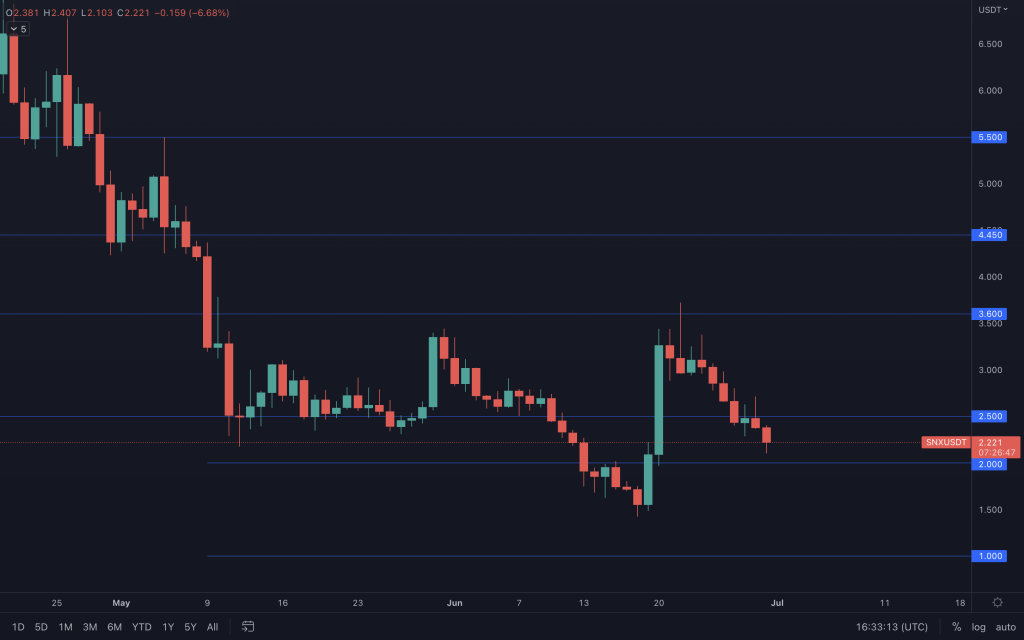
As we mentioned in Discord, with SNX failing to reclaim $2.50, it's now headed back towards the lows, and support comes in at the psychological $2.
THORChain
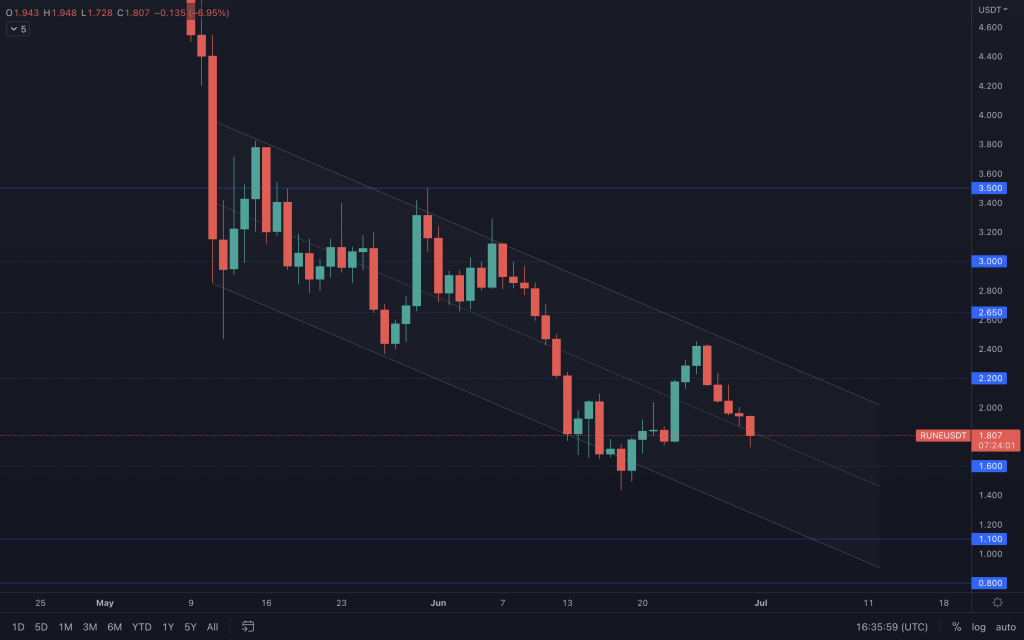
RUNE is simply following the channel. We can see how the volume has steadily increased since mainnet was announced. But, it hasn't yet led to any significant development concerning price action, apart from moving from the bottom to the top of the channel. Until there's a breakout, expect it to chop within this range.
Solana
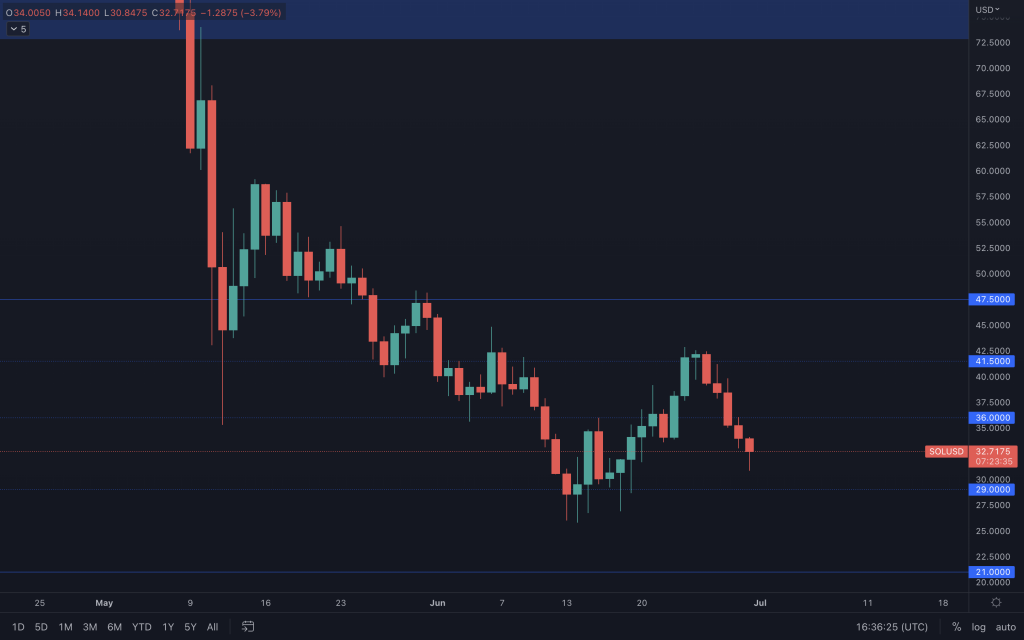
SOL's bullish daily market structure has been broken with a move below the previous higher low. Right now, support comes in at $29. But remember, that's an intermediate level. $21 is the higher timeframe support.
Serum
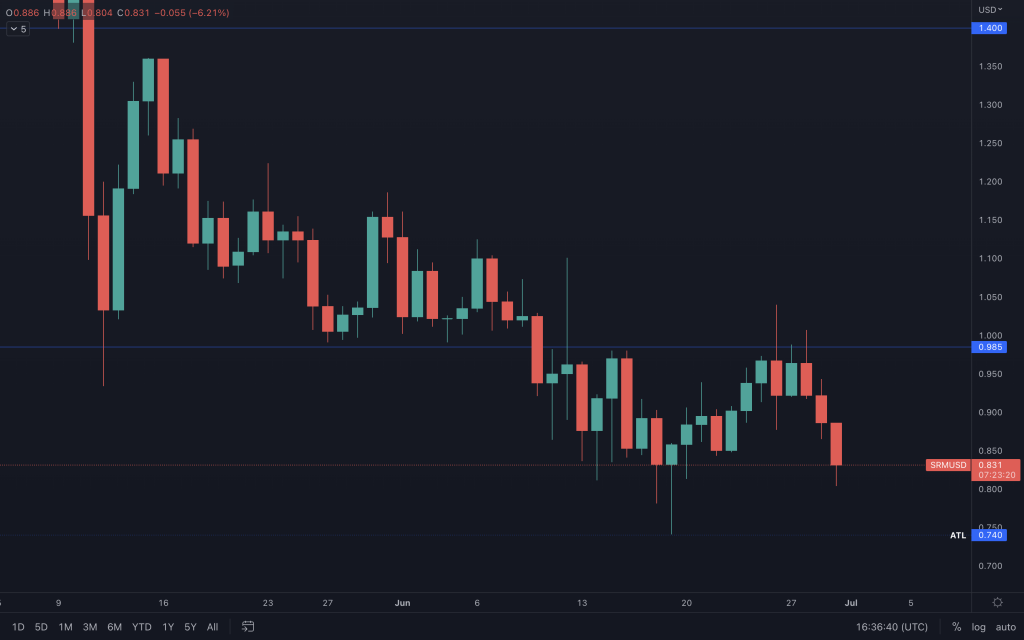
There's been no let-up for SRM as it was rejected from resistance at $1, and it's now heading for the all-time low at $0.74. A closure below that, and our sights would be on $0.50 next.
FTT
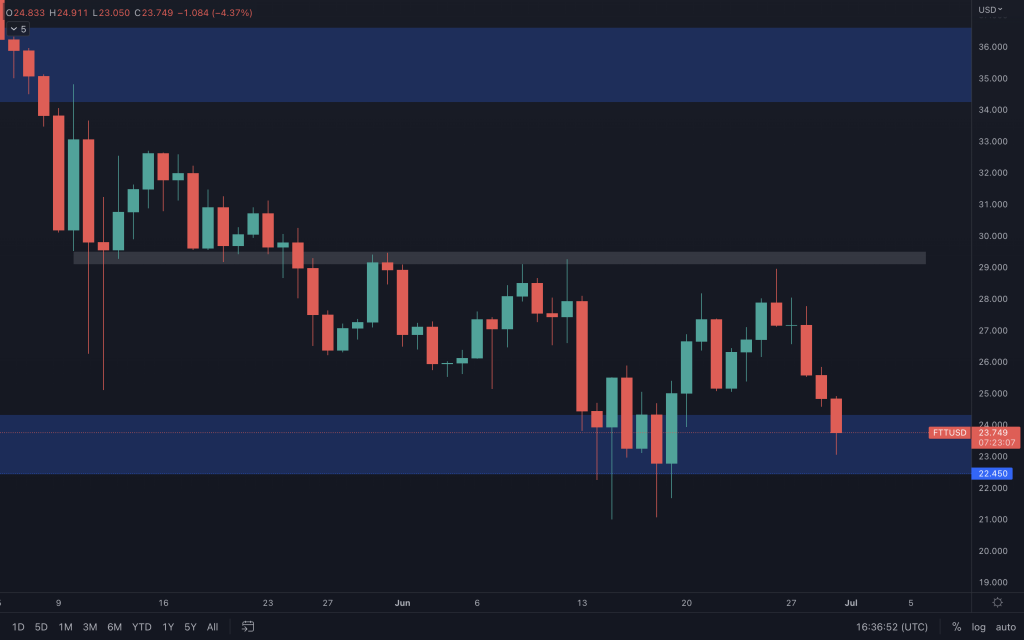
Multiple rejections from $29 over the past month, and FTT finds itself, once again, at the bottom of its range. It needs to hold on to $22.45 by daily closures. Otherwise, there's the possibility of a 50% drop.
MINA
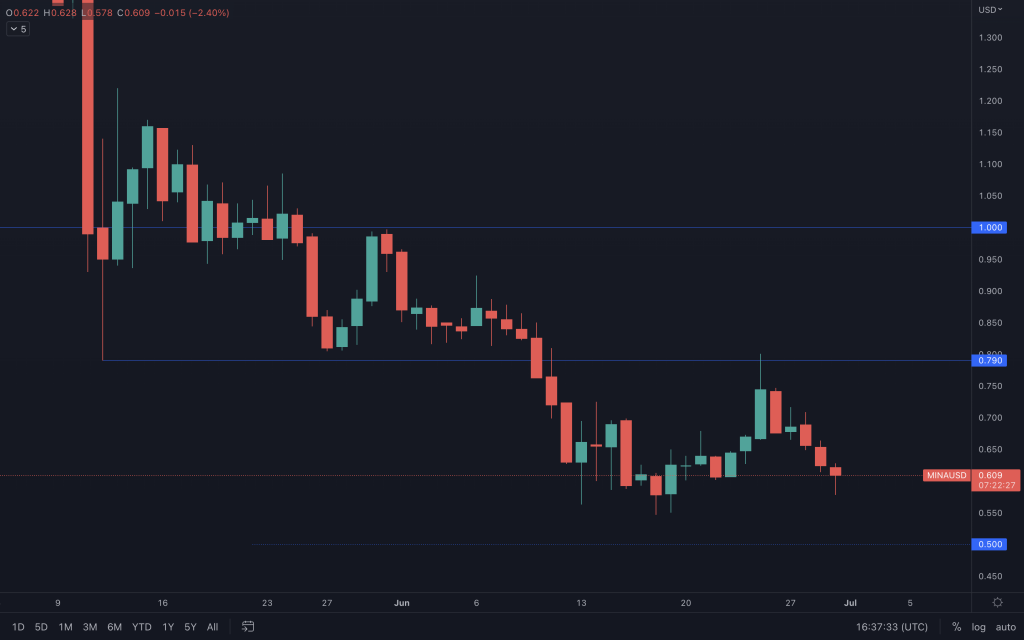
MINA rejected its $0.80 resistance and is now making its way to $0.50, where we will see its reaction. The price has never been this low, so we can only use psychological levels. Below $0.50, we have reduced our increments to $0.10.
dYdX
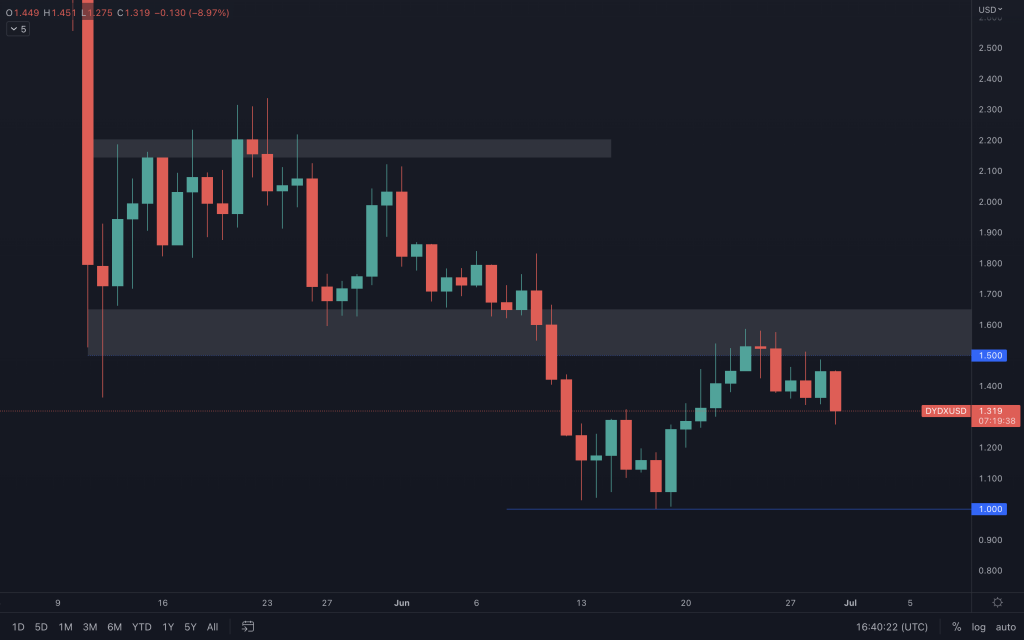
We had $1.50 (psychological) and $1.60 (technical) marked out on our chart, and we can see dYdX's reaction around this level. It is now trading at an intermediate support level ($1.30). A daily closure below this should see it continuing to the bottom of its range. Of course, it may reverse, but bulls will undoubtedly need to show up before the monthly candle closure.
Recommended from Cryptonary


