Save 23% ($351) & Get a Free 1-1 Call with our Team ⏰ : 0d 2h 59m 43s
Disclaimer: Not financial nor investment advice. Any capital-related decisions you make are your entire responsibility and yours only.
Video Analysis
With the next FOMC meetings coming up on the 27th and 28th of July, there is a little bit of breathing room for the market before the volatility very likely makes an appearance once more.The Federal Reserve published the minutes for June's meeting yesterday, and they stated that 'After the release of the higher-than-expected inflation data, policy-sensitive rates pointed instead to a considerable probability of 75 basis point moves at both the June and July meetings.'
Total Market Cap
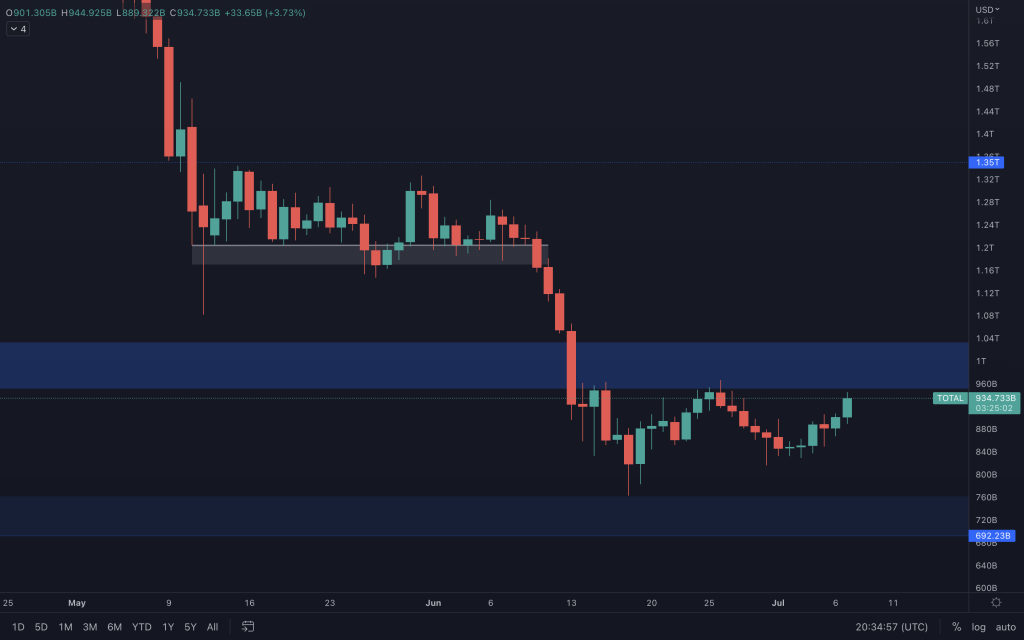
The Total Market Cap is knocking on the door of the lower level of its resistance range. Funnily enough, so is SPX, and we know about the correlation there. So this is where we'll look for signs of weakness in the chart. For daily movements, this is the third time the TMC has visited this as resistance. So it now needs to break above it ($965B) to see a continuation of the positive move we have seen over the last five days, leading it toward $1.03T.
Altcoins Market Cap
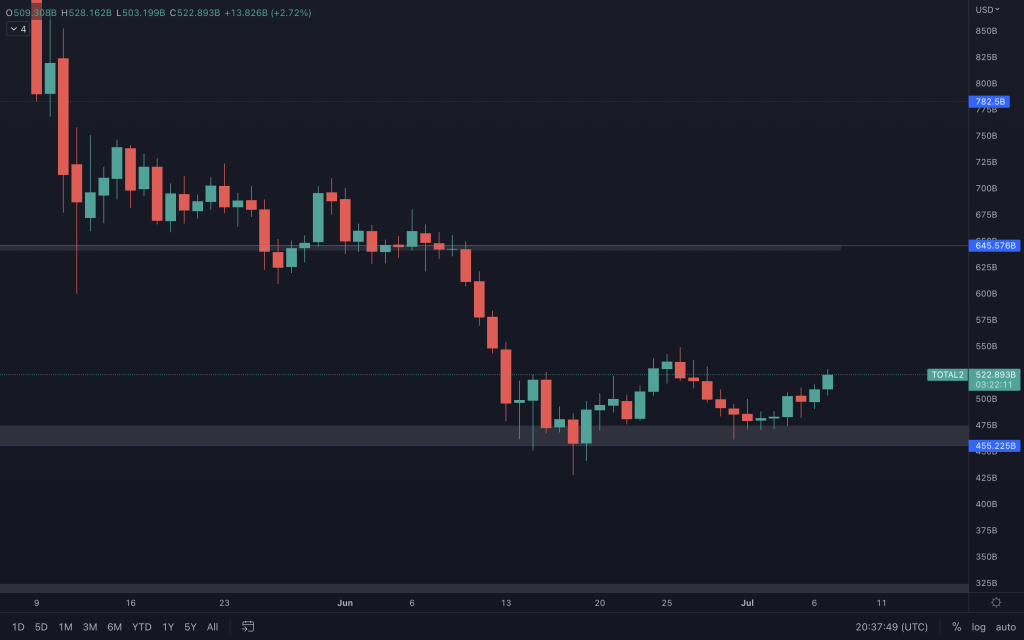
A very similar situation is reflected in the altcoin market cap. But, as we can see, it does have a lot more overhead room than the Total Market Cap. At the moment, though, Bitcoin's dominance is stalling at its mid-range point, so we'll be watching that for a clear direction from here. If it continues down, we'll start to see altcoins outperforming BTC.
Bitcoin
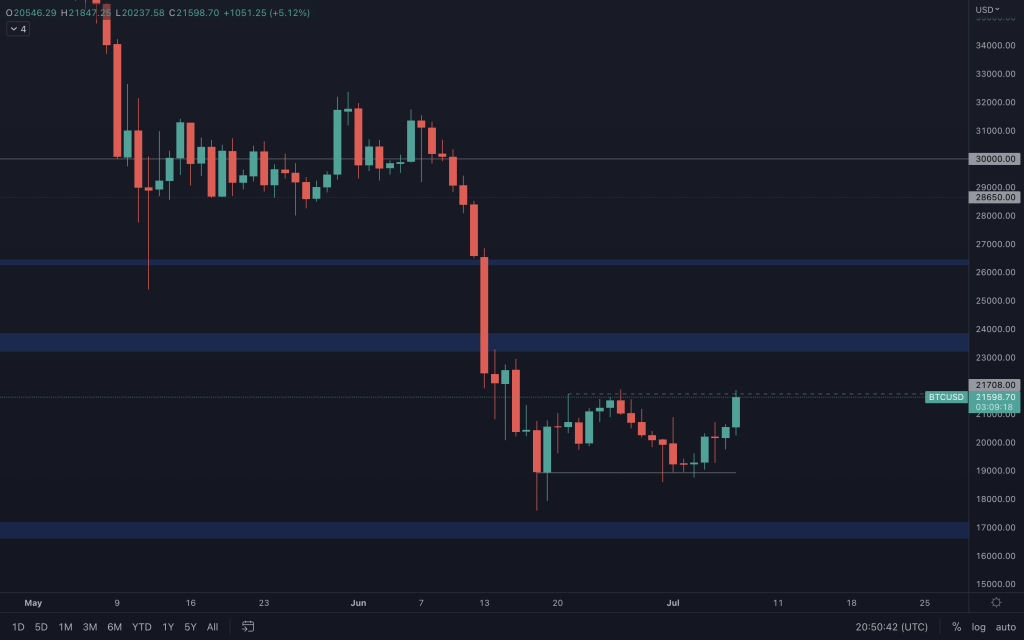
Bitcoin's moved nicely today, and now we are at the point of seeing whether it can close above $21,700 for a move towards $23,000 or simply continue ranging. There is momentum behind the move, but it would need to be confirmed by a candle closure.
As we mentioned yesterday in our daily analysis, a closure above $20,500 would allow BTC to move up towards $21,700, and we've seen that play out today.
Ether
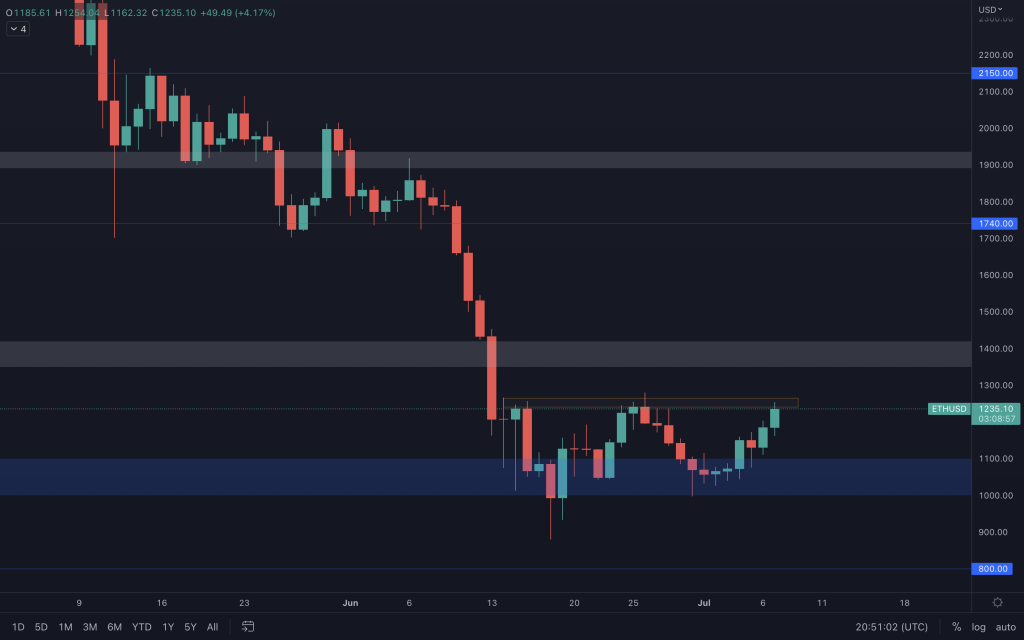
As we mentioned yesterday, Ether has reached its local resistance ($1,265). We need to see whether it can close above it, offering it a move to $1,400. Volume is supportive of this move, but we still need confirmations by a candle closure to be able to look at resistances beyond the current one.
Polkadot
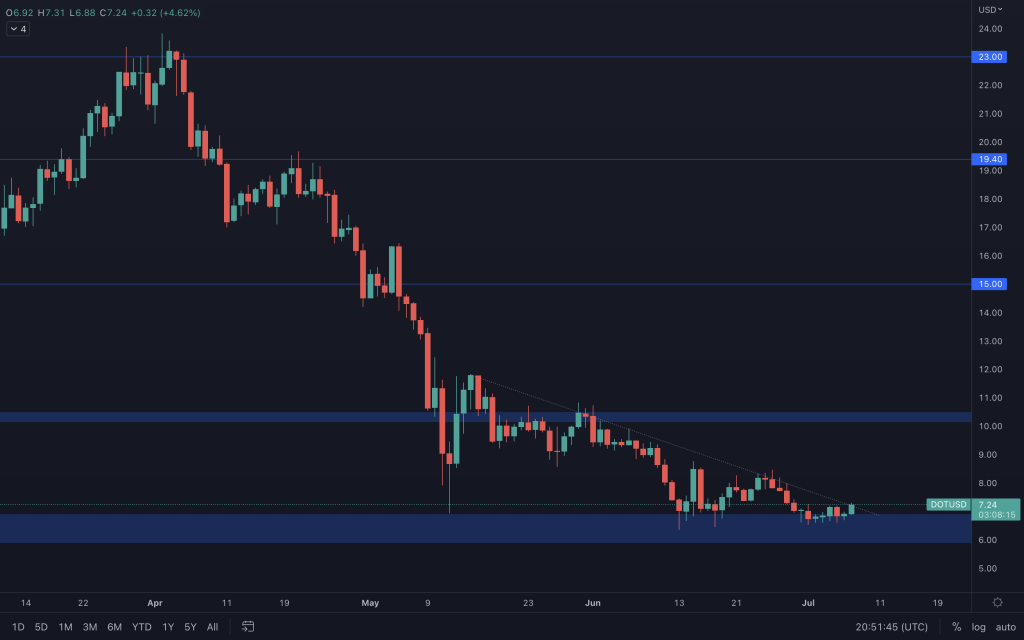
DOT continues to move sideways at support on relatively low volume. Yes, there's a counter trendline in play, so let's talk about some things to consider should one want to enter a trade on a break of the counter trendline and use this particular chart as an example. Naturally, the method applies to all altcoin charts.
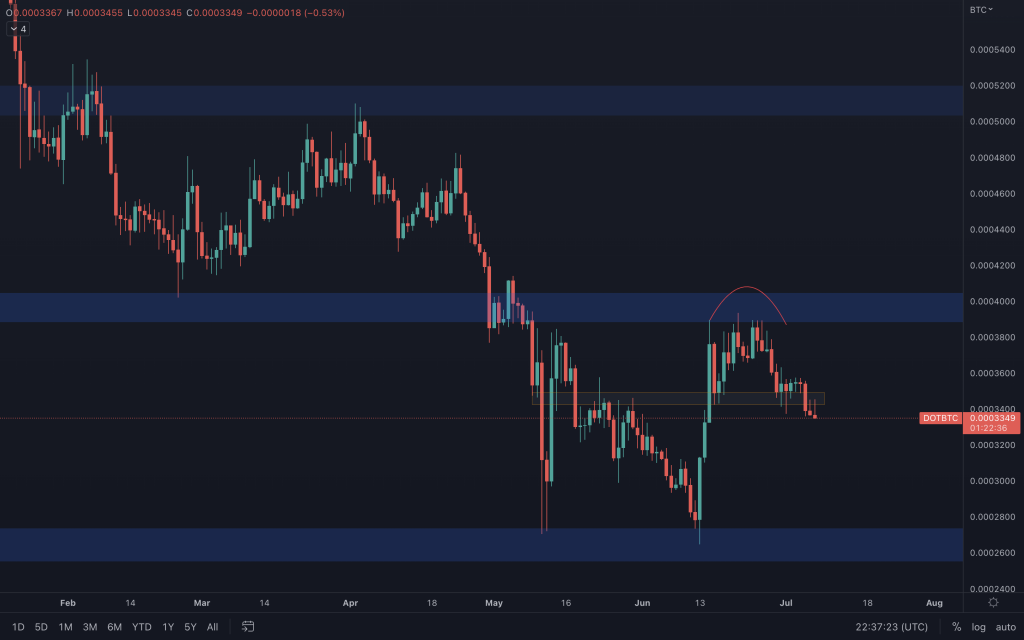
* Without a close above $21,700, Bitcoin is at resistance. * DOT/BTC has lost support. Without a reclaim of that old support, DOT is bearish against BTC. Therefore, if Bitcoin failed to convert $21,700 into support and were to decrease in price, with DOT looking weak against BTC, DOT would perform worse than Bitcoin in terms of USD value.
Now let's look at the opposite scenario.
If Bitcoin were to close above $21,700, DOT/USD breaks above its counter-trendline, and DOT/BTC reclaims its lost support simultaneously, that would mean that DOT becomes bullish against a bullish Bitcoin, giving you a more bullish move on the DOTUSD chart!
Although that may not become the case here, the potential is there. I just thought it was worth highlighting should you want to try and look for future opportunities to maximise your gains.
Naturally, a USD paired chart can be bullish on its own, and it's fine to trade those setups using the indicators you are familiar with. The above is just something to consider.
DOT/BTC for reference
Synthetix
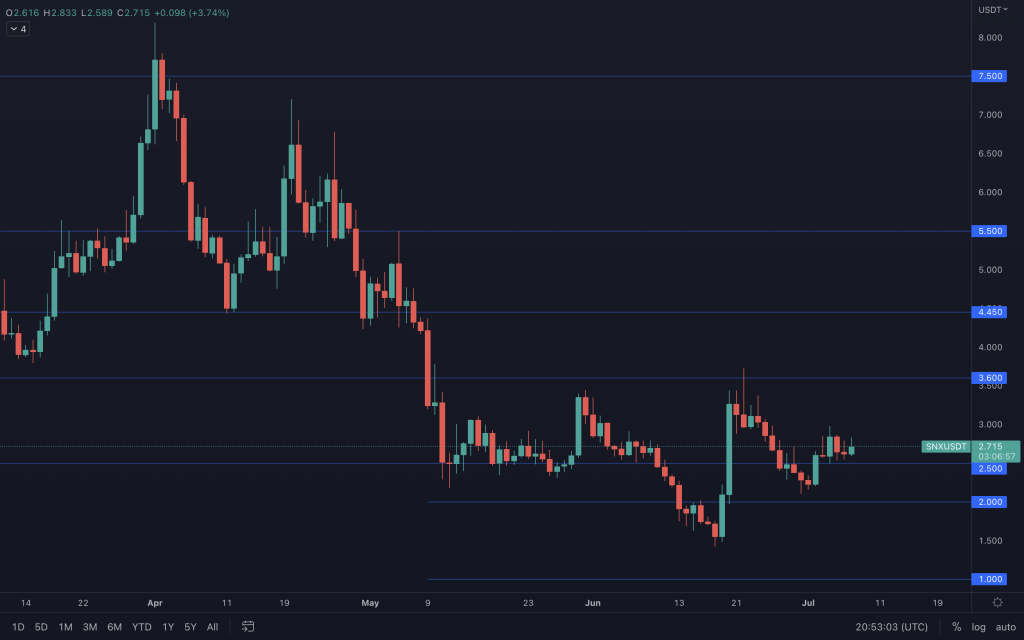
SNX is at a point of indecision as the market awaits Bitcoin's next move. It hasn't performed as well as Bitcoin due to the bearishness in the BTC paired chart (shown below). $2.50 is a significant level of support, and downside would only be confirmed upon losing it.
SNX/BTC
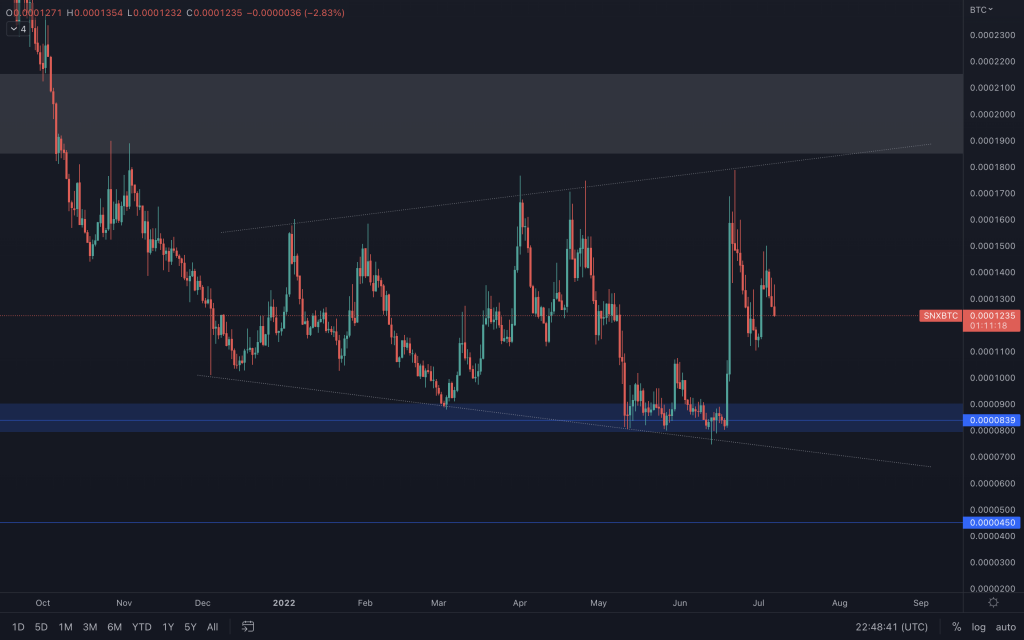
SNX/BTC is trading within a broadening wedge pattern, so whilst it is here, expect to continue seeing chop.
THORChain
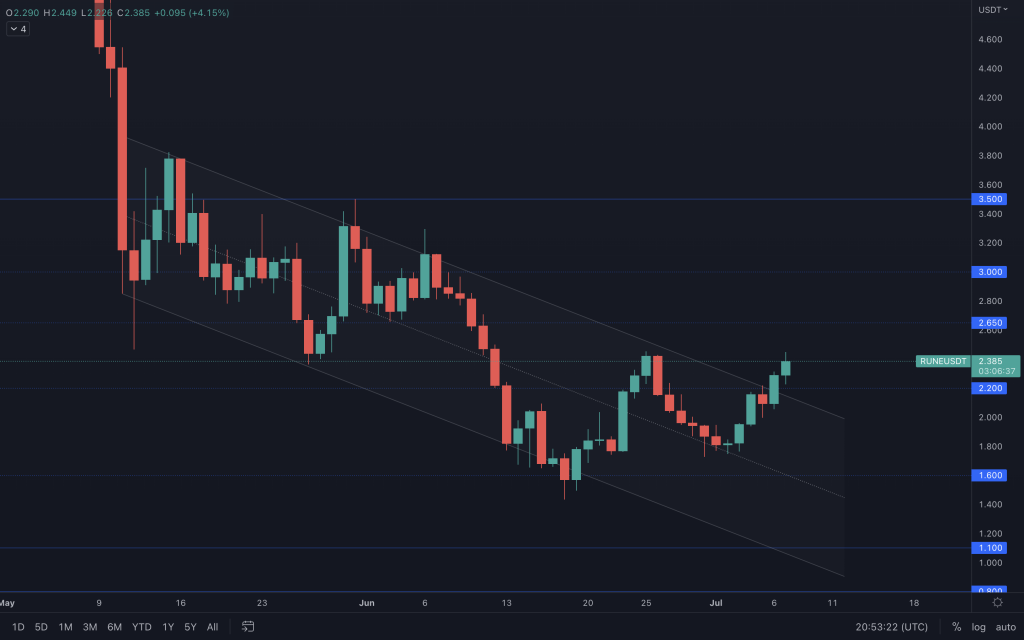
RUNE has broken out of the descending channel, reclaiming $2.20 in the process. $2.65 and $3 are the next resistances in sight.
RUNE/BTC
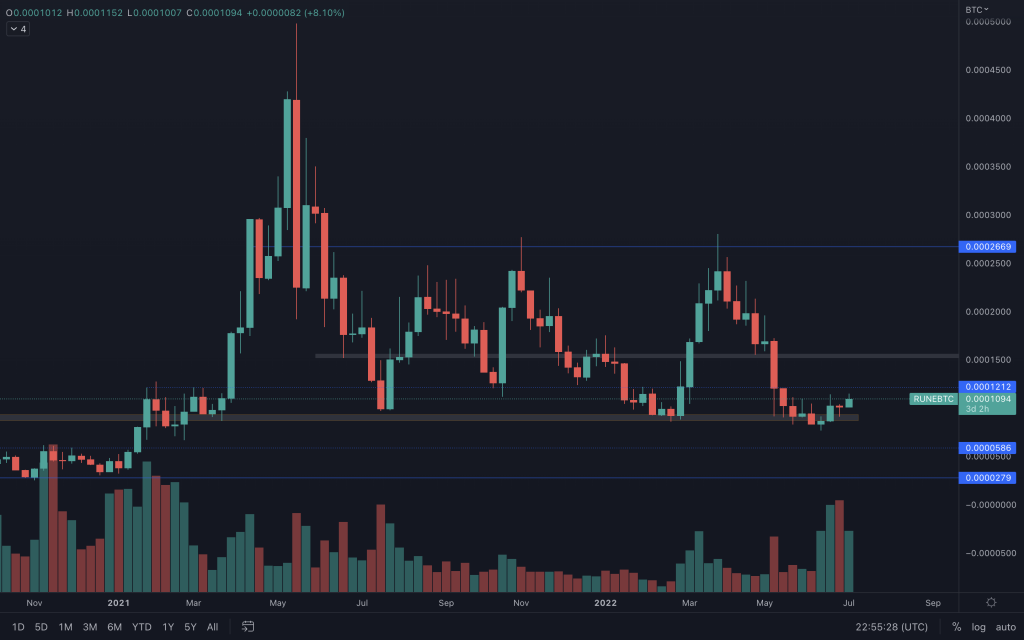 RUNE/BTC played with fire but eventually managed to hold on to a significant level. The next point we have our eyes on is 0.0001212, where we'll have to see if RUNE can turn that into support. The volume is there, but it needs to be sustained.
Solana
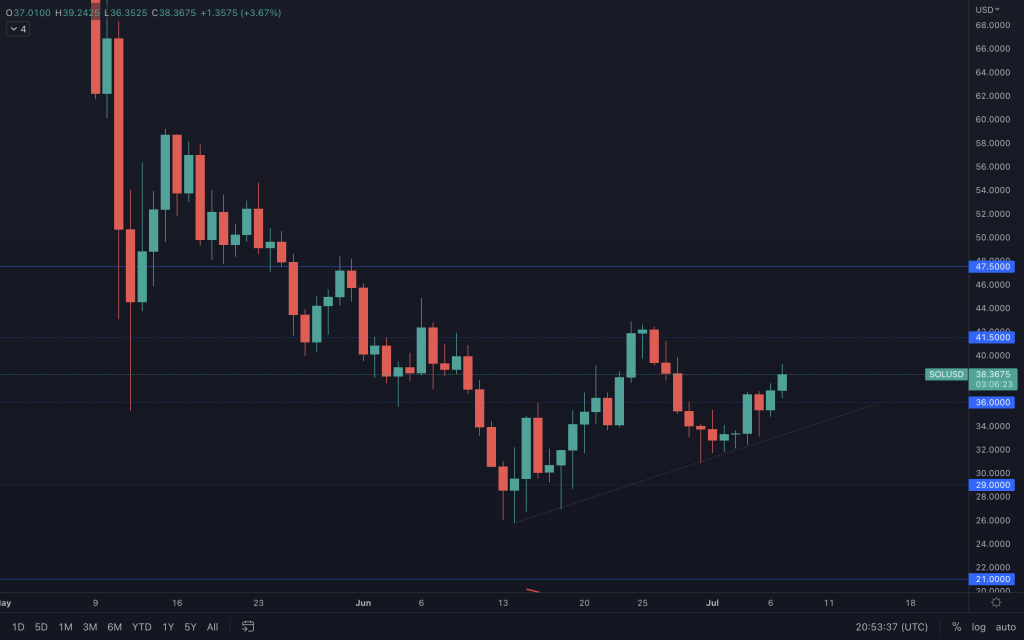
The daily volume remains somewhat unconvincing, but SOL's held the supporting trendline. Sure, you can take it level by level, but SOL wouldn't look good unless it reclaimed $47.50.
Serum
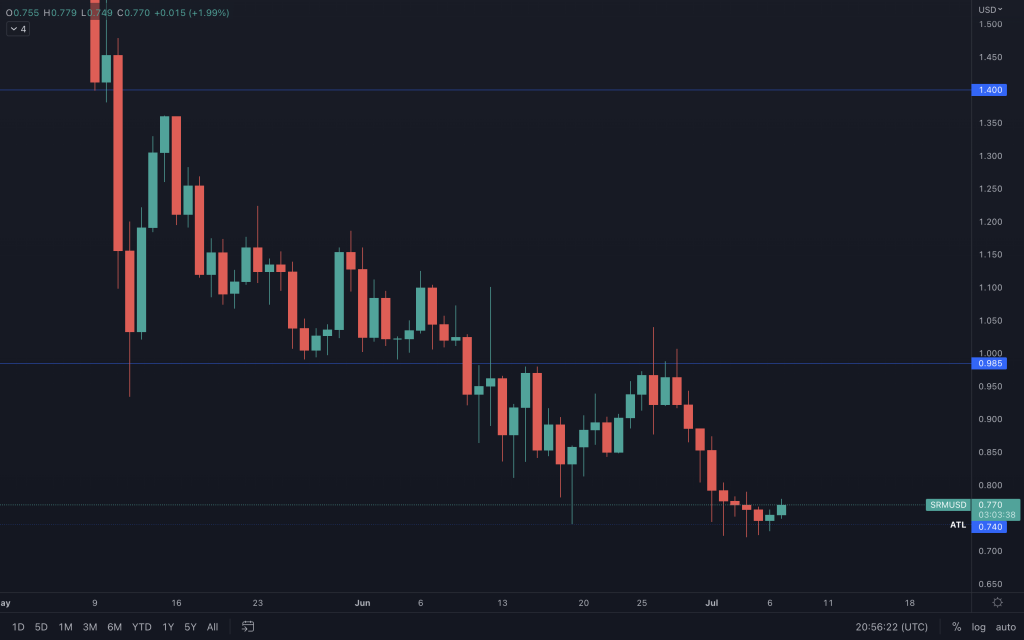
$0.74 is still holding as support, but buyers aren't stepping in. SRM/BTC has also formed a weekly lower high and is now close to its final support level. If they hold, great. But we want to see a more unambiguous indication of a bottom or a reclamation of $1.
FTT
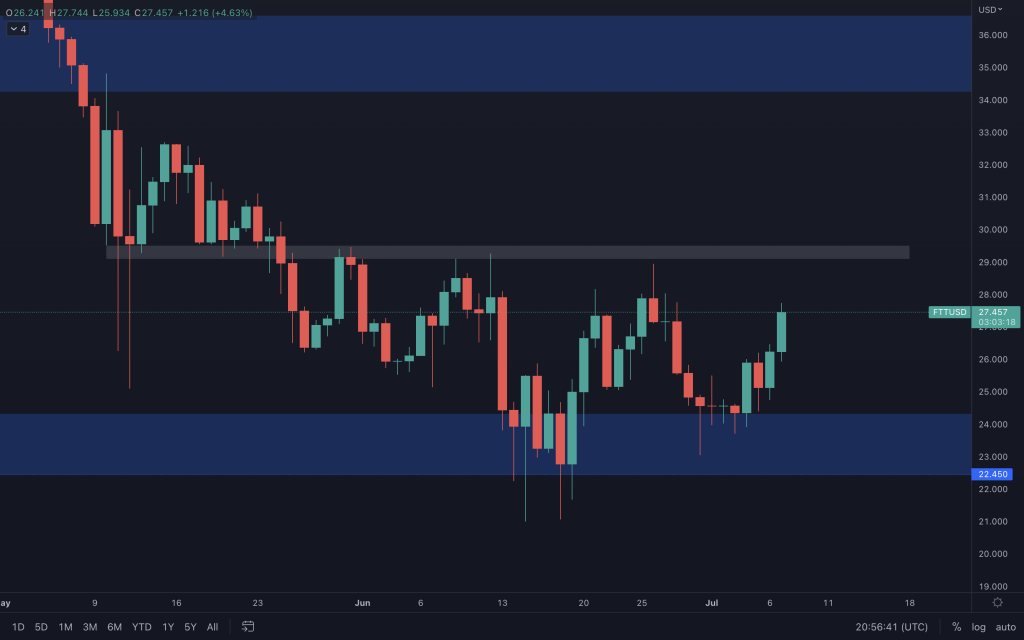
FTT continues to bounce between $22.45 and $29. A break outside this range should help identify the next more significant move. Until then, it's quite a reliable range.
MINA
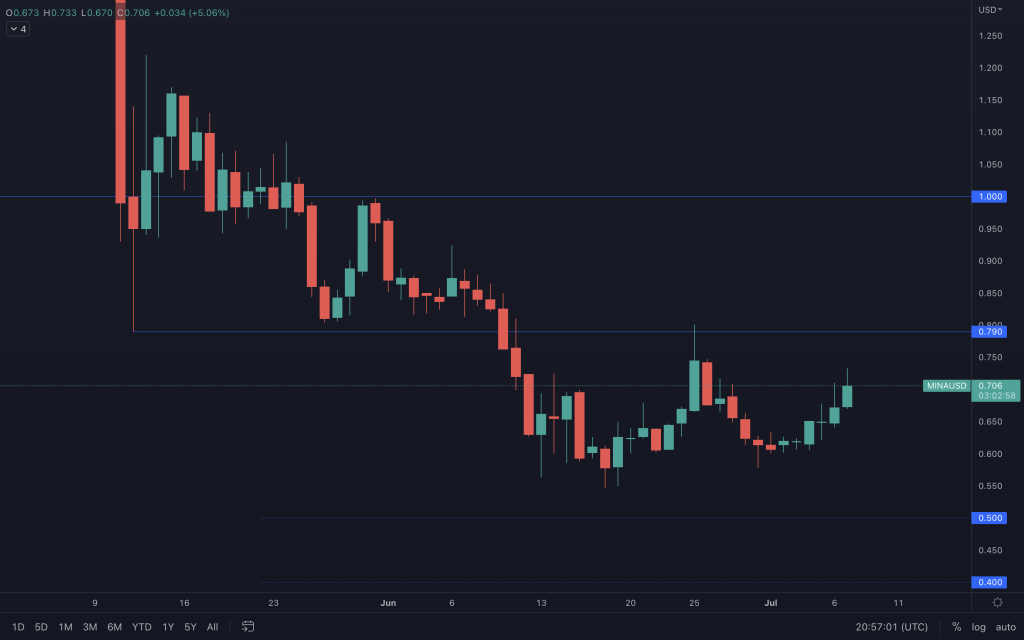
MINA's making its way towards $0.80. If it achieves a closure above there, we'd be looking at $1. Of course, as with all of the assets mentioned here, we'd be monitoring Bitcoin closely around crucial levels, as it has an effect across the market.
dYdX
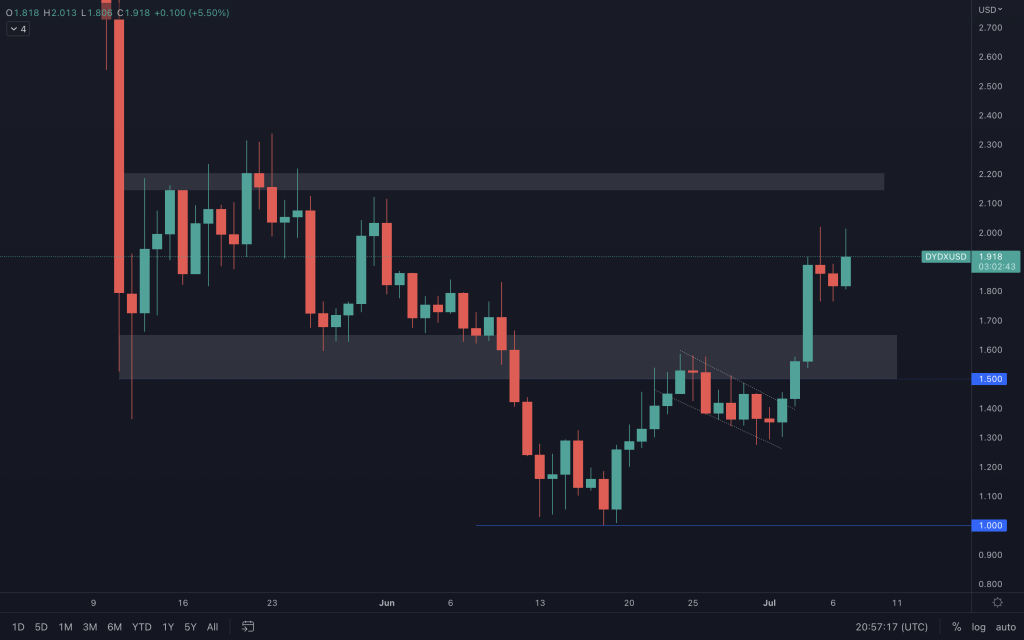
Not too much to say here. $2.20 is within sight, and if achieved, we'll see the price reaction there. For now, it's just in the middle of its range ($1.50-$2.20).
Recommended from Cryptonary


