Save 23% ($351) & Get a Free 1-1 Call with our Team ⏰ : 0d 2h 59m 44s
Disclaimer: Not financial nor investment advice. Any capital-related decisions you make are your entire responsibility and yours only.
Video Analysis
Total Market Cap
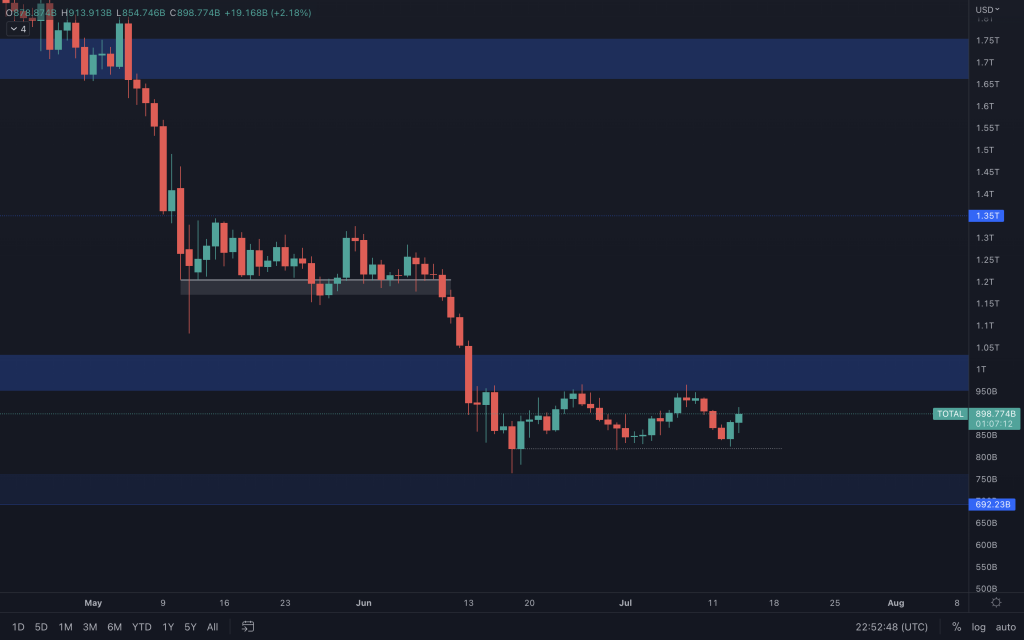
Yesterday's closure created a bullish engulfing candle from a daily support level that looks set to see the Total Market Cap moving towards $950B. It is still rangebound ($820B - $950B), with a clear break from the range needed to identify the market's next direction. With the close proximity of $1T overhead, we'll be using this as the resistance level to break by a weekly closure before we could even expect to see a relief of any significance. A daily closure below $820B, and we'd be looking towards $700B.
Bitcoin
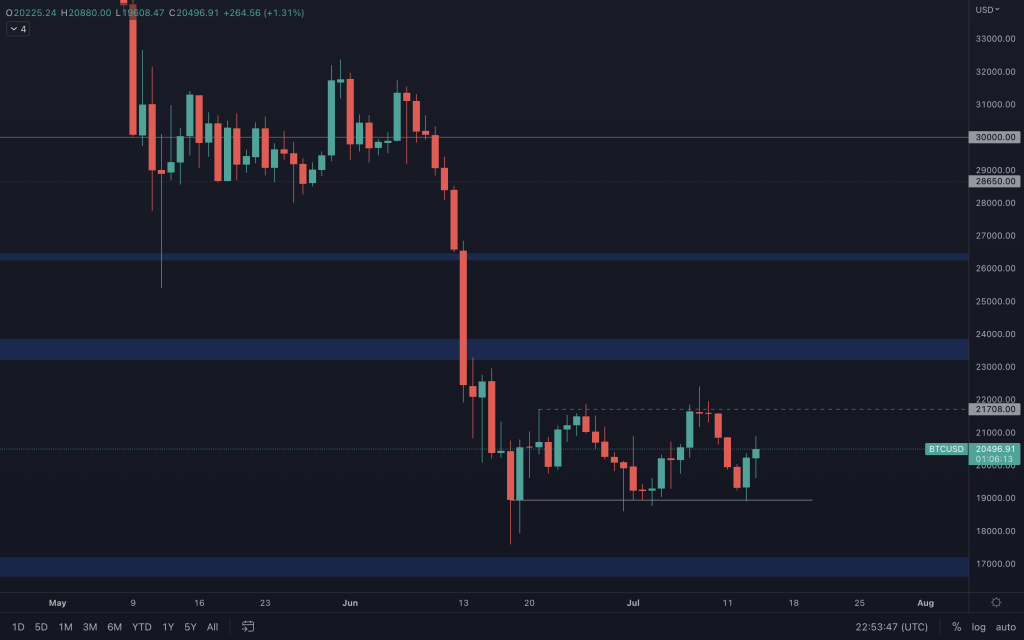
Bitcoin (and Ether) also respect the ranges they have now been in for over a month. After a retest of support and a bullish engulfing candle closure yesterday, Bitcoin retraced early in the day before pushing up. Resistance still comes in at $21,700. A closure above it will bring in $23,000, and any closure below $18,900 can lead Bitcoin towards $17,000.
Ether
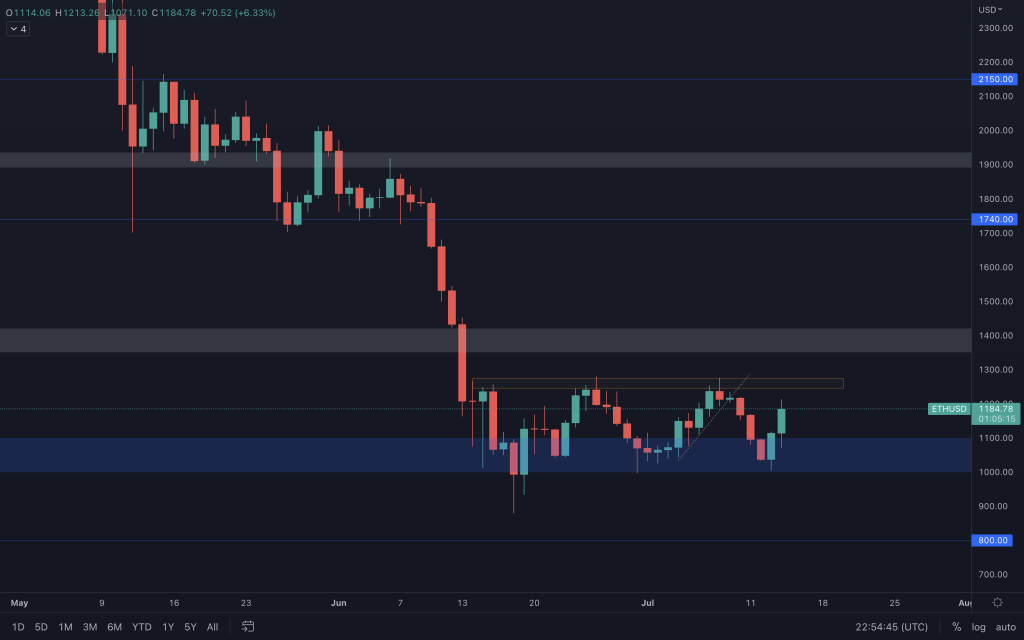
A bullish closure on ETH and a bullish closure on ETH/BTC have resulted in a better performance from Ether today. Resistance lies around $1,250, with a closure above $1,275 needed to signal that $1,400 would be next. But, the fact remains that US data still isn't rosy. So, even when the market moves up, we also have our downside criteria. Right now, that criteria is if we see a loss of $1,000, we'll be looking at $800 next.
Polkadot
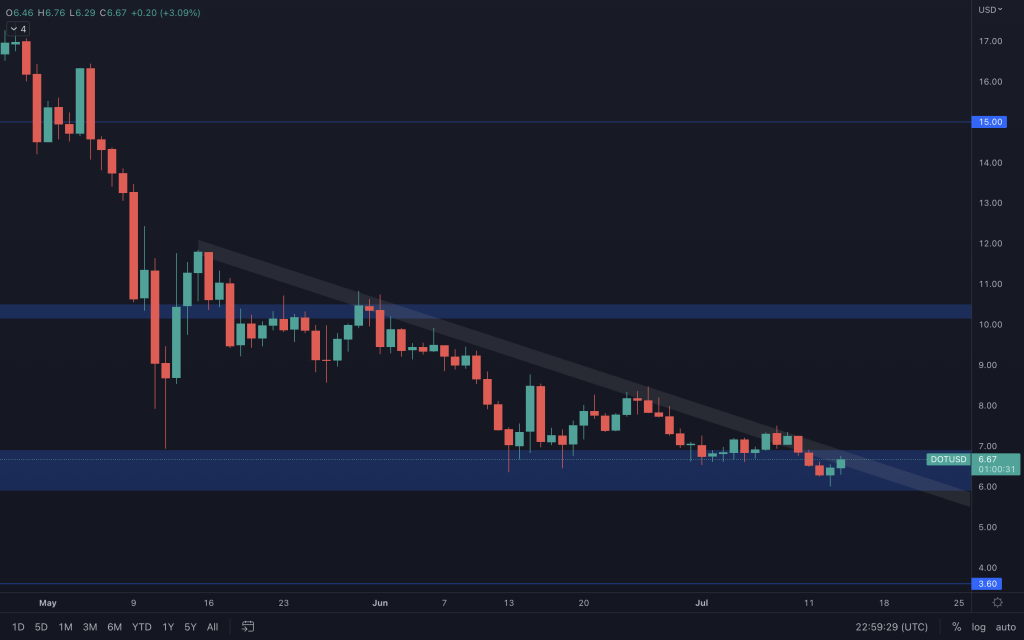
DOT may have two days of green candles, but nothing has changed to alter its situation. The down-trending market structure is very much intact, and it's still trading below the counter trendline with relatively low volume. Unless something changes regarding the aforementioned, DOT isn't looking too bullish. But a closure above the counter trendline, although risky given that indicators are void of strength, would offer a potential long trade.
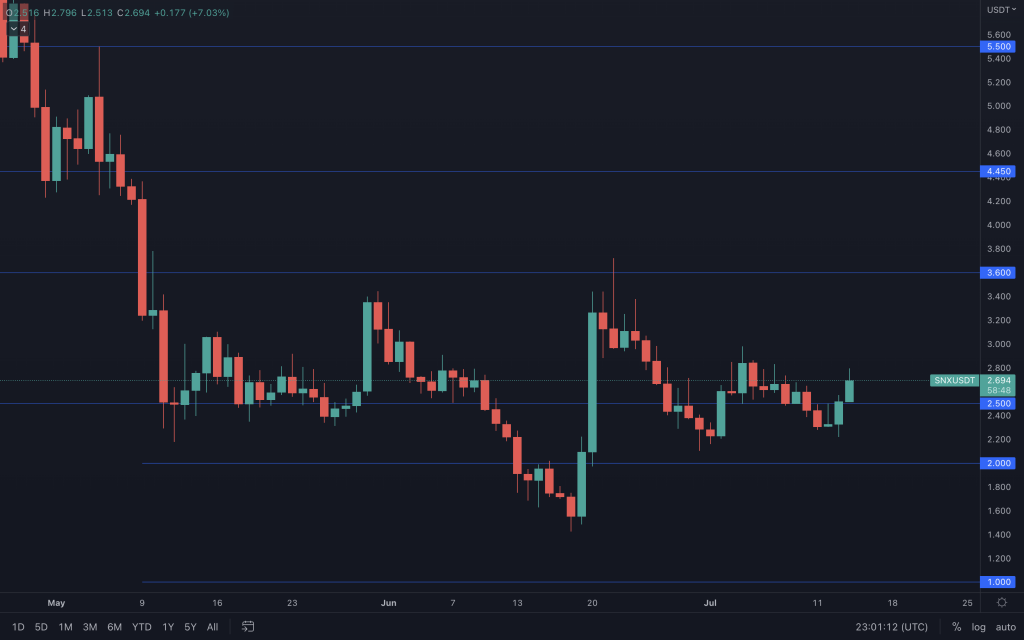
Synthetix
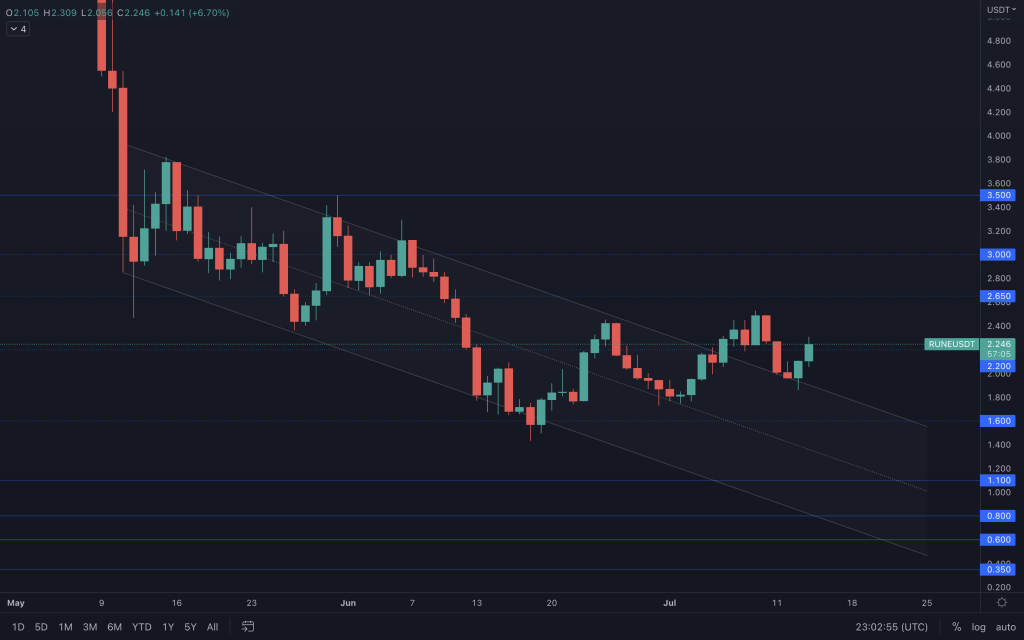
THORChain
Solana
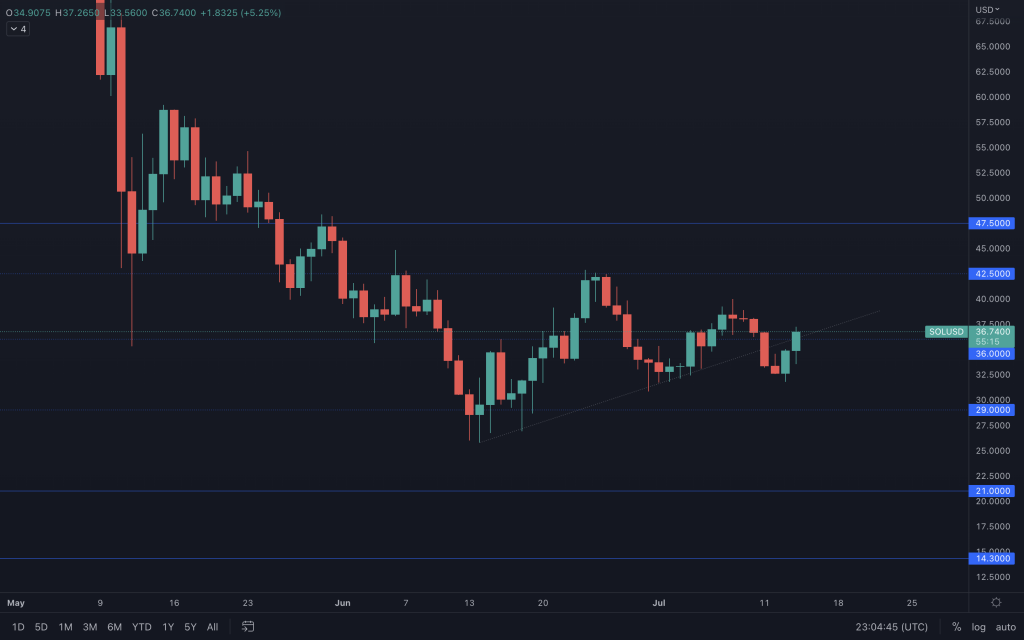
Even though it looked weaker after creating a lower high to accompany the lower low, we mentioned the potential of a bullish engulfing candle as we approached yesterday's close and SOL/BTC being at support. The first challenge that SOL has to overcome is reclaiming the trendline. Right now, it is only retesting it as resistance.
Serum
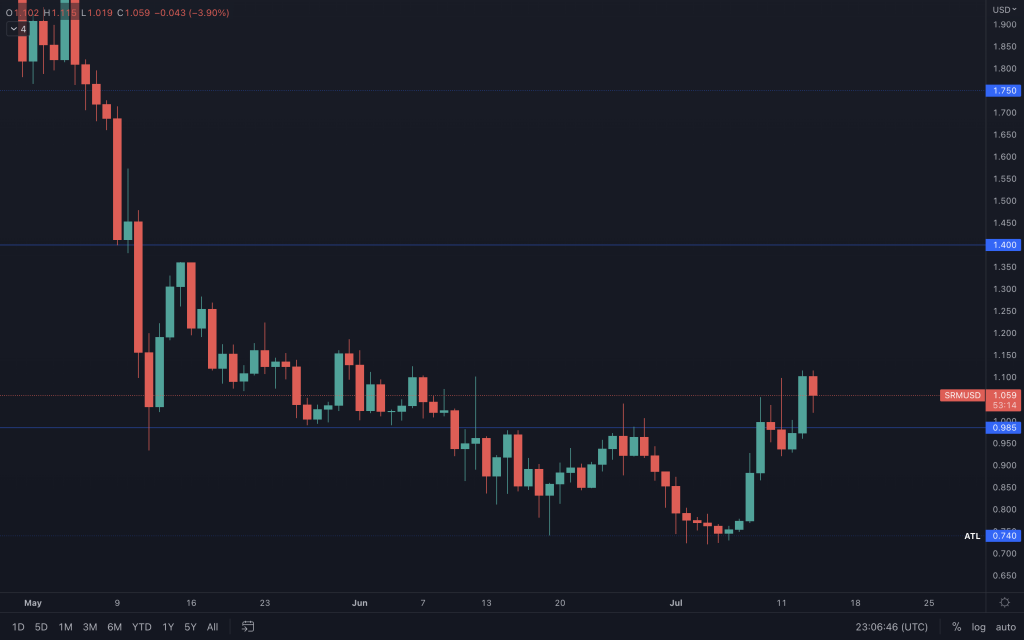
SRM has seen high volume and some substantial price action of late. As long as it can hold on to $1, $1.40 remains on the cards.
FTT
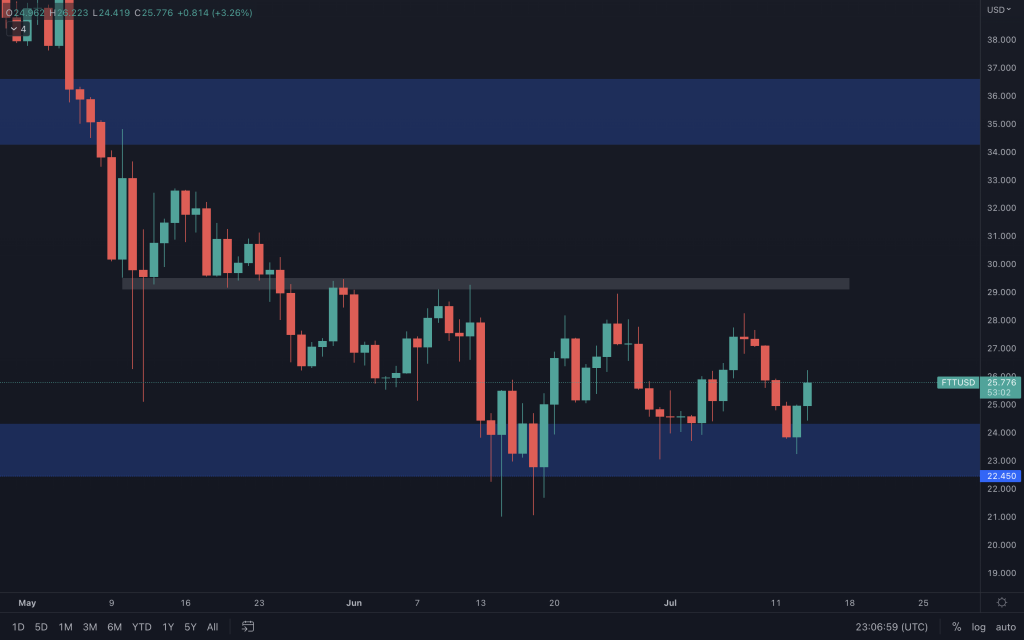
FTT is another asset that has been moving in a relatively small trading range, but it has been creating subtle lower highs, suggesting that momentum is still with the bears. Either way, we need to see it reclaim $29 or close below $22.45. FTT/BTC is still in bullish territory but has struggled to make any advance since getting there over three weeks ago. So we'll continue to monitor that chart too.
MINA
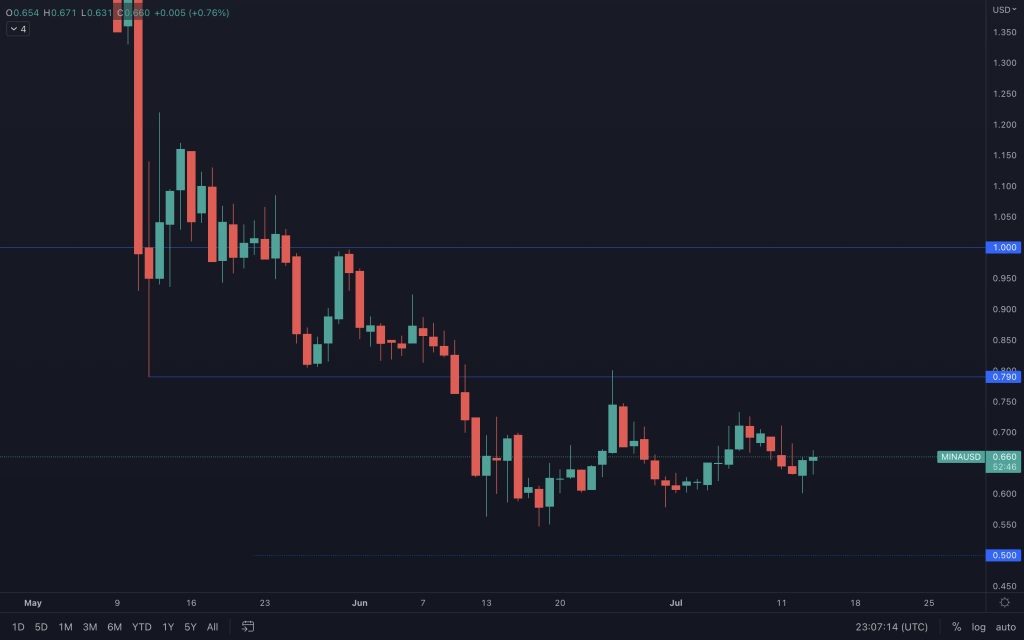
MINA is another one that is neither here nor there. Its volume is considerably low, and it's simply in the middle of a price range. It's failed to capitalise on yesterday's bullish candle, which further adds to the bearish argument.
DYDX
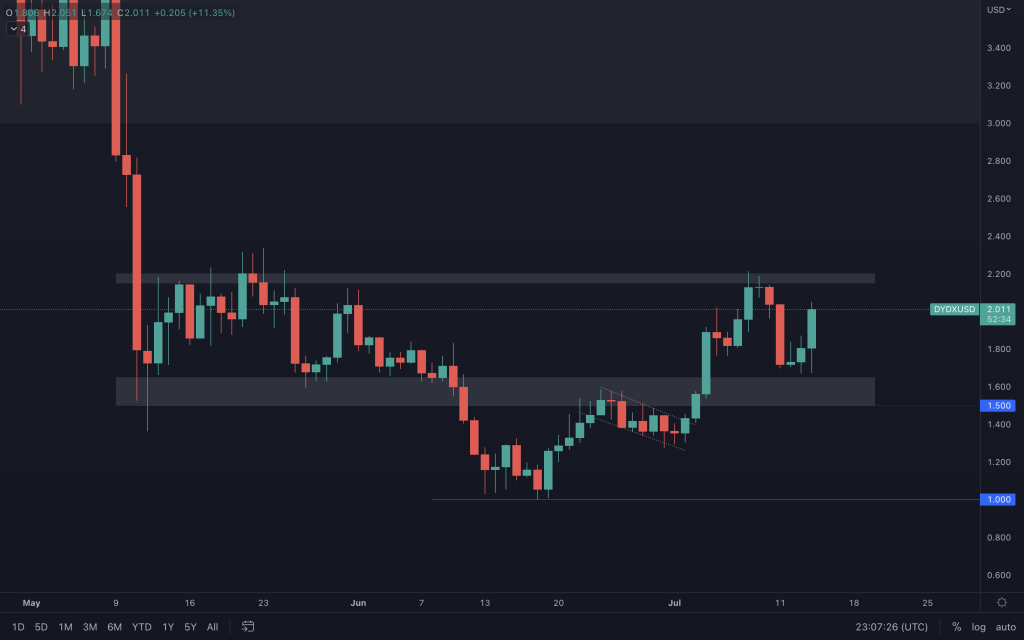
We again see positive price action, this time after dYdX tested the bottom of its range. A break above $2.20 is needed to see it continue with its bullish momentum.
Recommended from Cryptonary


