Log in

Save 23% ($351) & Get a Free 1-1 Call with our Team ⏰ : 0d 2h 59m 43s

Home
Research
Analysis
Community
  1. Cryptonary
  2. Market Analysis
  3. Multi Format Thursday – Vol 51
Market Analysis

Multi Format Thursday – Vol 51

Updated: Aug 31, 2024
Published: Jul 21, 2022
0
Share:

Welcome to Multi-Format Thursdays, where we analyse the cryptocurrency market in both text & video formats.

Post Feature Image

Disclaimer: Not financial nor investment advice. Any capital-related decisions you make are your entire responsibility and yours only.

Video Analysis

Total Market Cap

aligncenter size-large wp-image-222367

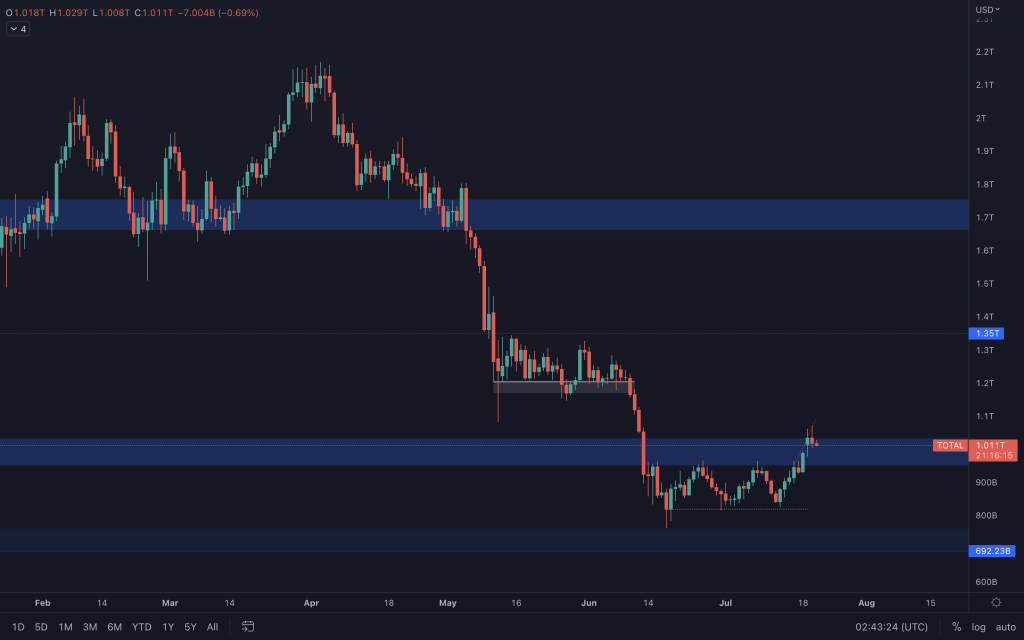
The Total Market Cap is trading within our resistance range. For bears, this is the level they'd expect to see the market reverse from, which is reasonable given that we are in a bear market where supports are flipped into resistance. So, now's the time to observe for a sign of weakness. After all, most of the world is in the midst of a recession (even though world leaders may choose not to call it such), where inflation continues to spiral out of control and measures taken so far are proving ineffective. The ECB will announce their rate hike today, and we're six days away from the next FOMC meeting, where we can expect additional volatility as each announces the next round of rate hikes. Yesterday's candle slowed the upside momentum. As it takes place at the top of a range, it could signal the start of a potential reversal of the preceding trend. What we'd want to see follow it is a strong move in either direction. Upwards, and it'll signal that it has more legs left. Downwards, and we could have ourselves a top. The problem with this approach is that on a tradeable asset, a strong move can often take the price to the point that it is undesirable to enter a trade. But, at this point, we can use this index to help us with the overall market bias at a pivotal point before looking at what charts better align with what's conveyed here.

Altcoins' Market Cap

aligncenter size-large wp-image-222368

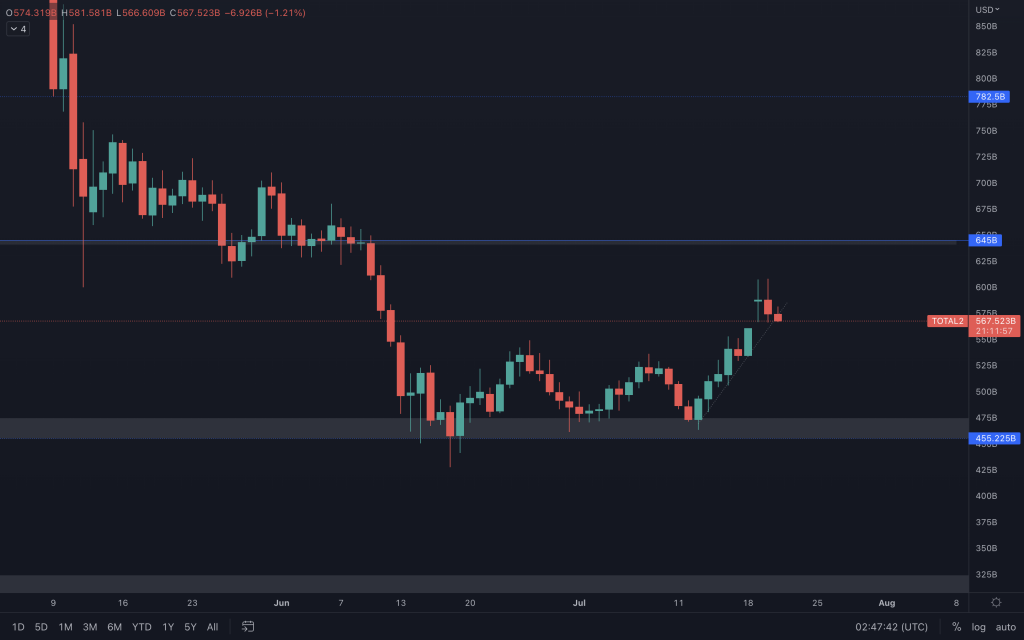
We're at that point where the altcoins' market cap is approaching the top of its range with resistance at $645B. As the index has met where it previously wicked on the way down, we could see a reversal without achieving the entire move. One thing we'd watch out for to indicate any downside is a break of the supporting trendline. Without that being broken, $645B remains on the cards.

Bitcoin

aligncenter size-large wp-image-222369

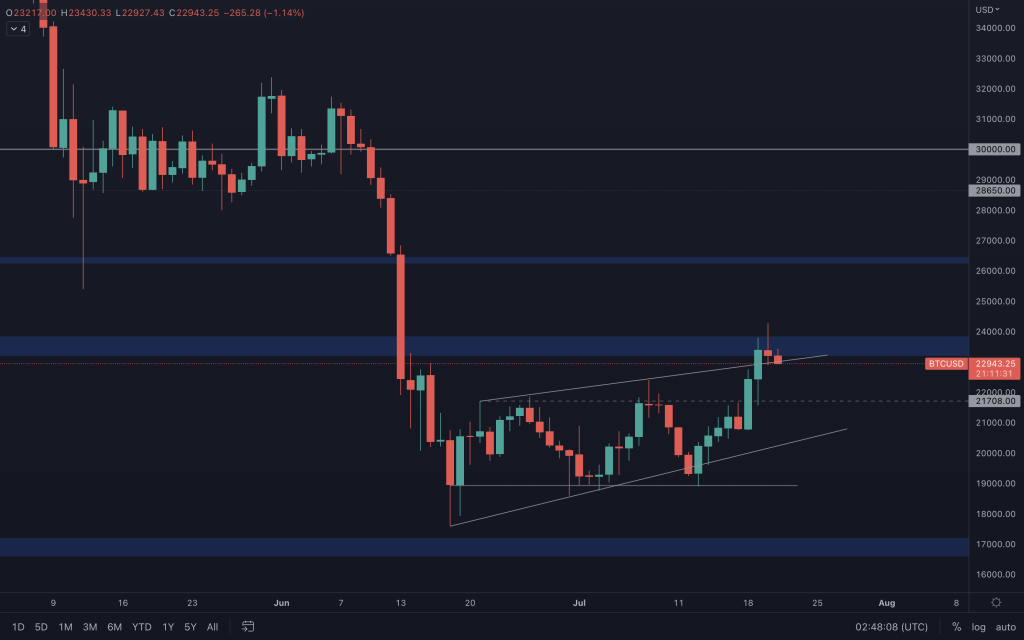
Not the strongest of closes after news of Tesla's Q2 earnings, where it was revealed that it had sold 75% of its Bitcoin holdings (almost $1B) and, as such, we saw an increase in volatility for the last few hours of the day. We'll possibly see the true effect of this, whatever its extent, over the next 24 hours, so make sure that any trades that you are already in have good risk management. As mentioned above, the ECB will also choose between 25bps and 50bps for the Eurozone, which will only add to the volatile start of the day. Back to the chart, Bitcoin's broken upside out of the rising wedge but needs to close above $23,850 to signal that there's more left in this move. If it achieves that, $26,000 is next in line. Without it, it's simply retested the top of its range with a failed breakout attempt, which would have us looking for a closure back inside the ascending wedge.

Ether

aligncenter size-large wp-image-222370

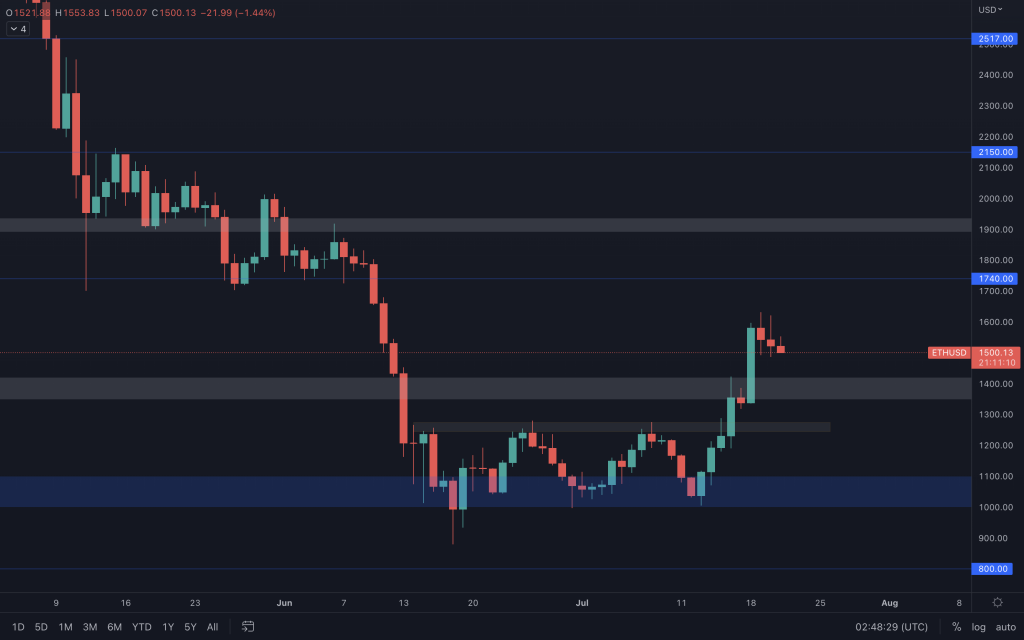
Ether's appreciation has slowed, but as long as it remains above $1,350, $1,740 remains possible (not that we'd enter a trade at this point). The lower timeframe is moving sideways within a $100 range. A closure out of this range may help to identify its next move.

Polkadot

aligncenter size-large wp-image-222371

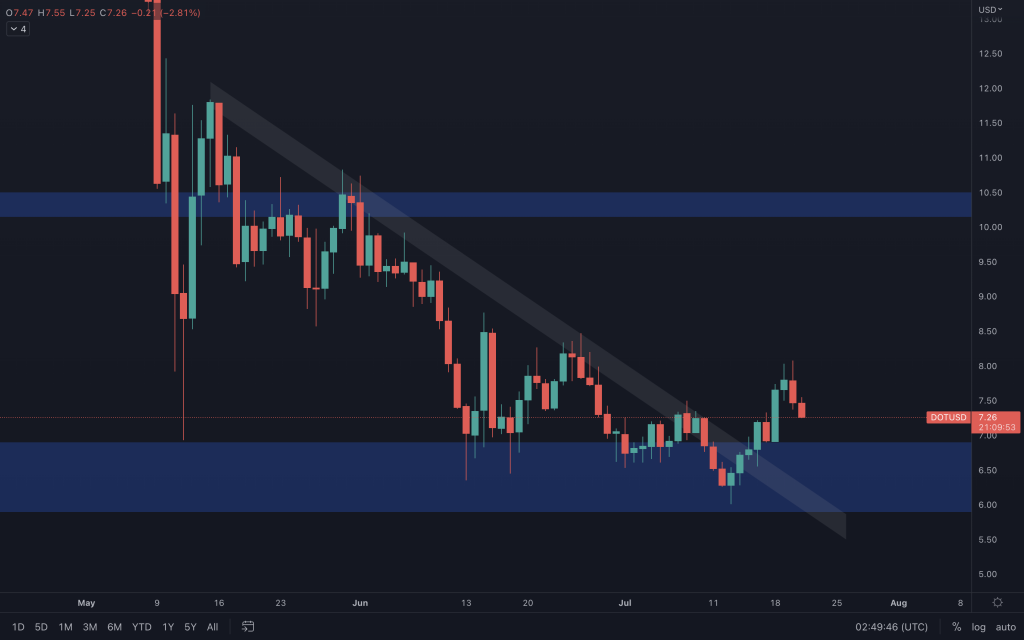
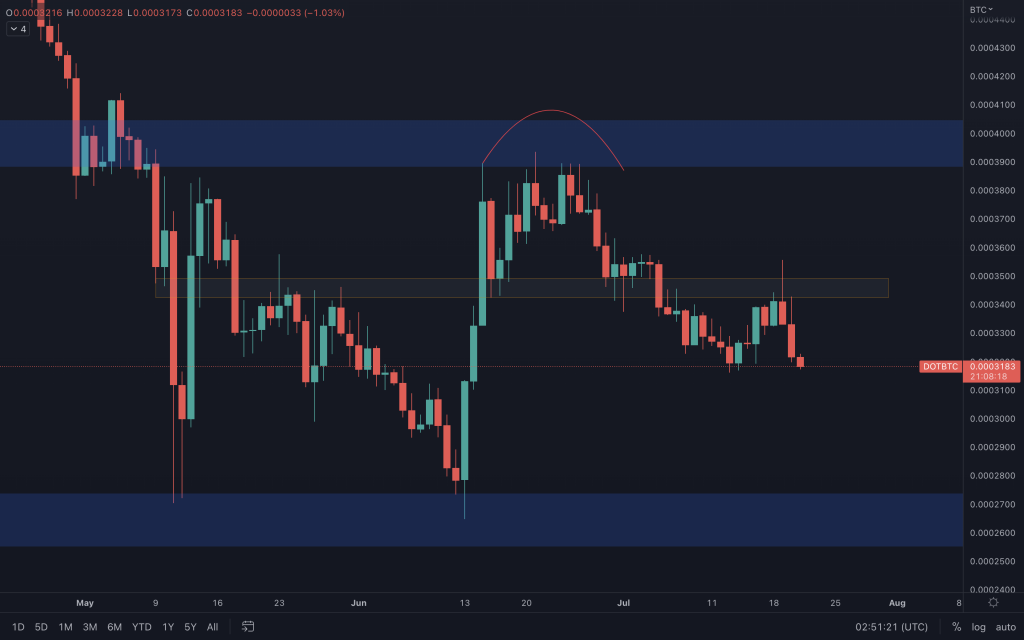
Daily timeframe-wise, DOT is in a bullish market structure after its breakout. But it still needs Bitcoin onside as it's not supported by volume or the DOT/BTC chart. With it unable to reclaim support on the DOT/BTC chart, any downside in Bitcoin will hurt DOT more.

DOT/BTC

aligncenter size-large wp-image-222373

Synthetix

aligncenter size-large wp-image-222372

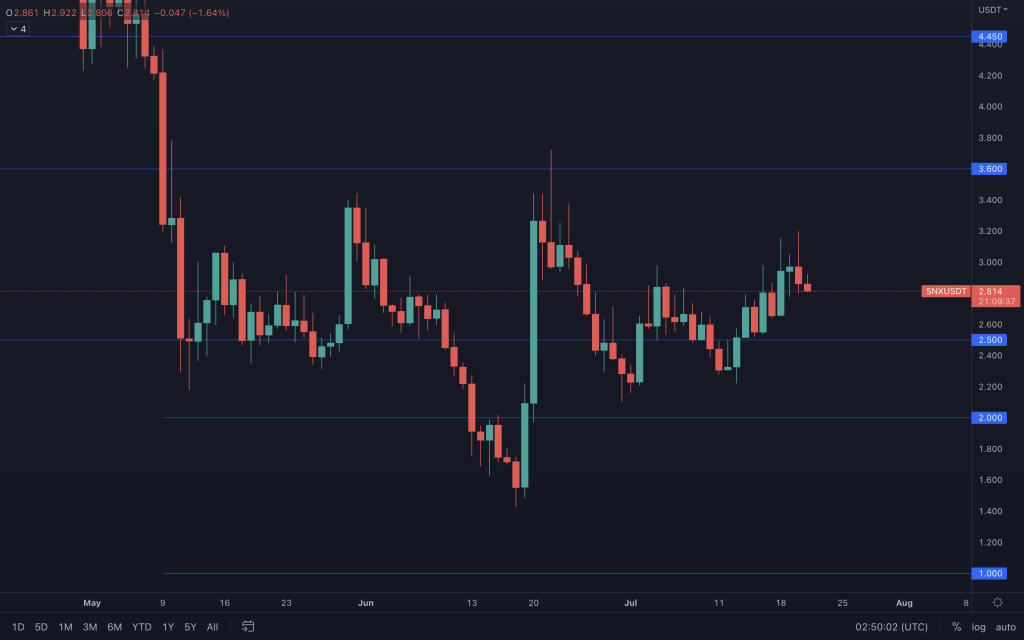
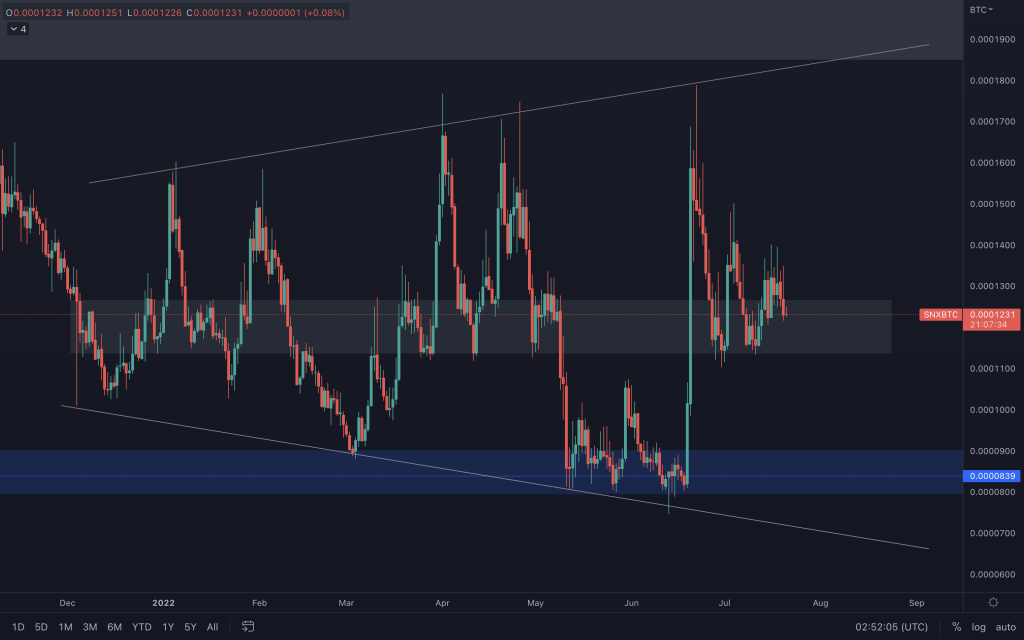
SNX is continuing with a higher high, higher low structure which keeps $3.60 on the table. But as you already know, it will need a steady Bitcoin to achieve that. SNX/BTC is creating a series of lower highs around the mid-point of its broadening wedge, so if it loses that support, we'd expect to see BTC be the better performer again.

SNX/BTC

aligncenter size-large wp-image-222374

THORChain

aligncenter size-large wp-image-222375

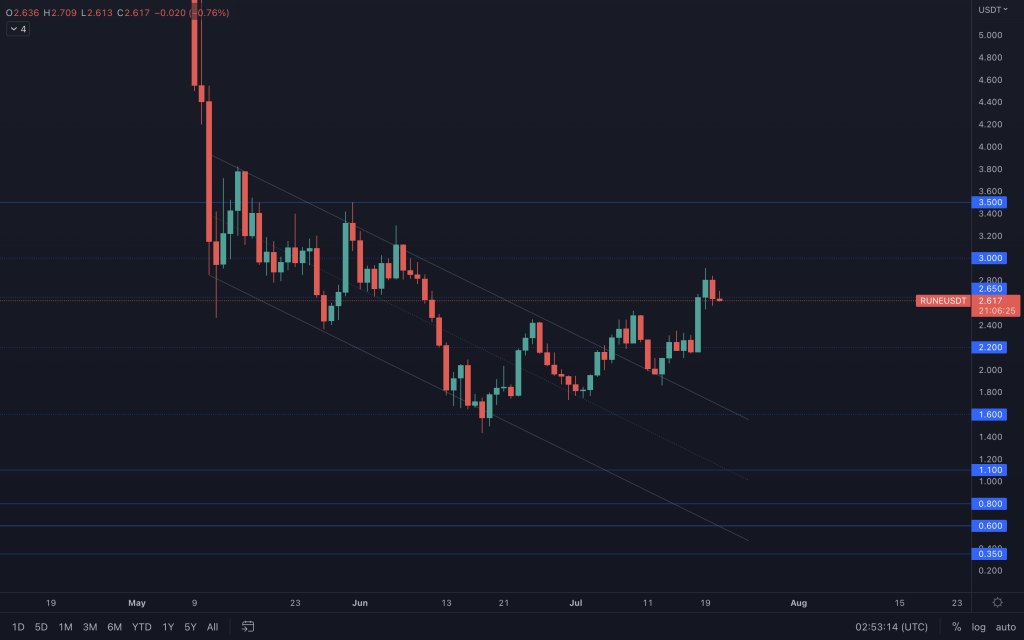
RUNE is still moving positively in a daily bullish market structure. $3-$3.50 is its resistance and, although unlikely given the condition of the market at the moment, a weekly candle close above $3.50 is needed to signal higher prices.

Solana

aligncenter size-large wp-image-222376

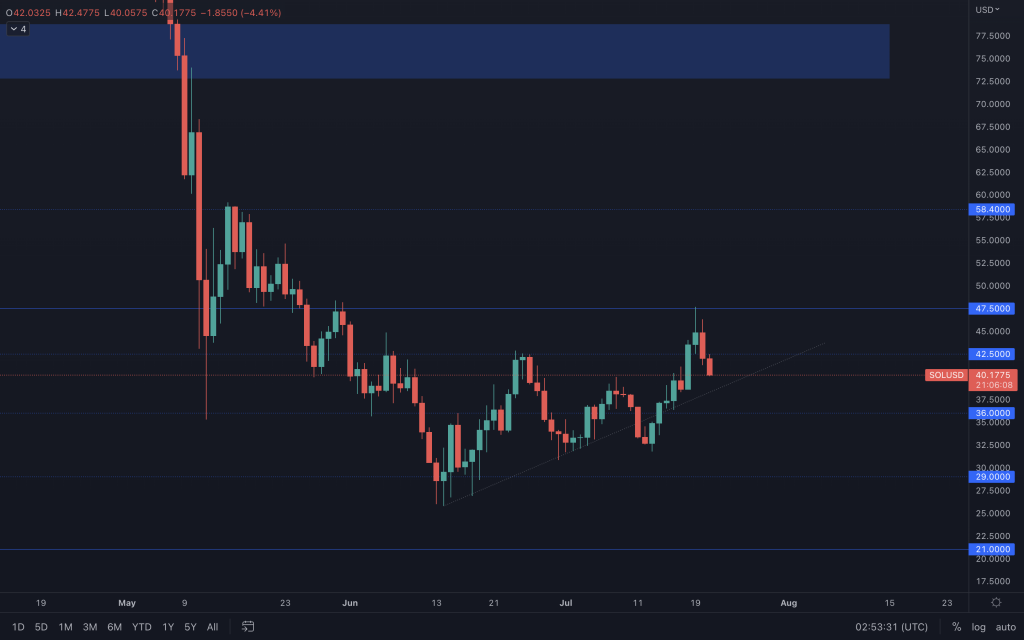
After touching $47.50, SOL closed as a bearish engulfing from its resistance yesterday. This points to a retest of its supporting trendline. From there, we'd have to see if it can hold because another loss of that as support and it may not be so forgiving.

Serum

aligncenter size-large wp-image-222377

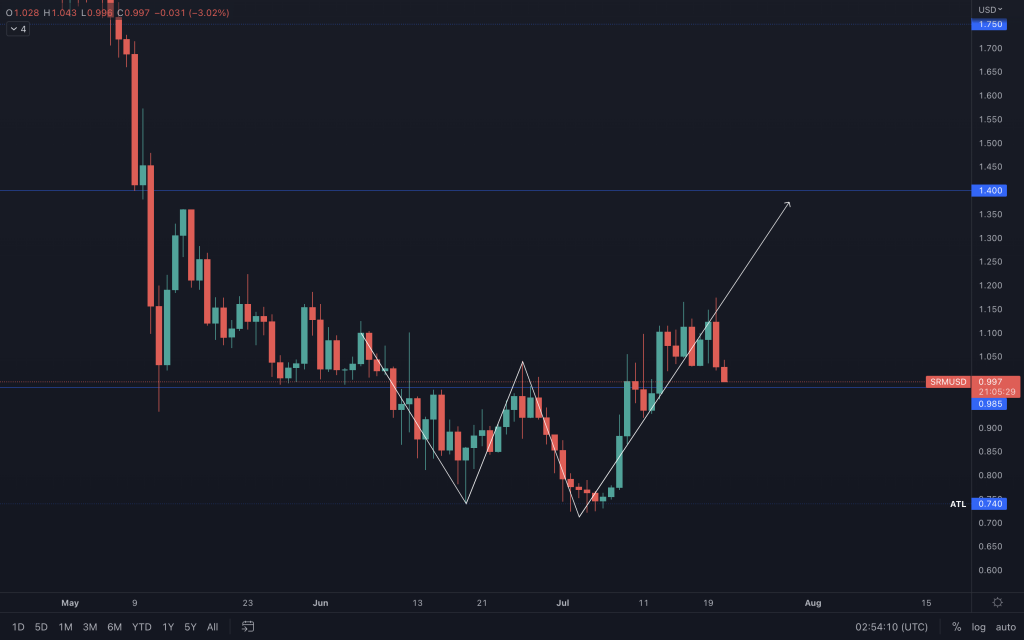
A poor closing for Serum yesterday. A heavily bearish candle that will surely have it testing its support. A loss of support by a daily closure, and we'd be looking at $0.74 once again.

FTT

aligncenter size-large wp-image-222378

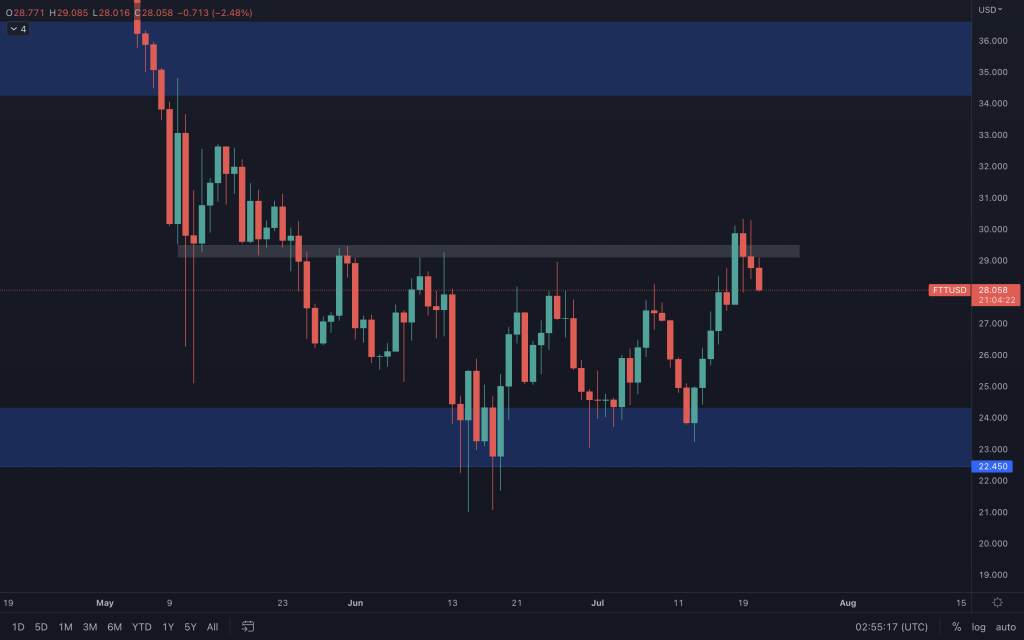
After closing below $29, FTT has invalidated the setup with the target of $35. It's not immediately turned bearish from a daily perspective, but the lower timeframe chart may have some insight after losing a supporting trendline. (I'll cover this in the video)

MINA

aligncenter size-large wp-image-222379

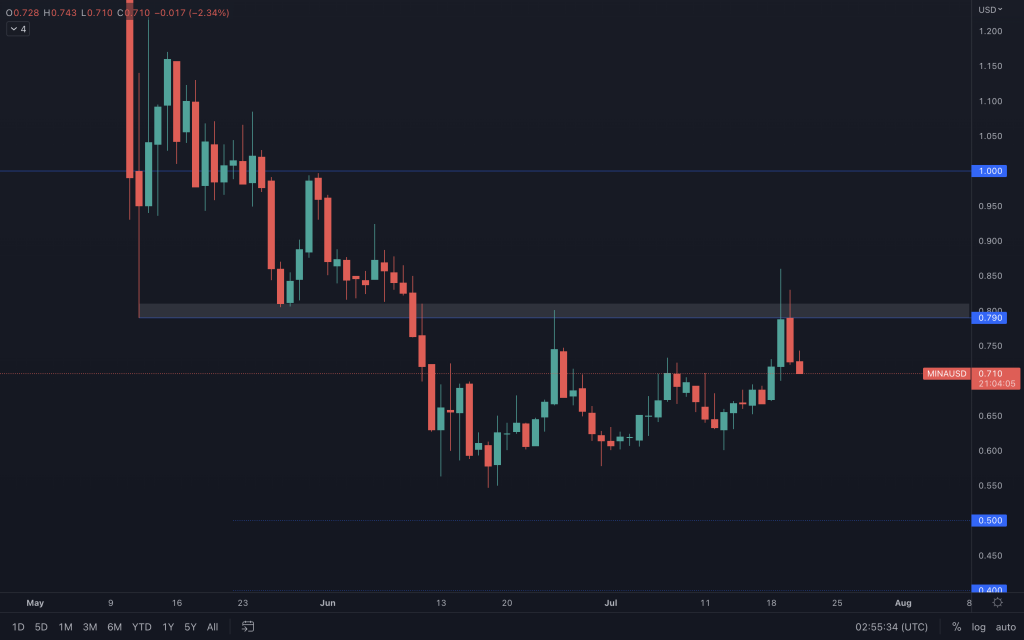
Two failed attempts at closing above $0.79 keep MINA in bearish territory. Its price action has closely resembled that of Bitcoin over the past month, so it is worth keeping one eye on that for any significant changes, as it will reflect here.

dYdX

aligncenter size-large wp-image-222380

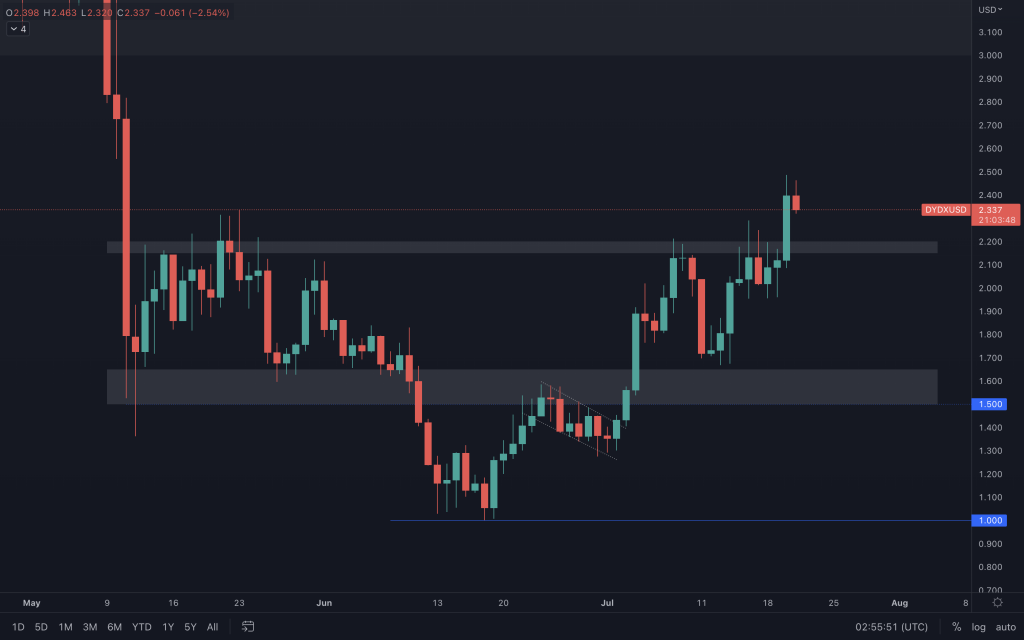
Although Bitcoin is giving signs of weakness, dYdX just doesn't care at the moment. Of course, any significant change in the orange one will impact dYdX's price action, but downside can only be expected should it close below $2.15.

Get started for free

Create your free account or log in to read the full article.

​

Germany

By signing up, you agree to our Terms & Conditions
Recommended from Cryptonary
BTC, ETH and More: Crypto Structure Diverges, Bitcoin Remains Fragile
PRO
Market Direction
BTC, ETH and More: Crypto Structure...Over the past week, downside played out where expected, but follow-through has been inconsistent, wi...
11 min read
Mar 24, 2026
Market Update: Risk Assets Rebound Amid Tightening Conditions
PRO
Market Updates
Market Update: Risk Assets Rebound ...The market just gave us a perfect example of how fragile this environment is. Escalation over the we...
8 min read
Mar 23, 2026
BTC, ETH and More: Stablecoin Dominance Signals Downside
PRO
Market Direction
BTC, ETH and More: Stablecoin Domin...A more fragile backdrop is beginning to show. With the Fed turning less supportive and stablecoin do...
13 min read
Mar 20, 2026
BTC, ETH and More: Short-Term Upside Liquidity in Play
PRO
Market Direction
BTC, ETH and More: Short-Term Upsid...Markets are pausing at key levels, and the next move is starting to take shape. After completing the...
13 min read
Mar 31, 2026
Market Update: Fed in a Bind & Bitcoin at a Breaking Point
PRO
Market Updates
Market Update: Fed in a Bind & Bitc...Markets are turning fragile as escalating Middle East tensions drive a clear risk-off shift, tighten...
8 min read
Mar 30, 2026
Market Update: Macro Risks Signal Further Downside
PRO
Market Updates
Market Update: Macro Risks Signal F...Earlier in the week, we had a lot of questions about whether we still see the $50k-$60k level being ...
11 min read
Mar 27, 2026
BTC, ETH and More: Crypto Structure Diverges, Bitcoin Remains Fragile
PRO
Market Direction
BTC, ETH and More: Crypto Structure...Over the past week, downside played out where expected, but follow-through has been inconsistent, wi...
11 min read
Mar 24, 2026
Market Update: Risk Assets Rebound Amid Tightening Conditions
PRO
Market Updates
Market Update: Risk Assets Rebound ...The market just gave us a perfect example of how fragile this environment is. Escalation over the we...
8 min read
Mar 23, 2026
BTC, ETH and More: Stablecoin Dominance Signals Downside
PRO
Market Direction
BTC, ETH and More: Stablecoin Domin...A more fragile backdrop is beginning to show. With the Fed turning less supportive and stablecoin do...
13 min read
Mar 20, 2026
Research
Top PicksDeep DivesPassive IncomeAirdrop ReportsMemecoins
Analysis
Market UpdatesMarket DirectionMarket PulseLivestreams
Tools
Market DirectionAssets & PicksAirdropsPortfolio Tracker
Cryptonary
Affiliate programEducationPrivacy PolicyTerms & ConditionsContact UsWrite for usTeam
Stay connected
Disclaimer: The information provided on this website is for educational and informational purposes only and does not constitute financial, investment, legal, or tax advice. Cryptonary is not a licensed financial advisor. All content is shared without any guarantee of accuracy or completeness. You are solely responsible for your investment decisions. Always do your own research and consult with a licensed professional before making financial choices. Past performance is not indicative of future results.

×
popupimage
Our Latest Utility Token Research ReportPreviously locked for Pro members, now available to read in full.
  • tickThe utility token we're tracking closely
  • tickWhy we believe it's still early in the cycle
  • tickWhat we're watching to confirm a structural shift
​
Germany

No spam. No hype. Just the research.