Save 23% ($351) & Get a Free 1-1 Call with our Team ⏰ : 0d 2h 59m 43s
Disclaimer: Not financial nor investment advice. Any capital-related decisions you make are your entire responsibility and yours only.
Video Analysis
We've highlighted the potential of volatility, and that's exactly what we're seeing. With unacceptably high inflation figures, the Fed increased the interest rate by another 75bps, which the market would have already priced in. The question may become, how many more rate increases can the Fed do to slow demand when it's essential commodities that are a significant contributor to high inflation figures? We are still seeing the prices of oil, gas, food, etc., rise. Will the Fed eventually have to turn on the printer for those that can't afford to get by? After all, loans are now more costly for the American consumer. Although the Fed says no, is it entirely ruled out? Obviously, should the war in Ukraine end and the gas flow to Europe increase back to normal levels (they're now running at 20% pre-war levels), that would help ease fuel prices, thus lowering the cost of commodities. But all we know is that there's still a bumpy road ahead for the Fed, with some factors beyond their control. Although we may get a running commentary from the Fed, there will be no rate hike announcement for the next eight weeks, with the next FOMC meeting taking place on September 20th and 21st. Jerome Powell did very well in playing down recession concerns, but today the US will publish its GDP figures. Technically, two consecutive quarters of negative GDP growth is a recession. However, when asked about it yesterday in the press conference, his words were, 'I do not think that the US is in a recession.' Powell stated that too many areas of the economy are performing well, namely the labour market. Although growth is indeed slowing, it was extraordinarily high last year, at 5.5%. So he mentioned that the Fed would have expected it to slow regardless. The unemployment rate remains near a 50yr low, and the labour market is strong, with 2.7m people hired in the first half of the year. This offers the Fed the ability to continue to move expeditiously by increasing the interest rate. Although in the same conference, he also stated that it may be appropriate to slow the rate at which they are moving in order to assess how their monetary policy is affecting the economy and inflation. Today will show how the data is received by market participants, regardless of what was said yesterday. So we aren't yet out of the woods concerning volatility.
Total Market Cap
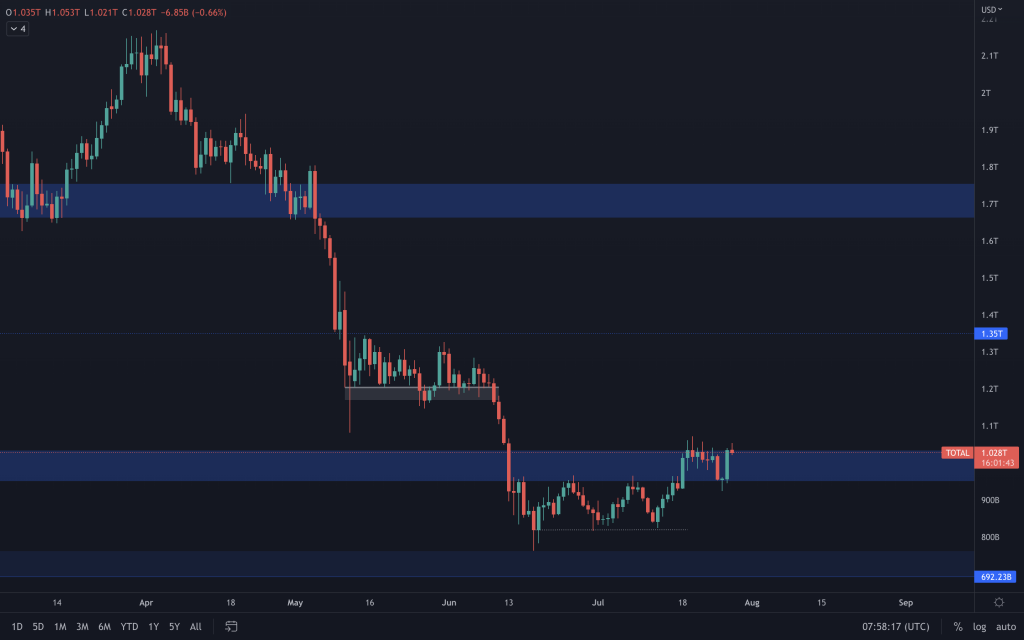
The Total Market Cap made a whole range move of its resistance yesterday, from $950B to $1T. However, it is still at its resistance. Ideally, we monitor this chart on a weekly timeframe. We are looking out for a continuation of the positive moves to transfer into a weekly closure above $1T and put $1.35T next. Without it, a revisit to $800B is what remains on the cards.
SPX (S&P 500)
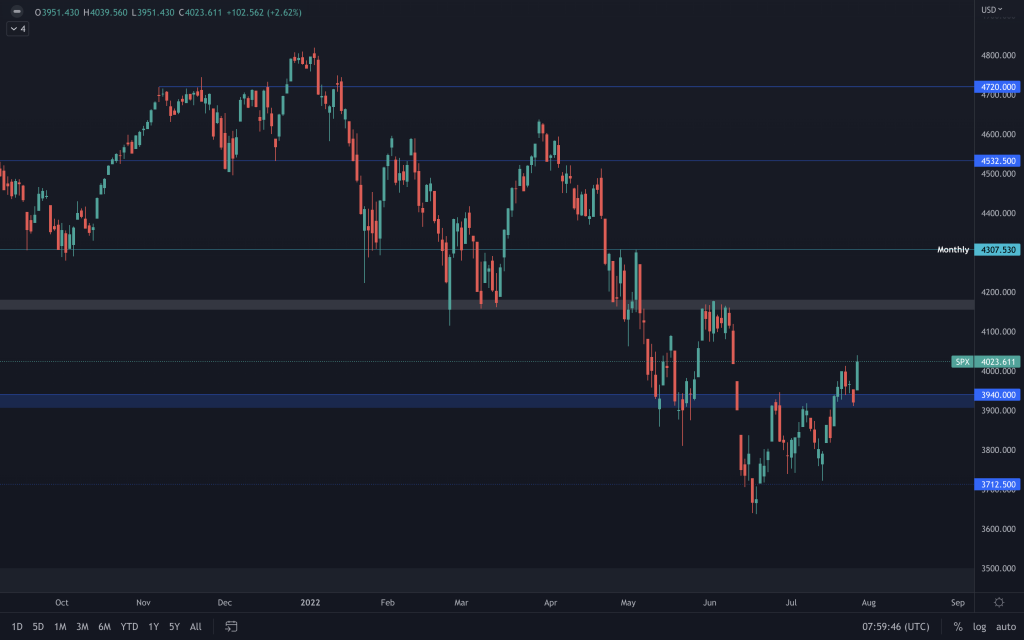
After a strong performance yesterday, SPX still has more room to move up after a retest of support. This is in contrast to Bitcoin's position (at resistance), but we've spoken many times about the close correlation that these two assets have had this year. It's offering mixed signals, but something that helps to show why risk management for shorts is vital.
Bitcoin
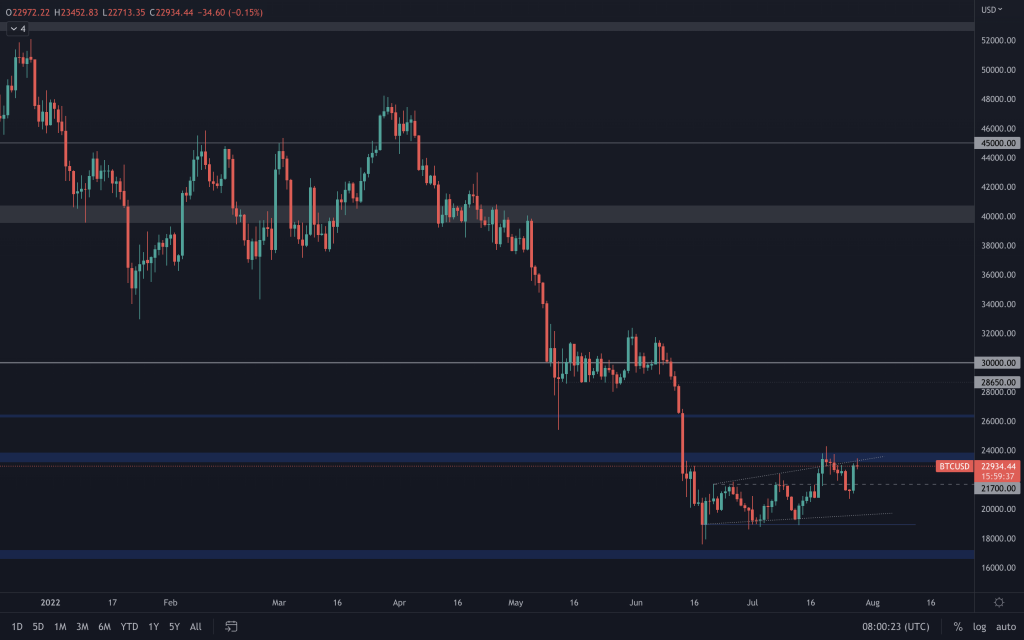
Yesterday's move was precisely why we had to be on high alert. After the FOMC press conference, a pump has taken Bitcoin straight back to the top of its range. It doesn't immediately make it bullish, though. Bitcoin is faced with its range resistance ($23,850), the upper line of the broadening wedge, and as we mentioned in our Weekly Digest, Realised price by address lies between $23,000-$24,000. It is still a risky time to enter trades, as today's US GDP data may very well play a part in today's price action. Awaiting further confirmation of the bullishness from yesterday's candle where Bitcoin breaks above resistance is the safest approach if you're thinking of a long, but a move to $26,000 may be quick with many short position stop losses placed above $23,850. On the flip side, if Bitcoin rejects here again (it is at resistance after all), we'll continue looking toward $19,000.
Ether
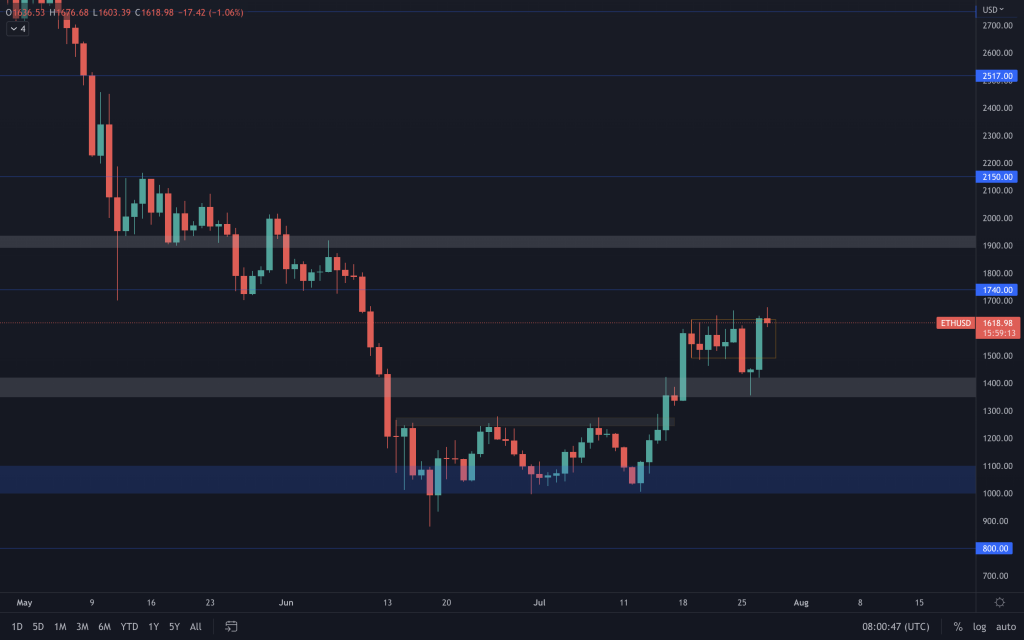
We mentioned yesterday that it looked good as long as Ether didn't lose $1,350. It had retested $1,350 and increased almost 13% yesterday. The one risk remains an outperformance by Bitcoin because until Ether gets a weekly reclaim of the counter trendline (ETH/BTC chart), we can't yet presume that ETH will continue to be the best performer. From here, Ether is simply mid-range. and back within the consolidation box. Without a loss of $1,350, it still has $1,900 in its sights ($1,740 comes first from a daily point of view, but $1,900 is an extension to the entire weekly range move).
ETH.D
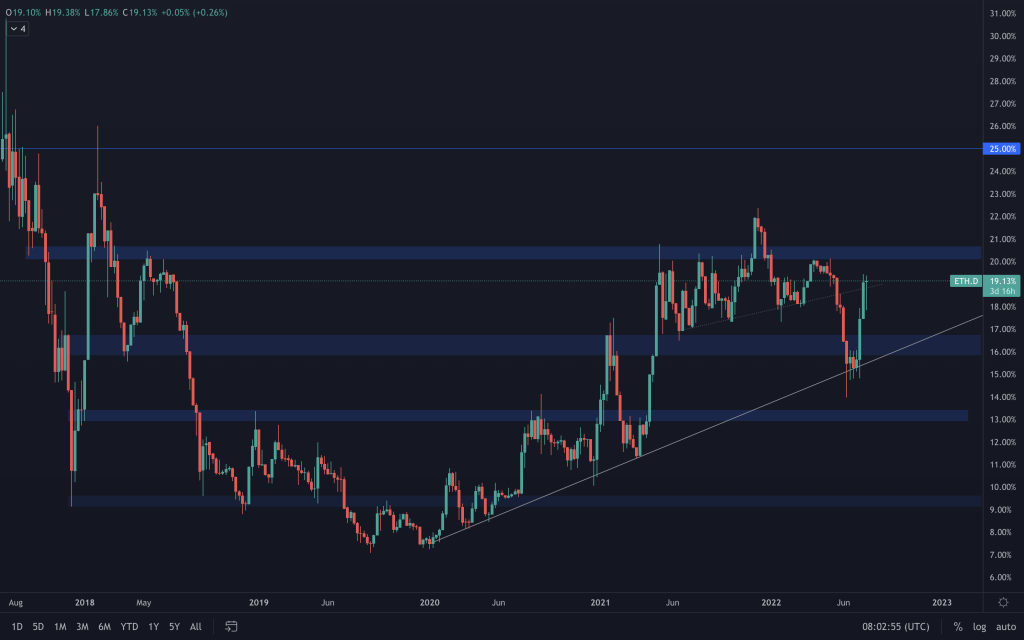
We can see that the overall trend for Ether's dominance has been up since Jan 2020. With its dominance approaching 20.5%, a weekly closure is needed above it to give it another 4.5% run. Without it, we could see another retest of the higher timeframe supporting trendline.
Polkadot
Synthetix
THORChain
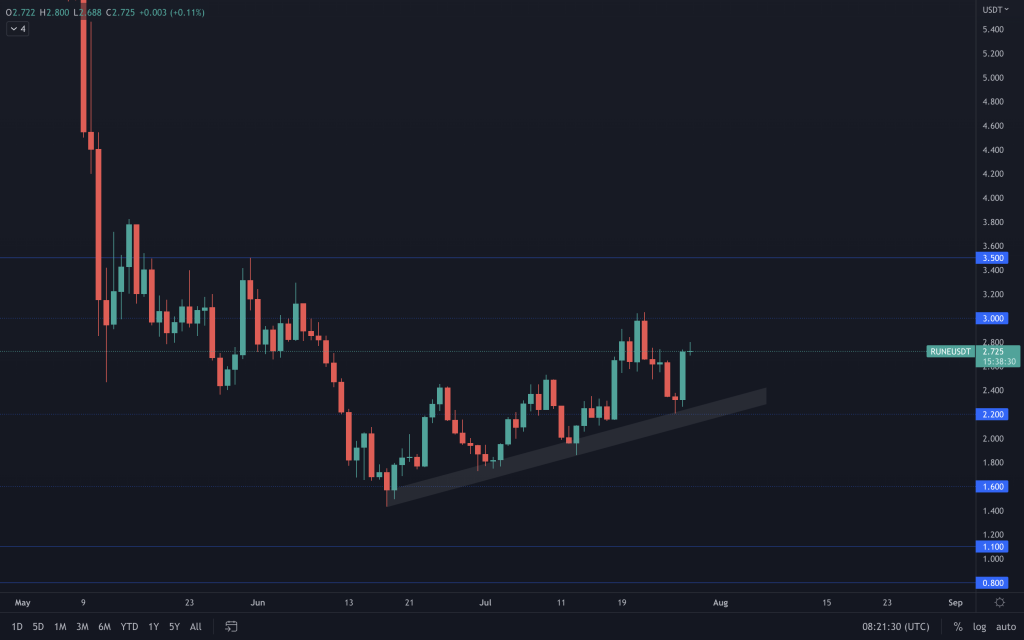
With the support channel holding, RUNE has avoided further downside. For more upside, we want to see a reclaim of $3.50 by a weekly candle closure from RUNE. RUNE would show weakness if the supporting channel is lost.
Solana
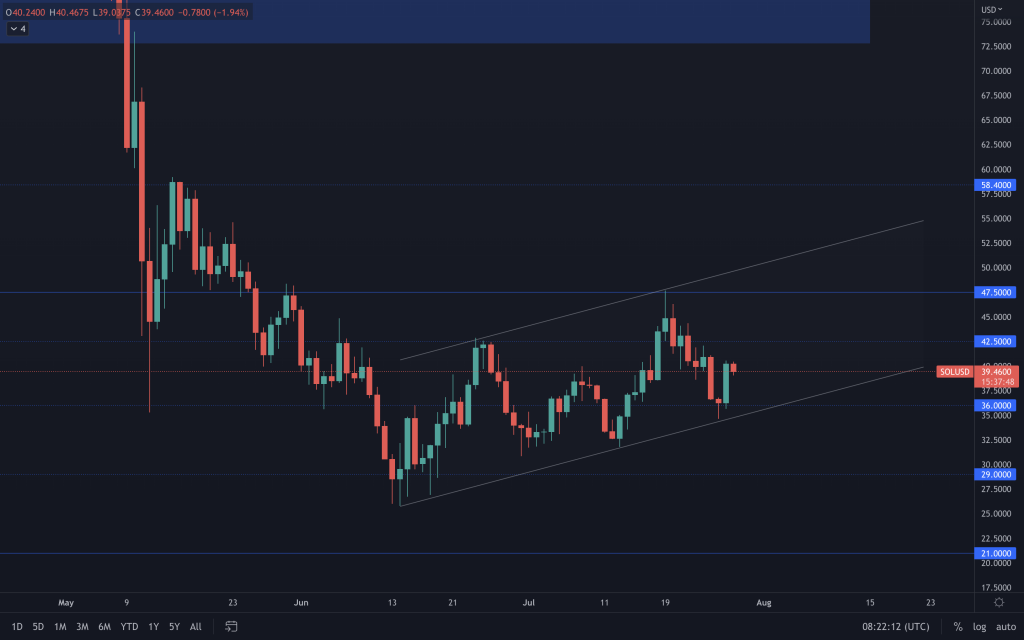
SOL is moving up within a parallel channel. We either want to see a weekly reclamation of $47.50 or a daily break out of the channel to indicate its next direction.
Serum
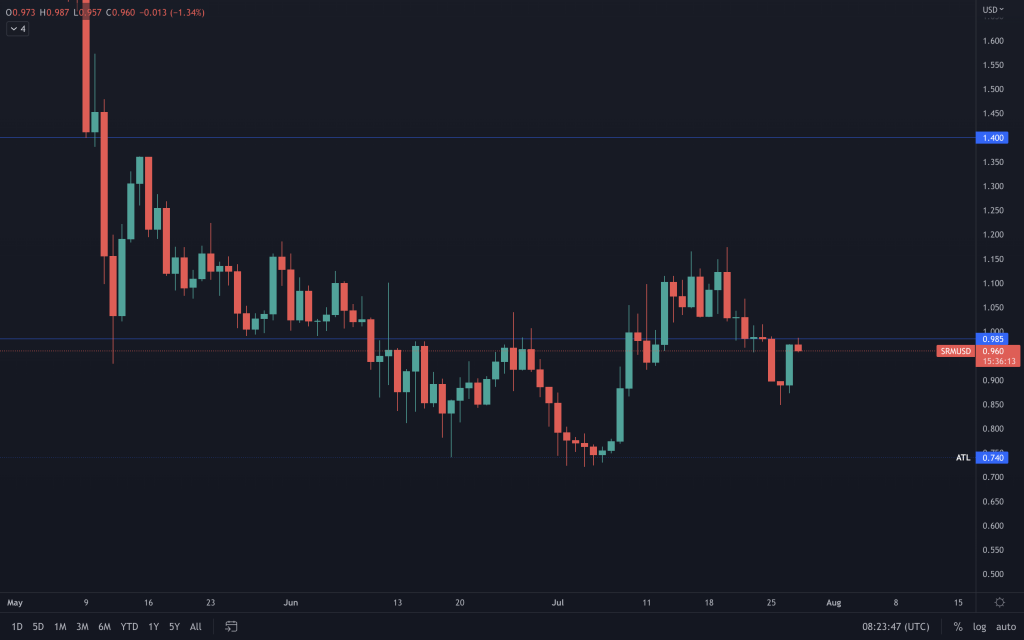
Volume remains extremely low, and SRM is still below $0.985. It certainly needs to hold that level on the weekly timeframe, but it isn't looking in a strong position right now with $0.74 still on the cards.
FTT
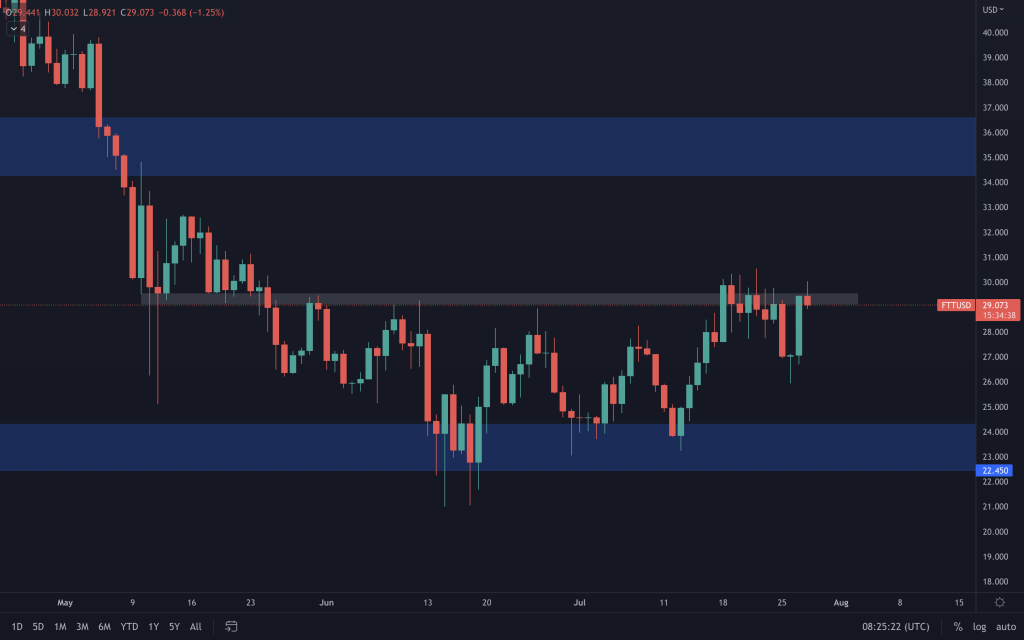
Yesterday's impulsive move took FTT straight into its mid-range resistance. It would need to overcome $30 to see any further upside because it's only a retest right now.
MINA
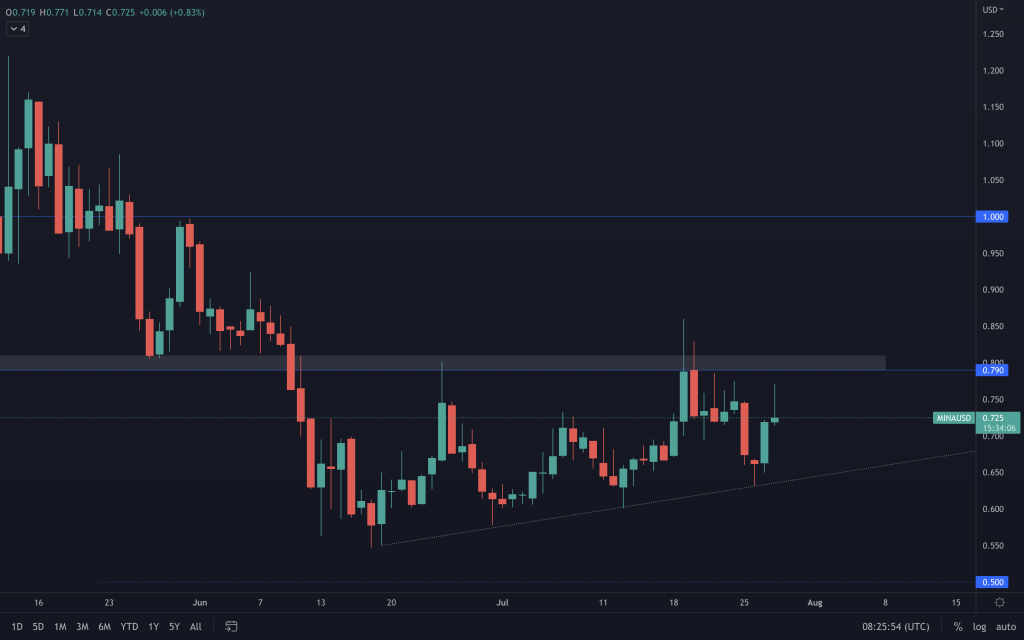
We caught the movie down, but MINA is stuck between a supporting trendline and $0.80. We're awaiting a breakout in either direction to signal its next move.
dYdX
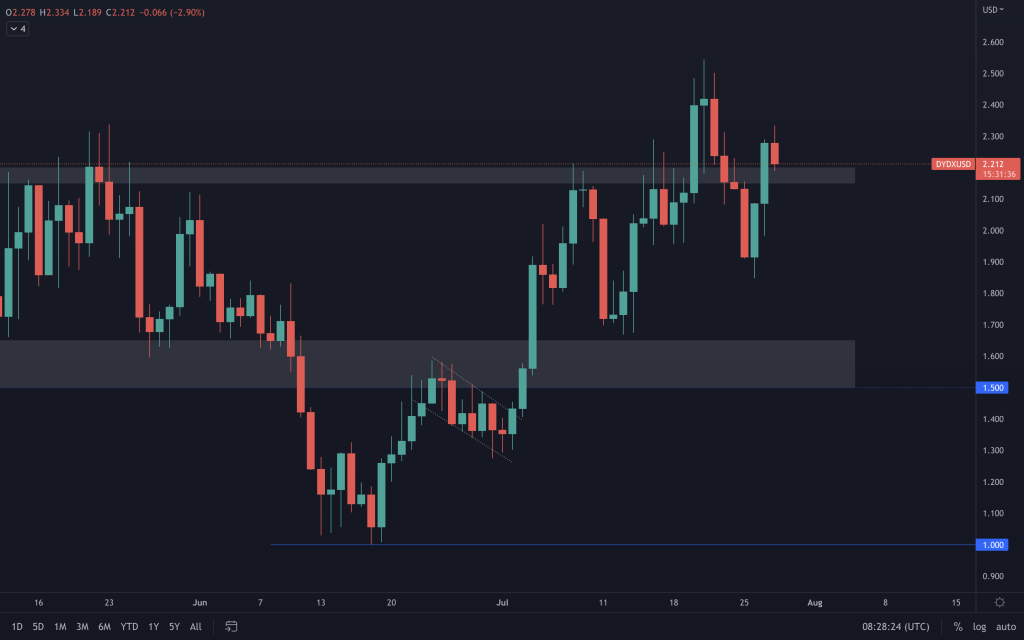
dYdX is back above $2.20, but we would urge caution here. Not only because we expect more volatility, but because the daily timeframe chart has formed a lower low. Waiting for the chart to mature further is the safest approach, but for someone eyeing up a long position, although very risky, invalidation of a move to $3 is nearby (a closure below $2.15).
Recommended from Cryptonary


