Save 23% ($351) & Get a Free 1-1 Call with our Team ⏰ : 0d 2h 59m 43s
Disclaimer: Not financial nor investment advice. Any capital-related decisions you make are your entire responsibility and yours only.
Video Analysis
Total Market Cap
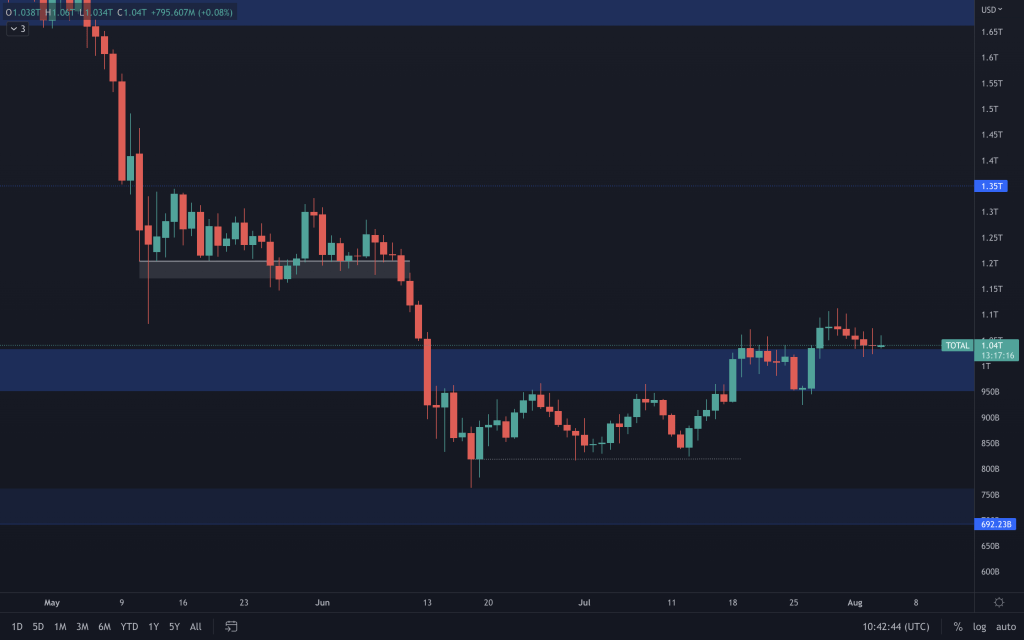
It's been quite a quiet week on the price action front as all the Total Market Cap has done is come down and test the broken resistance as support. While it still holds the $950-$1 trillion level, in a bullish structure, higher prices remain a possibility. Any closure below $950B will be a sign of weakness from the buyers.
SPX (S&P 500)

This is where the threat of adverse price action in the crypto market currently lies. On the weekly front, the S&P 500 is presently green but within its weekly resistance range ($4,155-$4,180). Any bearishness shown here will likely reflect on crypto, especially with Bitcoin being below $23,850 and not following SPX's positive lead this week. If SPX ends up closing the week positively, we may see that reflect in Bitcoin's price action over the weekend.
Bitcoin
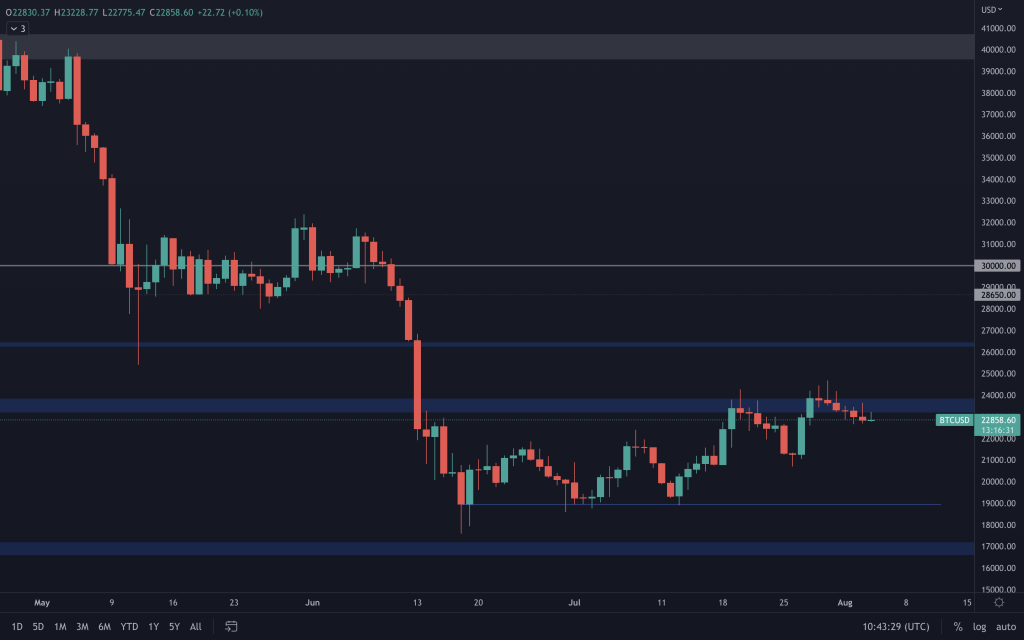
Bitcoin continues to struggle with the $23,850 level we've had marked out for some time. Last week's candle may have closed green, but it didn't do so convincingly. Its price stayed below $23,850, and the last positive daily price action took place with lesser volume. Ideally, we want to see buyers encouraged by the bullish market structure and price increase, stepping up, pressing that buy button to go on and push the price past resistance. That didn't happen, so we are seeing a lack of encouragement from buyers with this price action. Therefore, (not ignoring the fact that this is a bear market btw), the downside threat remains present. However, you'll notice that we mentioned the bullish daily structure. That is the one thing that bulls continue to have on their side. So, either we see the price push up past $23,850, targeting $26,000, or the bears take back control, invalidate the bullish structure we have here, and take the price back to the lows of the range ($17,000s).
Ether
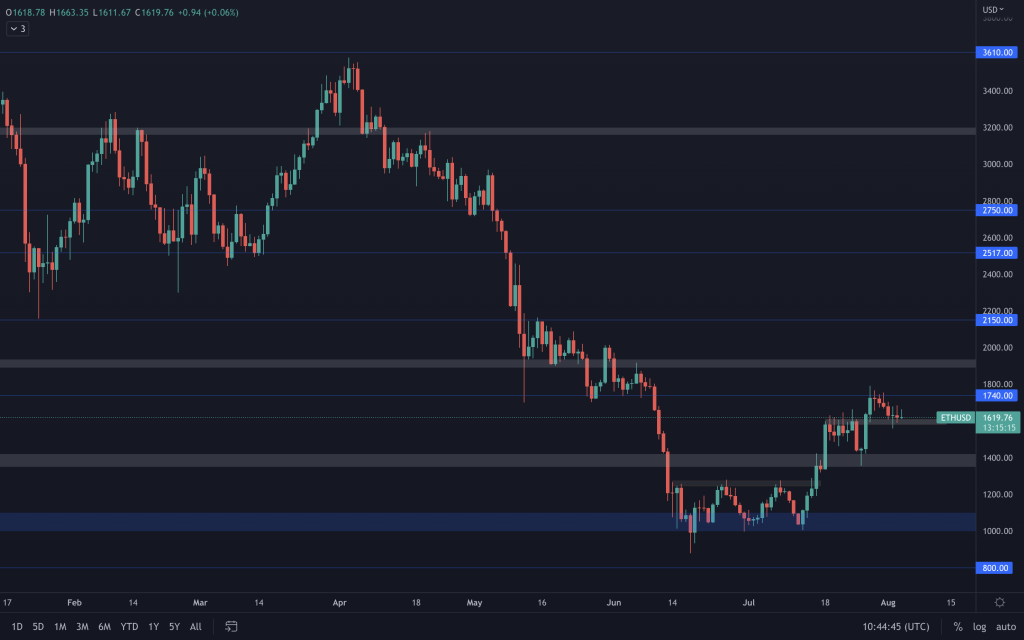
Ether is still holding onto $1,580 support, which we'd expect to be the level for it to form a higher low to push it past $1,740, targeting $1,900+. A closure below $1,580 would begin to show weakness and have us eyeing a retest of $1,350 once again.
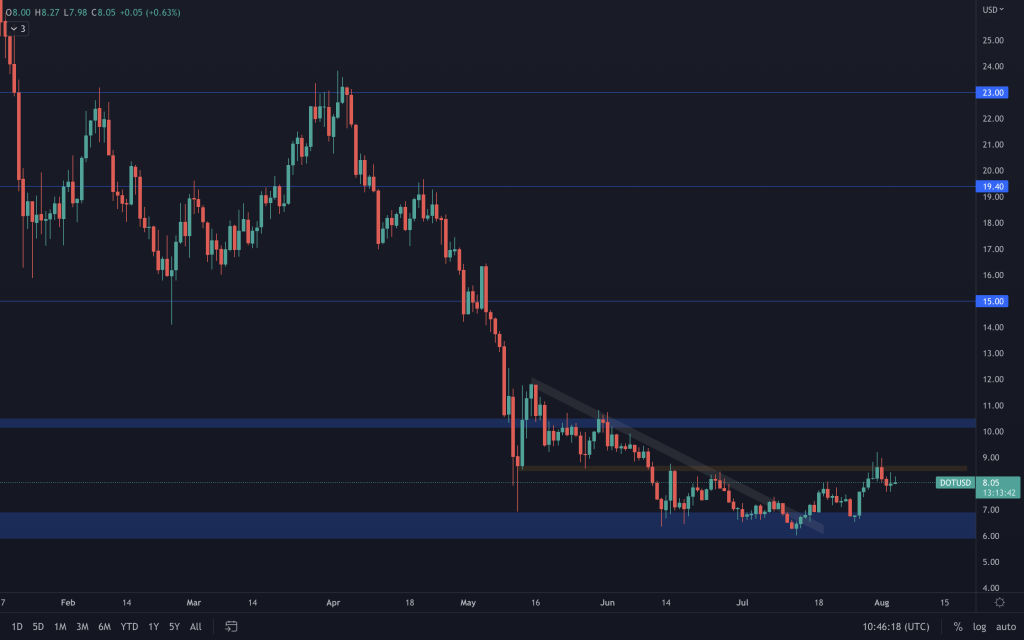
Polkadot
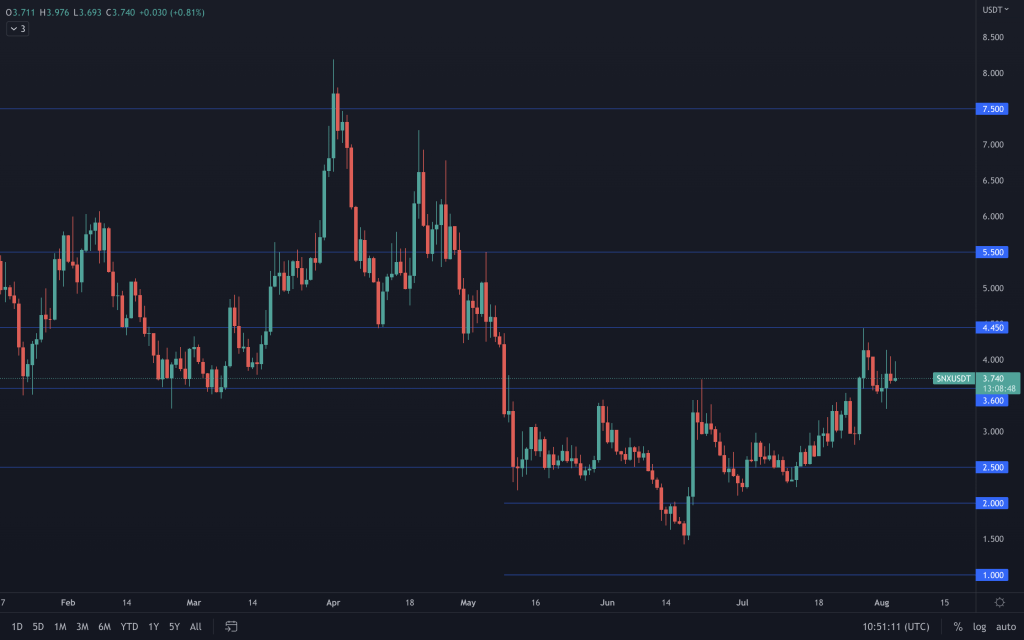
Synthetix
THORChain
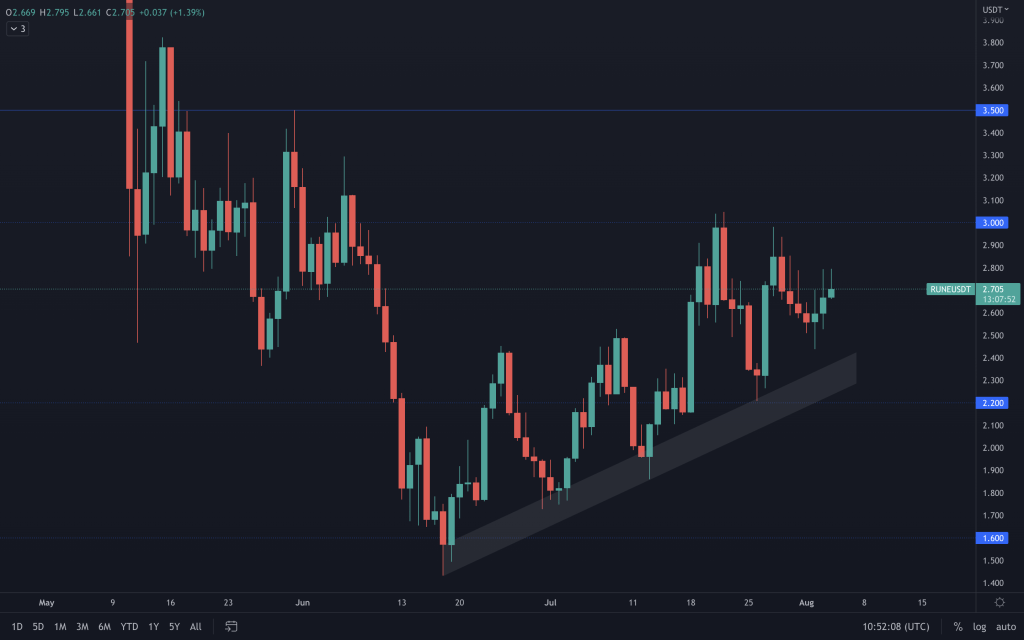
We are still looking for a break above $3 to bring $3.50 into play or a closure below the supporting trendline ($2.20) to indicate that lower prices will be incoming.
Solana
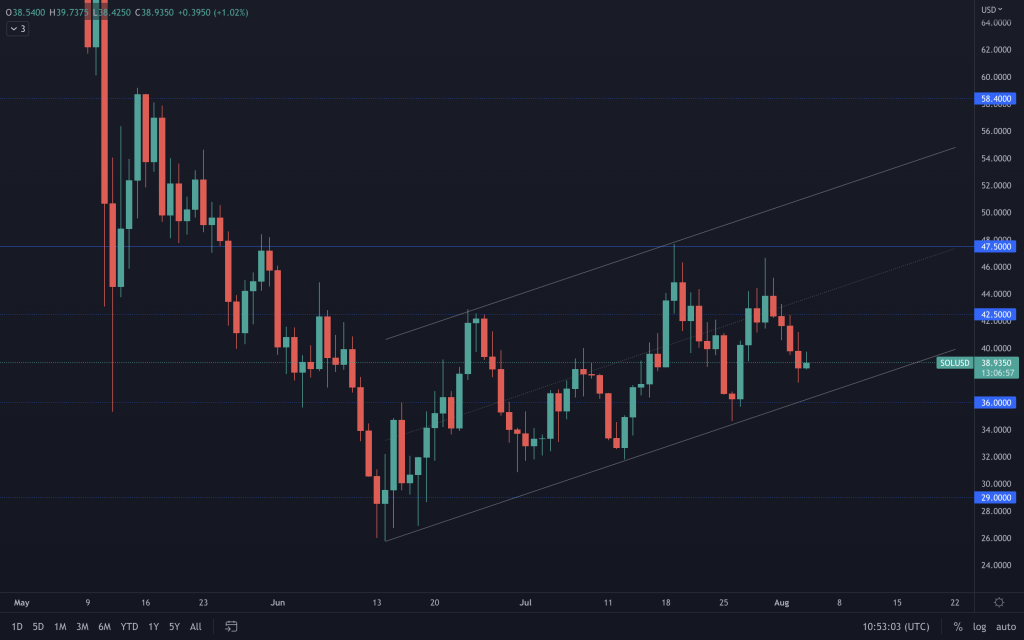
SOL continues to trade within an ascending channel. Closing below it ($36) would set our eyes on $29. A strong reaction from the channel support once again, and we'd be looking towards $47.50 and whether it can break above it.
Serum
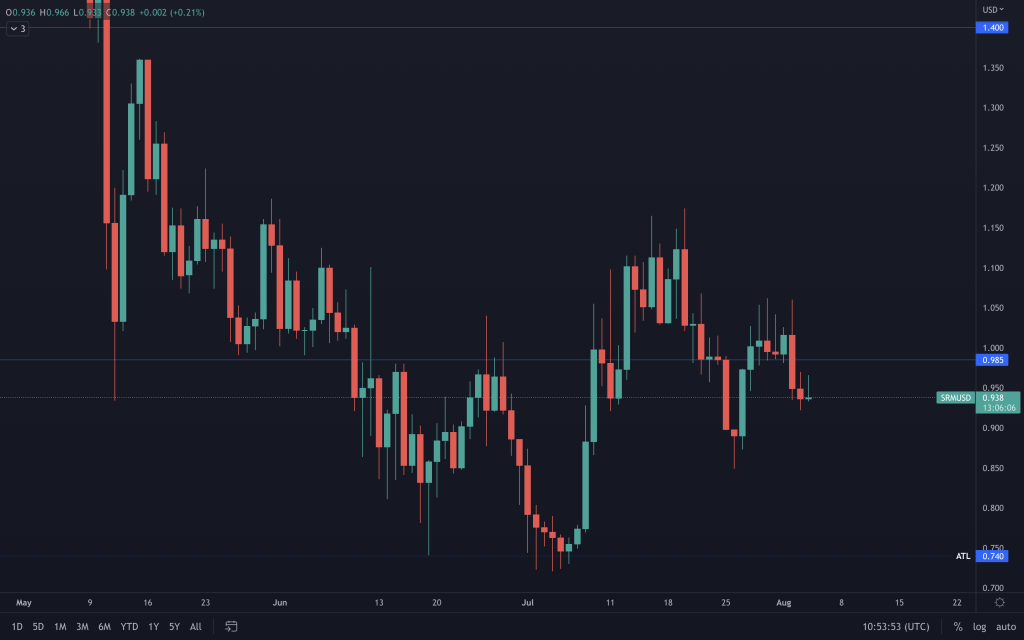
We've now seen yet another loss of $0.985. To couple the lower low and lower high, it looks like SRM is headed back toward $0.74. Invalidation? Trading above the lower high.
FTT
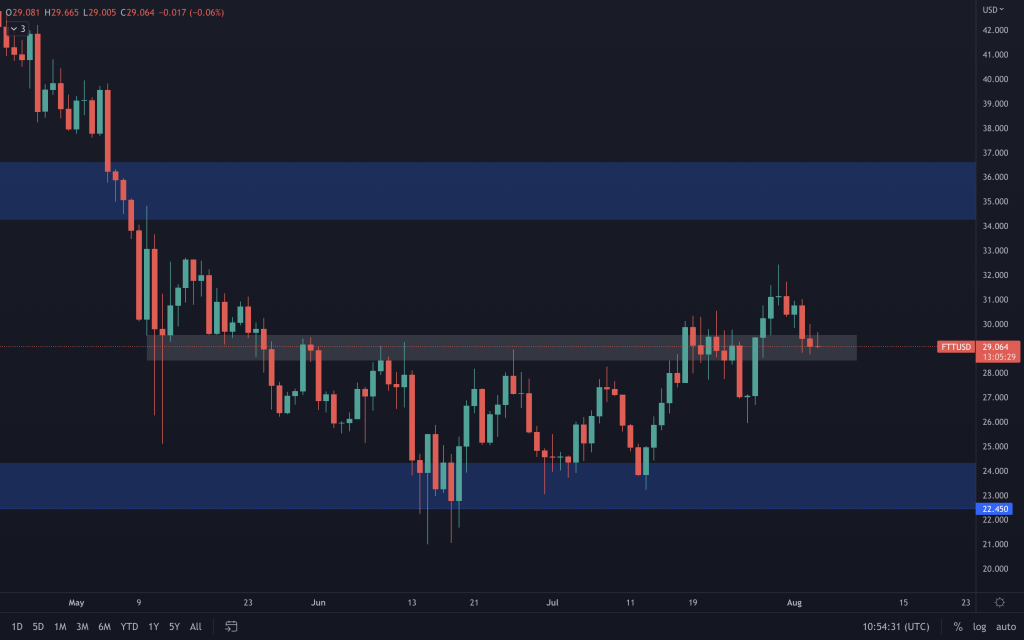
FTT is another altcoin with a bullish daily market structure. It's now back at the old support level ($28.50-$29.50). As long as this support holds, $34-$36 remains on the cards. A closure below it would risk negative price action, taking it back towards $22.50.
MINA
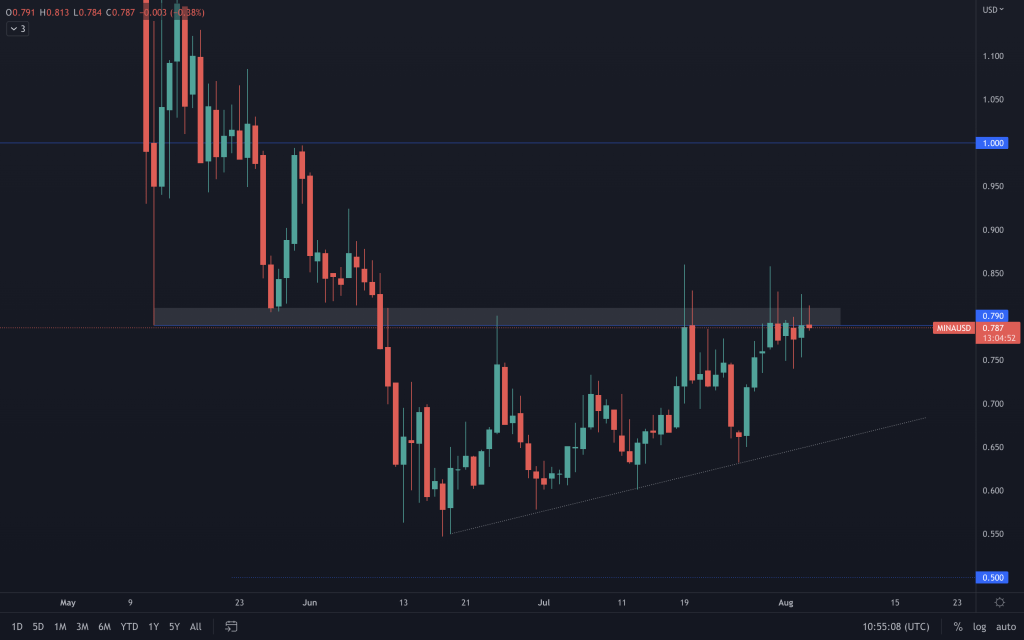
MINA needs a daily closure above $0.80. Then we will be able to look towards $1. Until then, it's proving to be a formidable resistance, where we'll also look out for a strong rejection candle, as that may have it heading back to support (currently $0.66).
dYdX
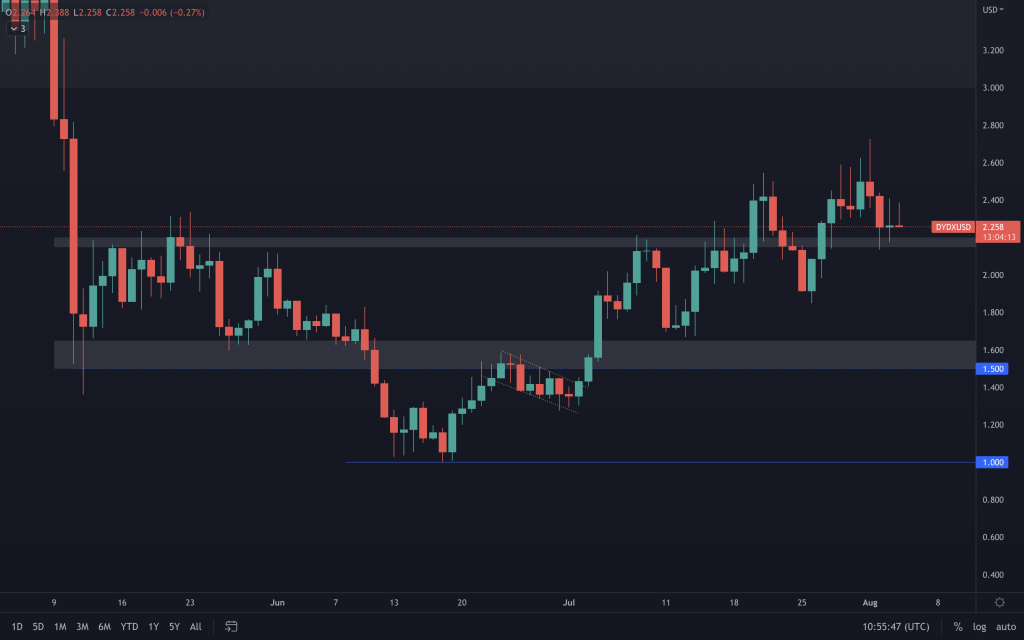
Indecision rather than strength being shown at support. Staying above $2,15 and $3 remains its potential route. However, after a 170% pump with little-no weekly pullbacks, the risk of a long has significantly increased.
Recommended from Cryptonary


