Save 23% ($351) & Get a Free 1-1 Call with our Team ⏰ : 0d 2h 59m 43s
Disclaimer: Not financial nor investment advice. Any capital-related decisions you make are your entire responsibility and yours only.
Video Analysis
We've covered many more assets in the video version this week, so be sure to watch the video!
Total Market Cap
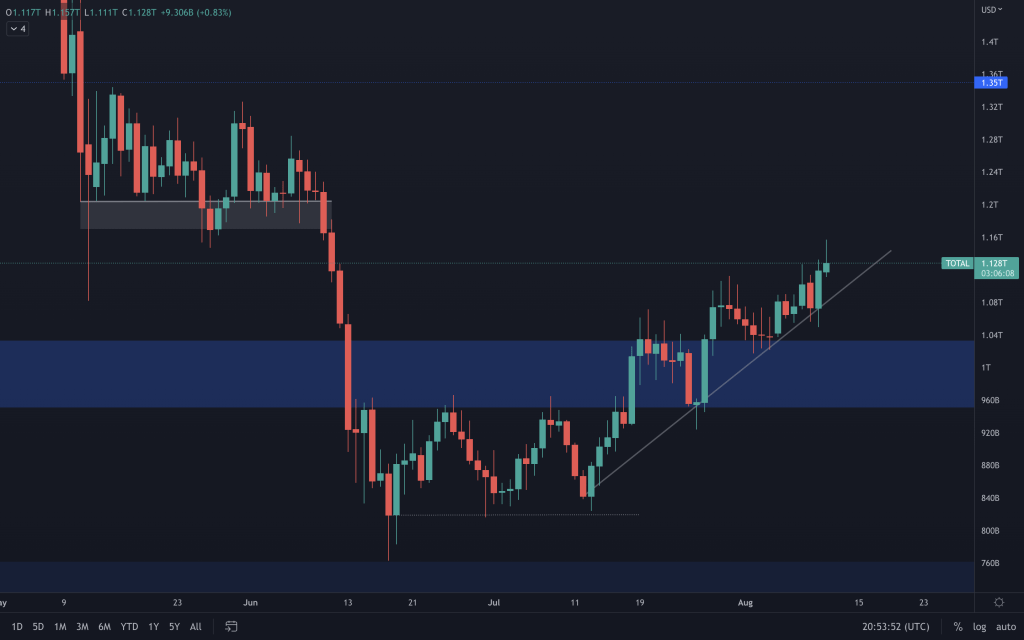
With the Total Market Cap remaining in an uptrend, we're seeing this reflected across the board. $1.17T-$1.2T will be the first region in which the market may encounter 'resistance' due to the previous action around this region. Whilst the index remains above $1T, $1.35T is still on the cards. Don't forget that this isn't a tradeable asset and is only something we observe to understand the market's direction.
Bitcoin
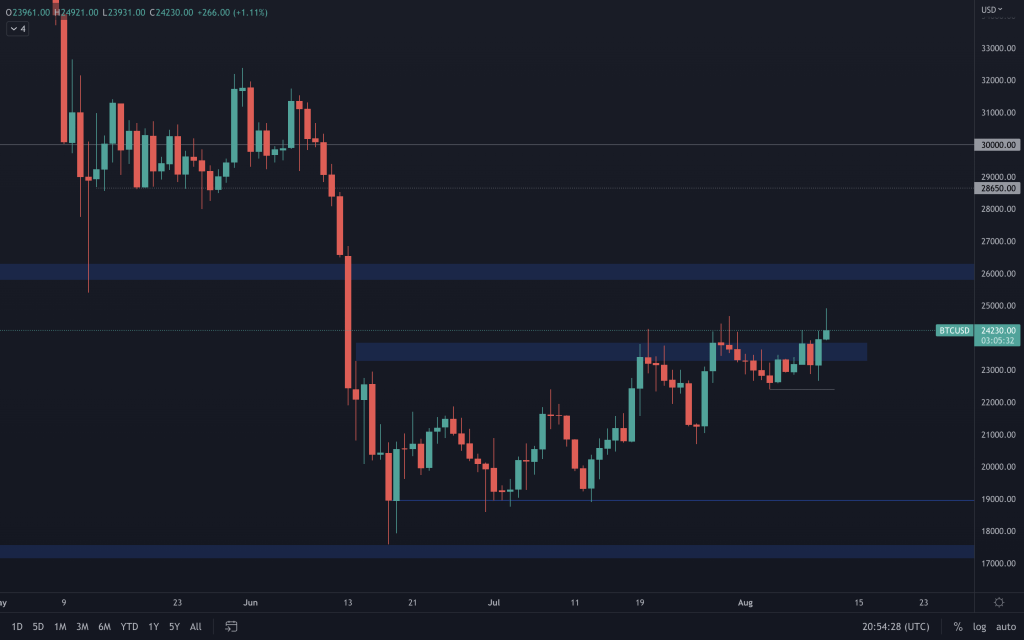
Yesterday's candle closed above $23,850 and bullish engulfing. As a result of the closure, we've seen its price continue to rise, which has already taken it to highs of over $24,900. Volume remains unimpressive, though. So it's ever more important to have proper risk management for any trades you may be taking, particularly longs. Be that by trailing your stops or booking some profits along the way.
Ether
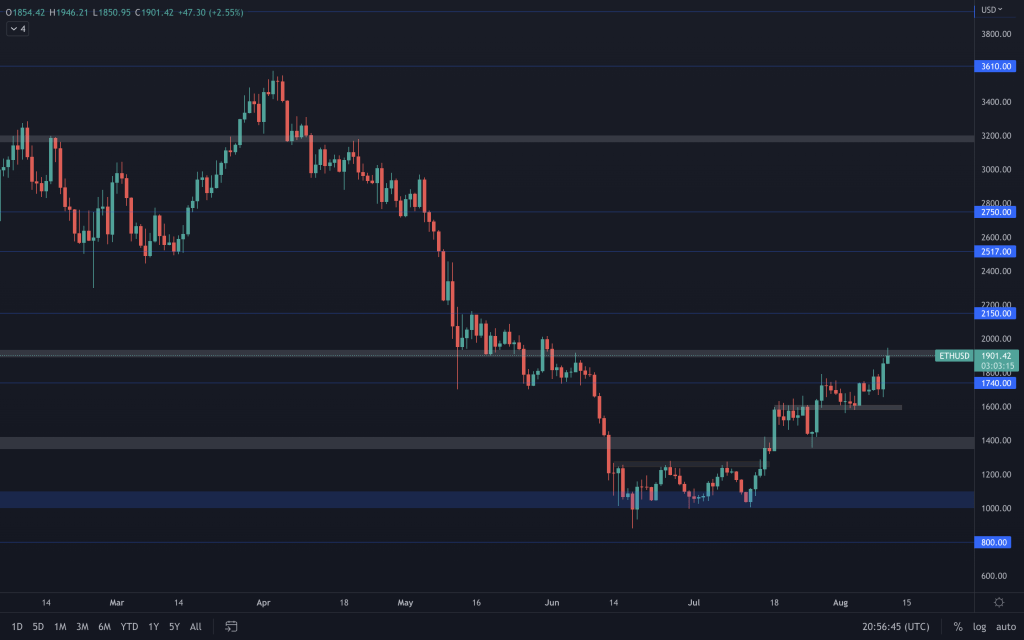
We've finally got a date for The Merge! 15th-16th September 2022. Much of this rally has been fuelled by the recent steps that Ethereum has been taking to transition from Proof-of-Work (POW) to Proof-of-Stake (POS). So, let's take a look at the chart... The volume displayed on Ether, in comparison to Bitcoin, has maintained daily levels that support the price appreciation we are witnessing. Ether has consistently maintained a daily bullish structure (one we've highlighted along the way). Until there's an indication of that changing, we can't assume that this move is exhausted. But longing from here, at this point, doesn't make sense and comes with heightened risk compared to early longers. Yesterday's candle closed as a bullish engulfing candle but failed to close above $1,935, keeping ETH in a range between $1,740 and $1,935. A closure above $1,935 should see Ether moving up towards $2,150. Failure to do that, and we'll be looking towards $1,740 to hold as support. Moving much below that and it will threaten the bullish daily market structure. We'll talk more about this in the video analysis.
Polkadot
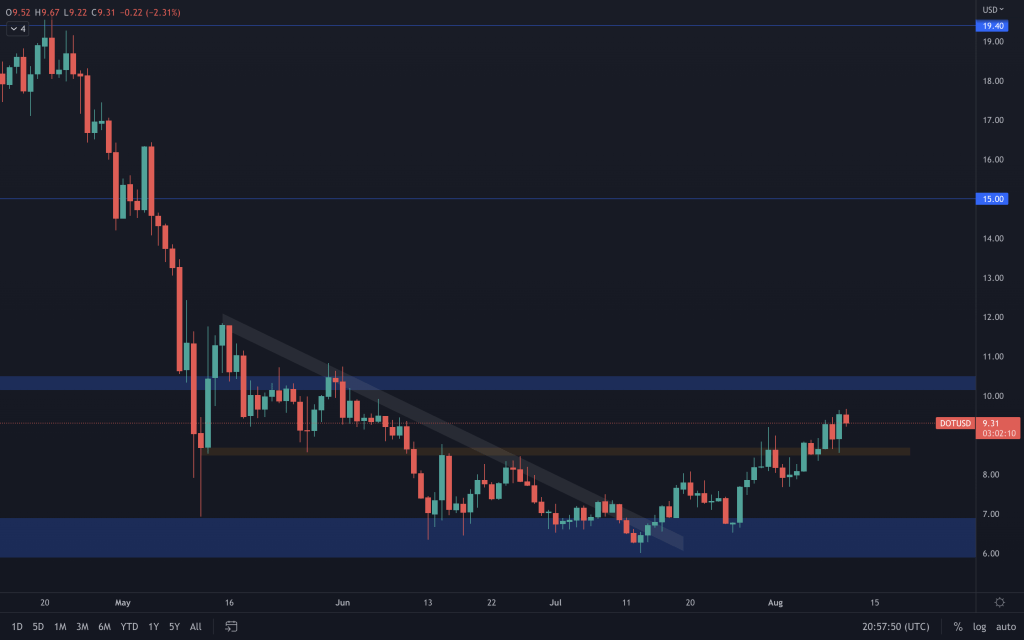
With $8.48-$8.68 holding as support and yesterday gave us a bullish engulfing candle, $10.15-$10.15 remains on the cards.
Synthetix
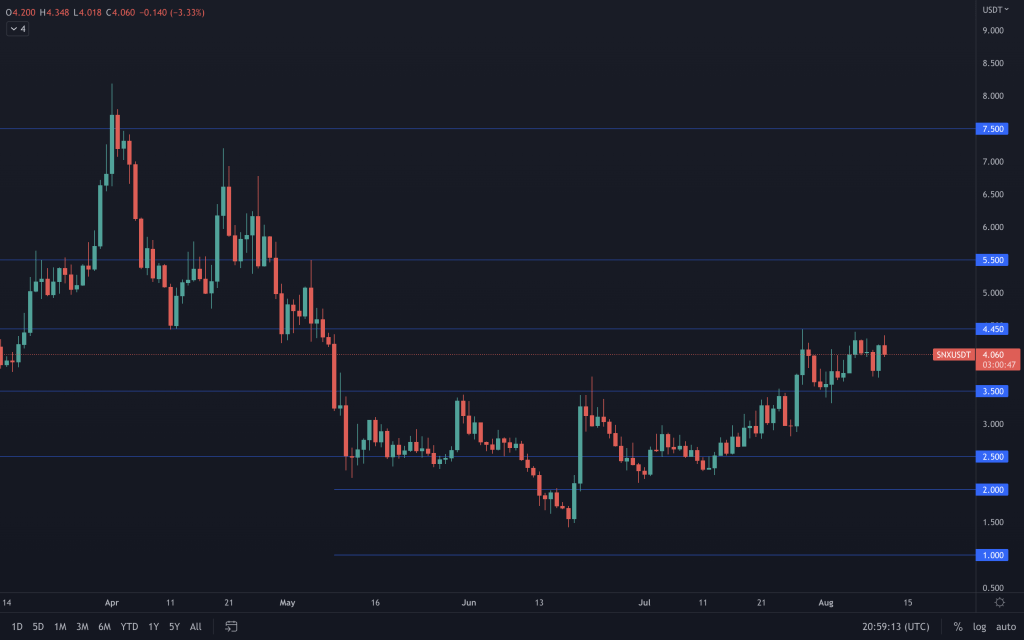
Since the end of July, we've been seeing ranging from SNX between $3.50 and $4.45. The weekly closure above $3.50 we mentioned we were looking out for last week materialised. This moves SNX into a weekly range that starts at $3.50 and extends to $7.50. With increasing volume behind its positive moves for the last four weeks, it does nothing to suggest that its price cannot continue higher. But it doesn't mean that the price just heads there either. There are daily resistances & supports involved, and, as we know, the market can turn in an instant as the majors play a controlling part in price action across the market. So, since the weekly closure, we have already seen SNX make an almost complete range move from bottom to top. It is still trending upwards but needs a break above $4.45 to signal to us that it is ready for higher prices. Therefore, the next move can be viewed as - a closure above $4.45, and $5.50 comes into play. Closing below $3.50 would begin to threaten the uptrend that SNX finds itself in, where we'd be looking towards $2.50 to act as support.
THORChain
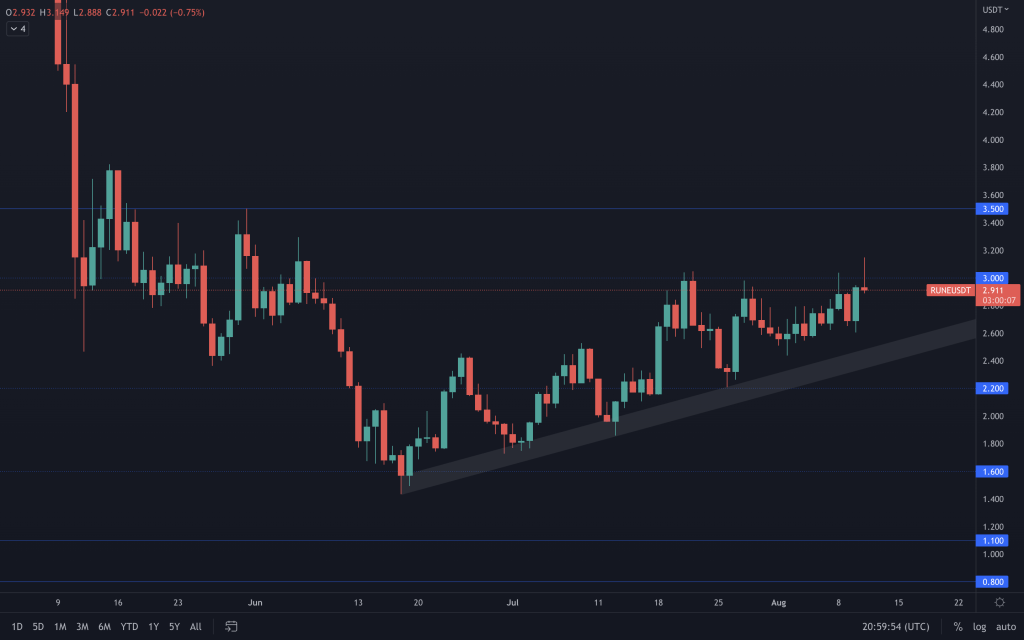
RUNE continues to have impressive volume, but it is a volume that has declined over the course of the last month as its price has appreciated - not what you ideally want to see. We're seeing $3-$3.50 presenting a challenge, as we expected, but higher prices have been helped up by a supporting channel. Closing above $3 would bring $3.50 into play, but a closure above $3.50 would be all the more impressive (if it can achieve that), as it puts $5.50 into the mix. Unless we see a strong rejection candle from resistance, a loss of the supporting channel would be the first sign of weakness.
Solana
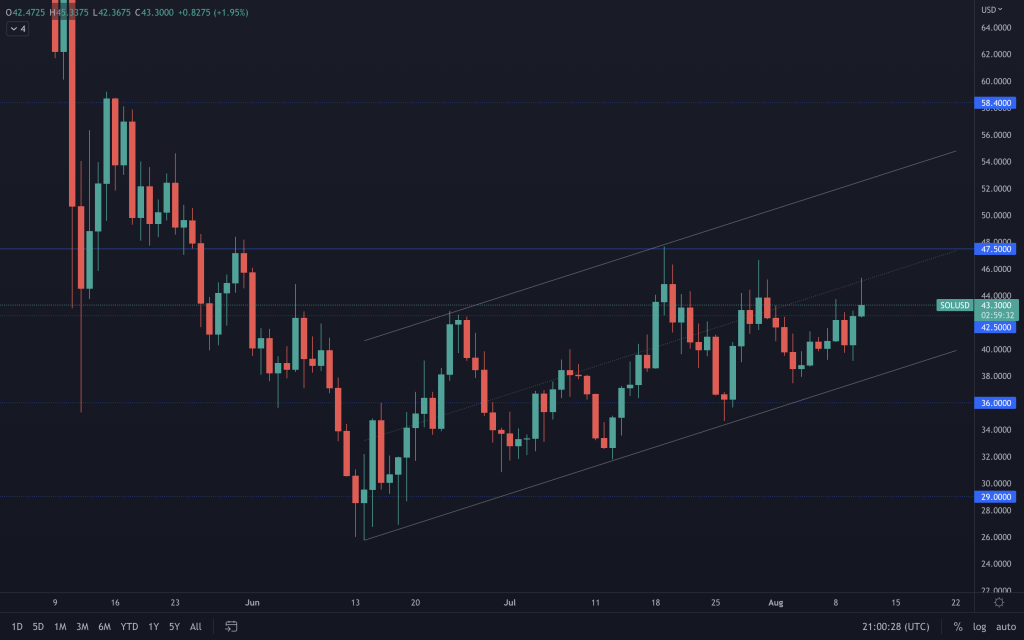
The ascending channel is where SOL is still at. Nothing has changed in our analysis of SOL for the past week. A weekly reclamation of $47.50 by candle close would look really good for SOL and have us eyeing higher prices. Until then, we're simply awaiting a breakout from the channel shown.
Serum
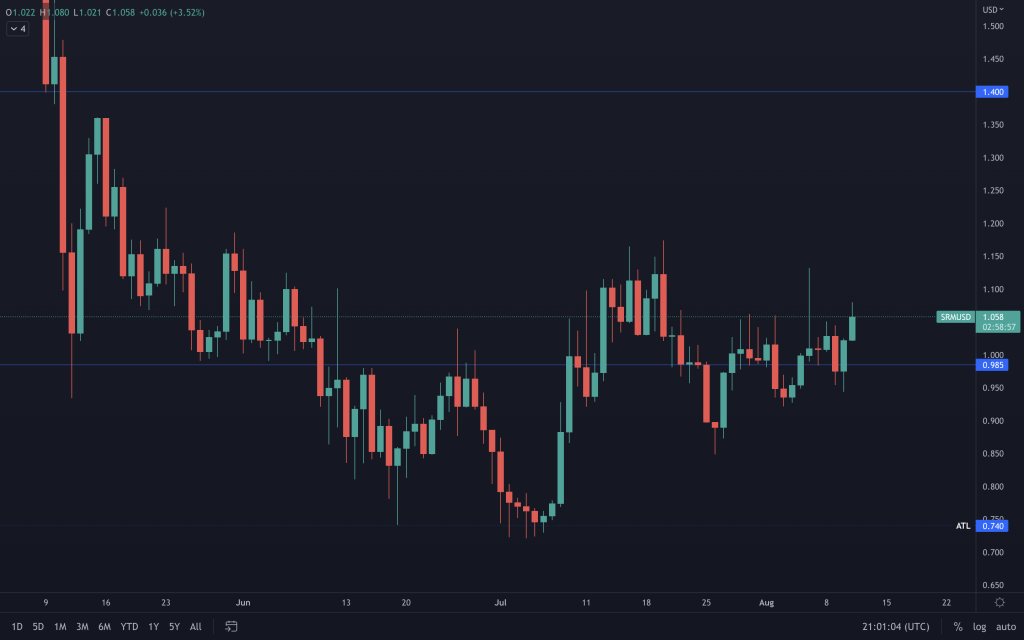
Horrible choppy price action and relatively low volume. Nothing new there for SRM, really. But as long as it trades above $0.985, $1.40 is in play. It also has its weekly candle structure supporting higher prices.
FTT
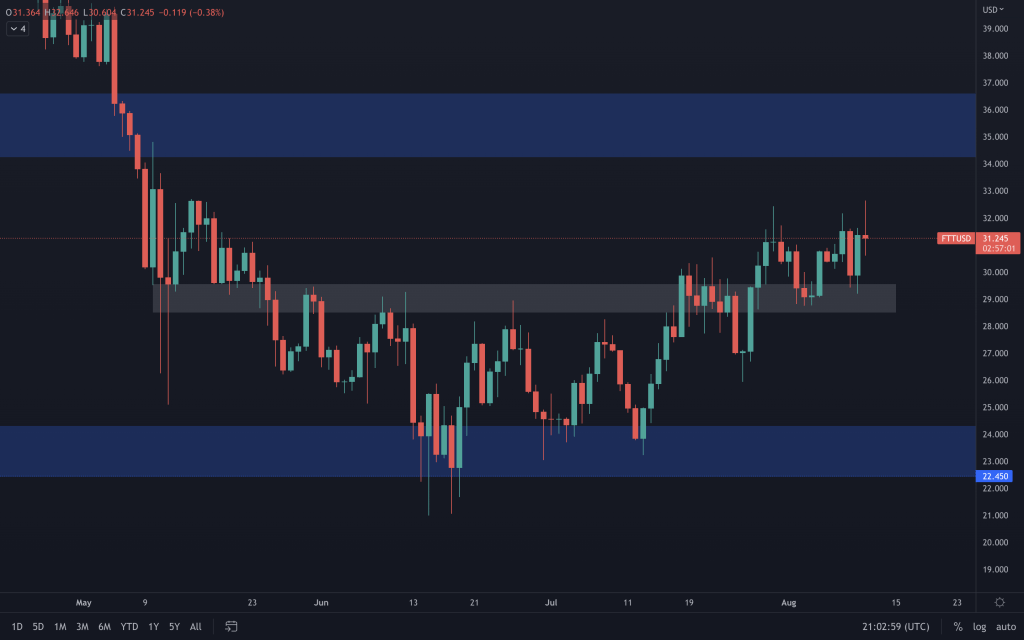
As long as the intermediate support holds, FTT can still achieve a move to the top of the range ($34-$36).
MINA
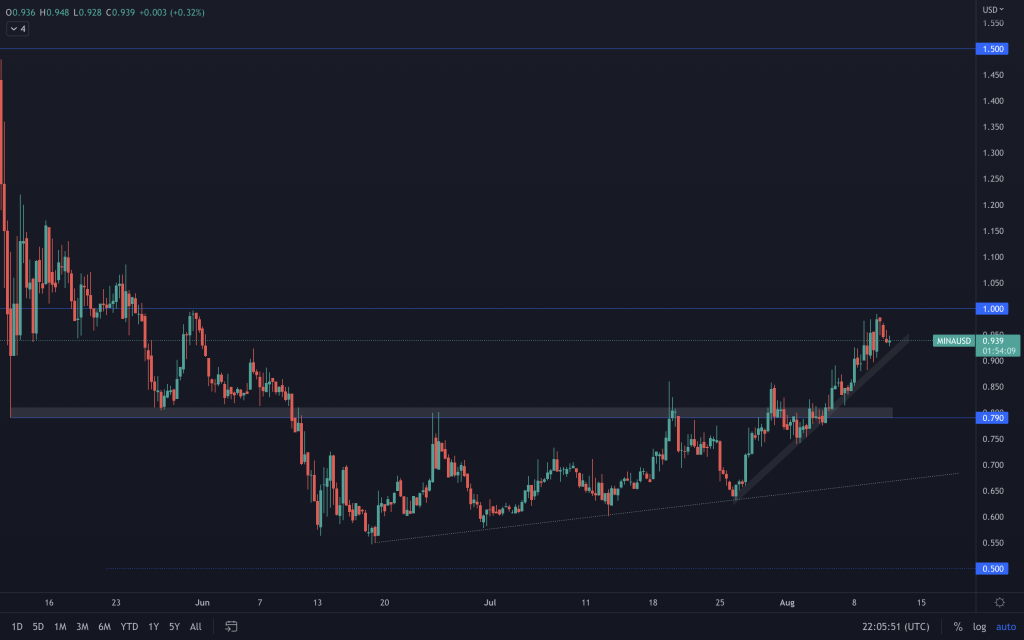
Even with a hanging man candle forming yesterday, we can't presume it as a reliable sign of weakness or that it signals an immediate reversal in price. After all, Bitcoin had closed in bullish territory. Some with a higher appetite for risk may have wanted to short right away; in this instance, MINA is -4%. But on the other hand, some traders may also wait for the next candle to aid in confirming a trend reversal or a loss of a support/trend line. Let's look at the 8-hour chart here for MINA. We can easily see a supporting channel that was retested multiple times, confirming its validity and holding MINA in its uptrend. If MINA loses this by a daily closure, then we could expect to see it heading towards its $0.80 support.
dYdX

Another asset with a supporting channel in play. Whilst dYdX is above this, $3 remains a possibility. A loss of it, and subsequently $2.15, will have us looking in the direction of $1.50
THORSwap
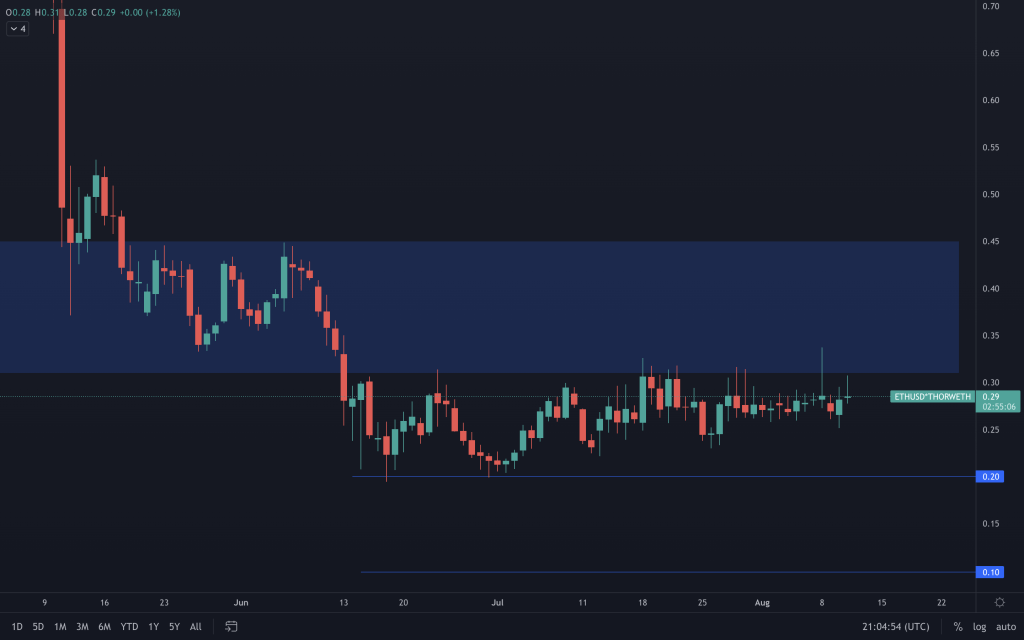
THOR has been moving sideways between $0.20 and $0.31 for what seems to be an eternity. Either way, only a closure outside this range will allow us to assess where it is headed next.
Recommended from Cryptonary


