Save 23% ($351) & Get a Free 1-1 Call with our Team ⏰ : 0d 2h 59m 44s
Disclaimer: Not financial nor investment advice. Any capital-related decisions you make are your entire responsibility and yours only.
Video Analysis
Open Interest
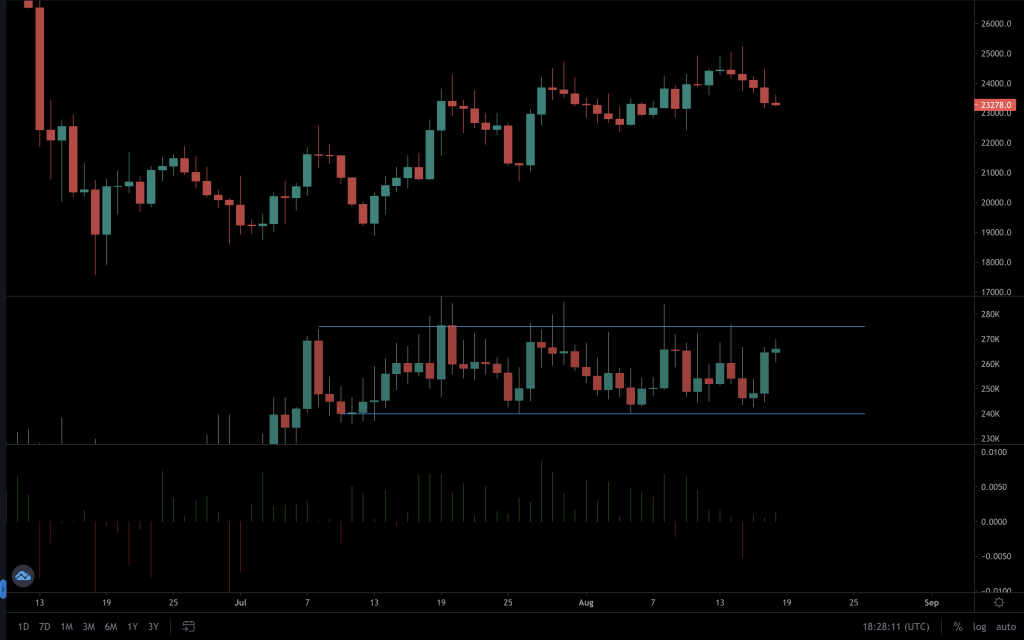
Last week's video analysis pointed out that the Open Interest (centre chart) isn't supporting an argument for longevity in Bitcoin's positive price action (top chart). One week later, nothing has changed. We'd want to see the Open Interest move into new highs as new trading positions open, showing confidence in the latest price action. The sideways range it has been in since the beginning of July presents an indecisive approach from market participants as they remain relatively neutral. With the Funding Rate being very close to zero, it also helps to reinforce the argument of indecision, as there is an almost equal amount of longs and shorts open.
Total Market Cap
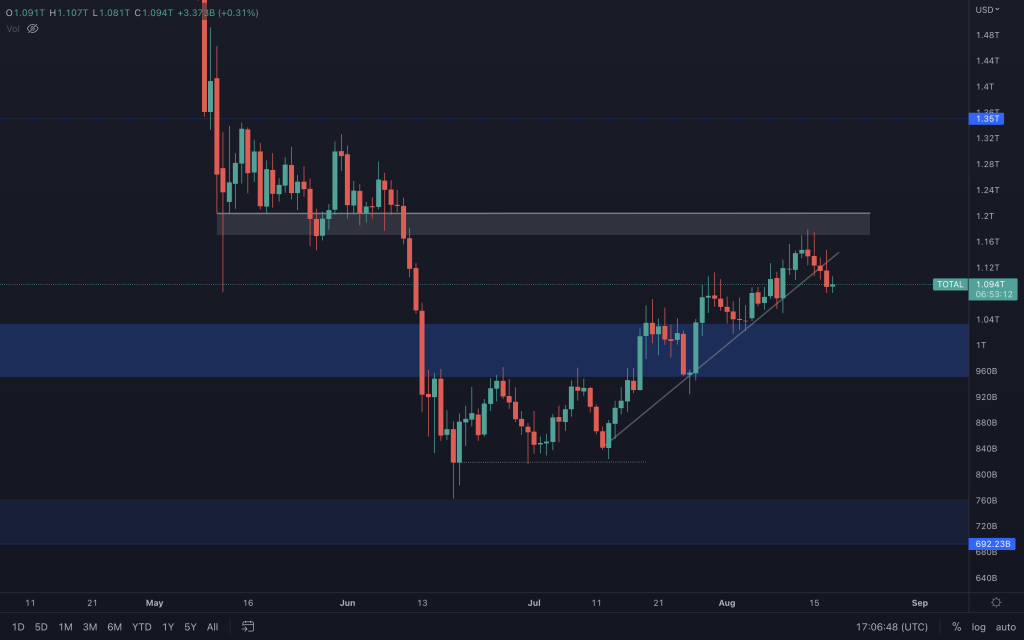
Many charts in this analysis have a supporting trendline in play and something that we will discuss for each chart - hopefully, it doesn't get too repetitive. Four days ago, in our daily analysis, we highlighted the potential for the Total Market Cap to retrace after meeting resistance at $1.17T-$1.2T. That's precisely what happened, and we've now seen its first daily closure below its supporting trendline. Two daily closures below it will confirm the loss. Although the daily higher-high/higher-low structure remains intact, the index may be preparing for a move to test support around $1T.
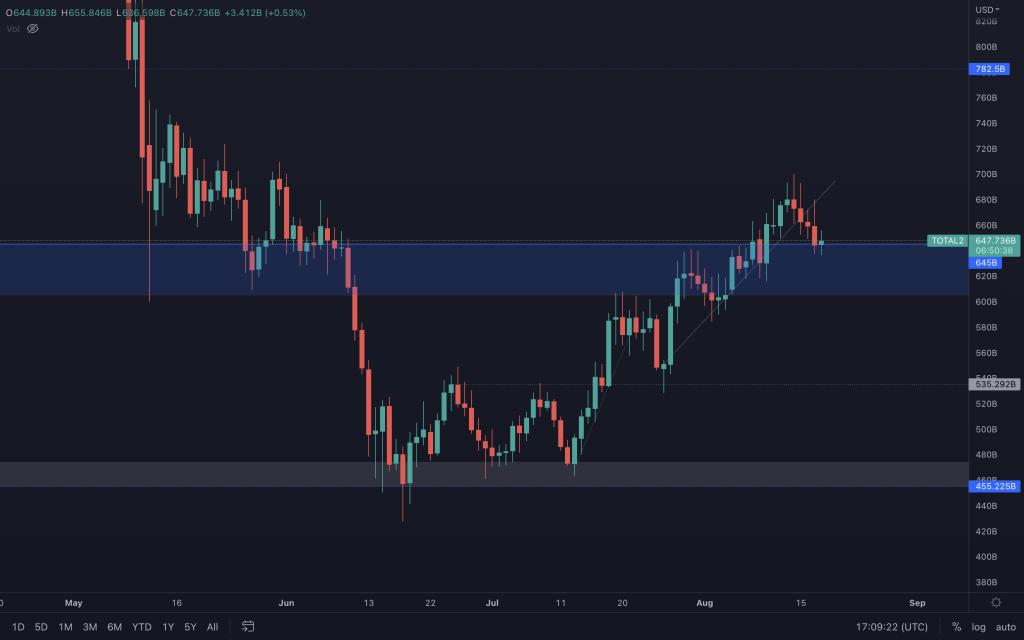
Altcoin Market Cap
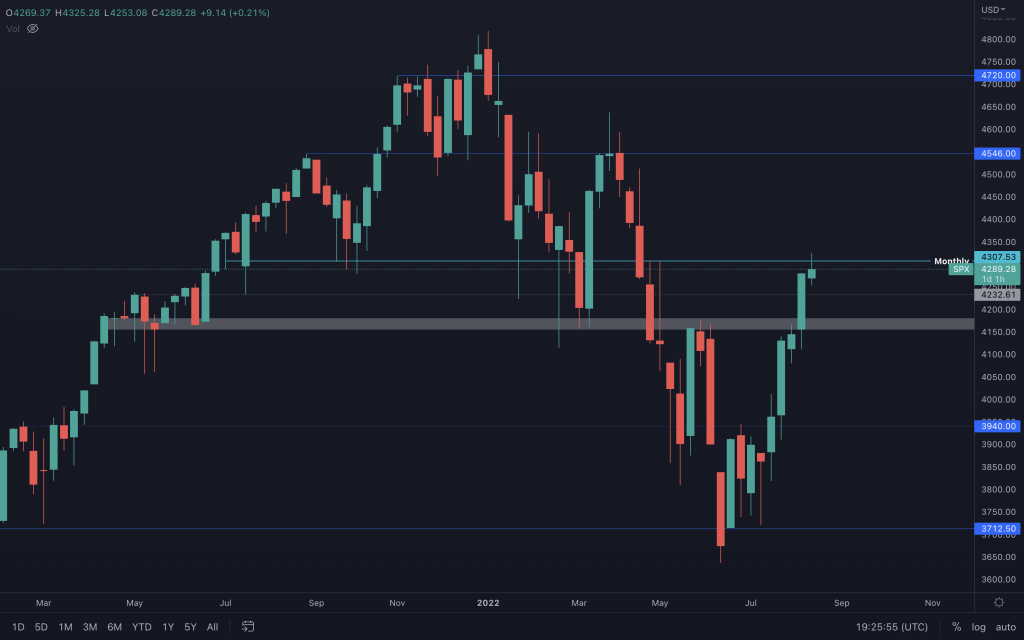
S&P 500 Index (Weekly)
Bitcoin
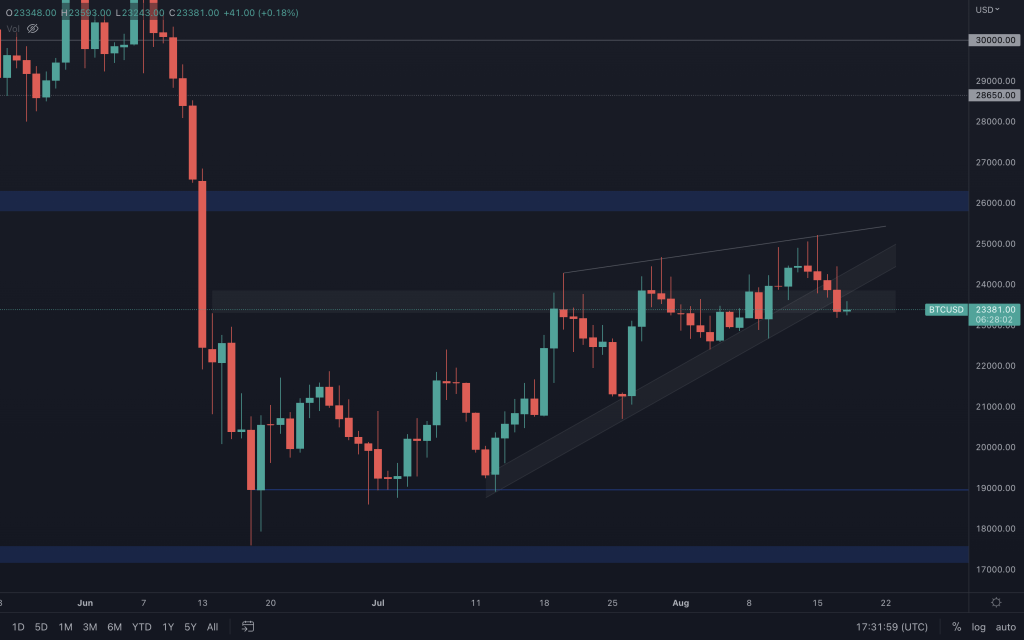
The decreasing volume whilst BTC rose in price doesn't give the strongest bullish argument and tells us that we should look for signs of a pullback at some point in the future. After all, increasing volume is key to supporting positive price action. Bitcoin has now broken downside out of the wedge, finding support at $23,300. The breakout technically targets $19,000, but support may be found before, potentially around $21,500. What the breakout hasn't done is alter Bitcoin's bullish market structure. So, unless that happens, there is a risk that this could be a fakeout to catch early shorters—something we need to be aware of. If Bitcoin cannot reclaim the trendline and we see the S&P 500 reject $4,300, we have to look at the levels we mentioned that are below the current price.
Ether
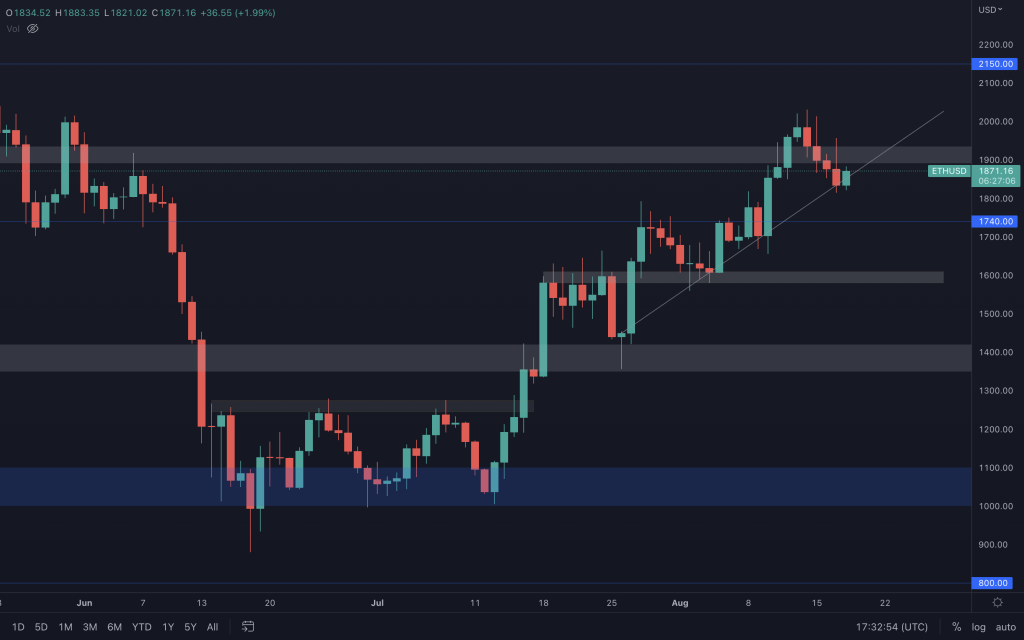
Ether continues to perform well. However, it failed to close convincingly above $1,935 last week, presenting us with a glimpse of weakness. Its daily chart is still looking positive as it takes steps up. But we must see positive price action continuing from here with a closure above $1,935 by the end of the week. Failure to do that and a loss of its supporting trendline will likely have Ether retest $1,740 and potentially even $1,400.
Polkadot
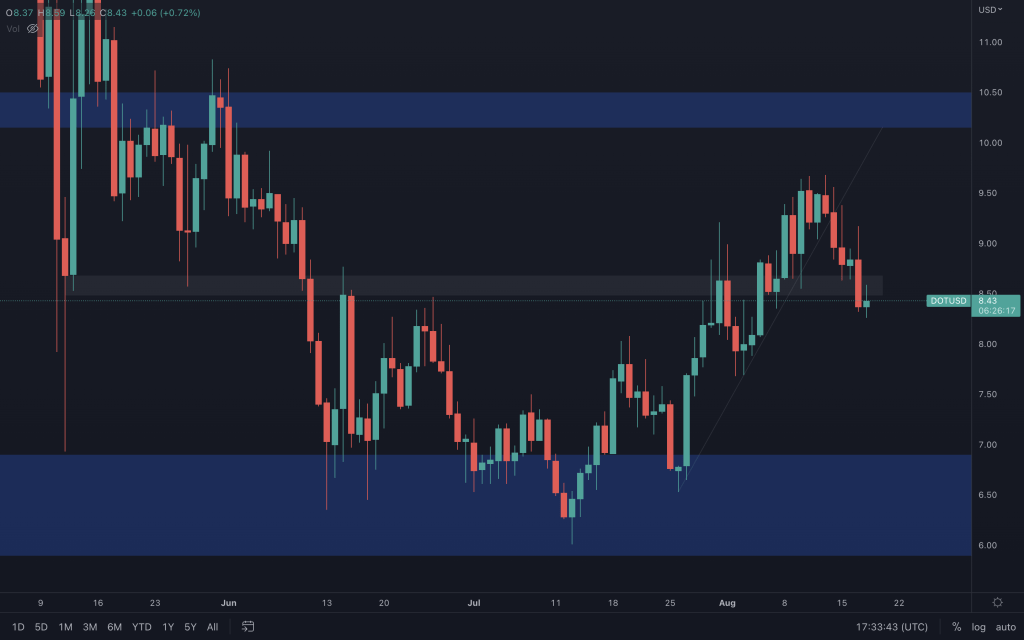
As we can see with DOT, it closed below its trendline, retested it as resistance and immediately moved down to its support. Yesterday's candle continued the downward momentum, closing bearish and below the lower end of its support range at $8.48, putting $6-$7 back on the table. As always, we have to have one eye on BTC because if this was to end up being a fakeout, DOT/BTC is approaching a support level that could potentially give it a higher low, voiding a move down.
Synthetix
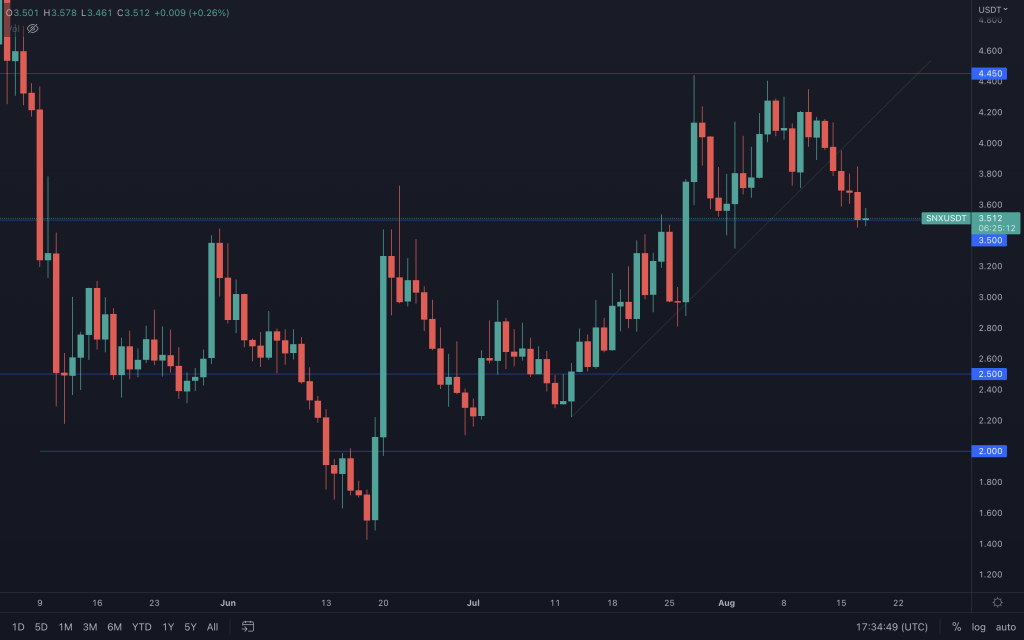
SNX's market structure has already turned bearish after forming a lower high, losing the supporting trendline to go on and create a lower low. Now, $3.50 is what stands in the way to lower prices. Closing below $3.50, certainly on the weekly timeframe, would have us looking at $2.50 next. Bulls will fight to keep hold of $3.50 by the weekly close as it is a significant level that took multiple attempts to reclaim. Historically, it is a proven level of support that gives SNX the opportunity to create a higher low. However, losing it would be a blow to the bulls as it brings $2.50 into play once more.
THORChain
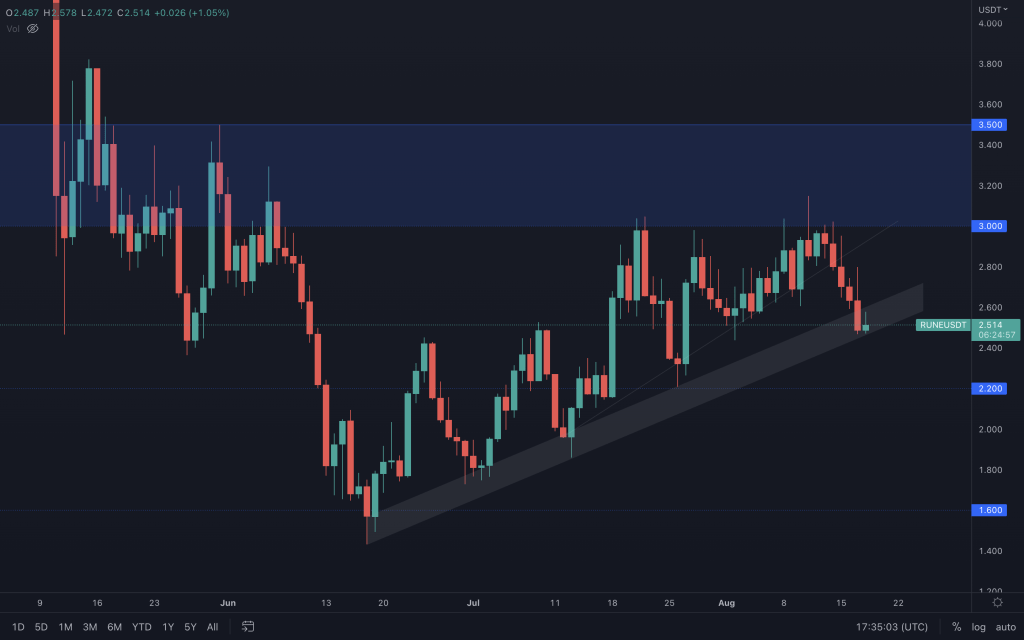
RUNE is hovering over its primary supporting channel. Each test of this channel has led to a quick and impressive appreciation in price. For that to happen again, we'll need to see Bitcoin pump from here because RUNE/BTC isn't looking particularly strong.
Solana
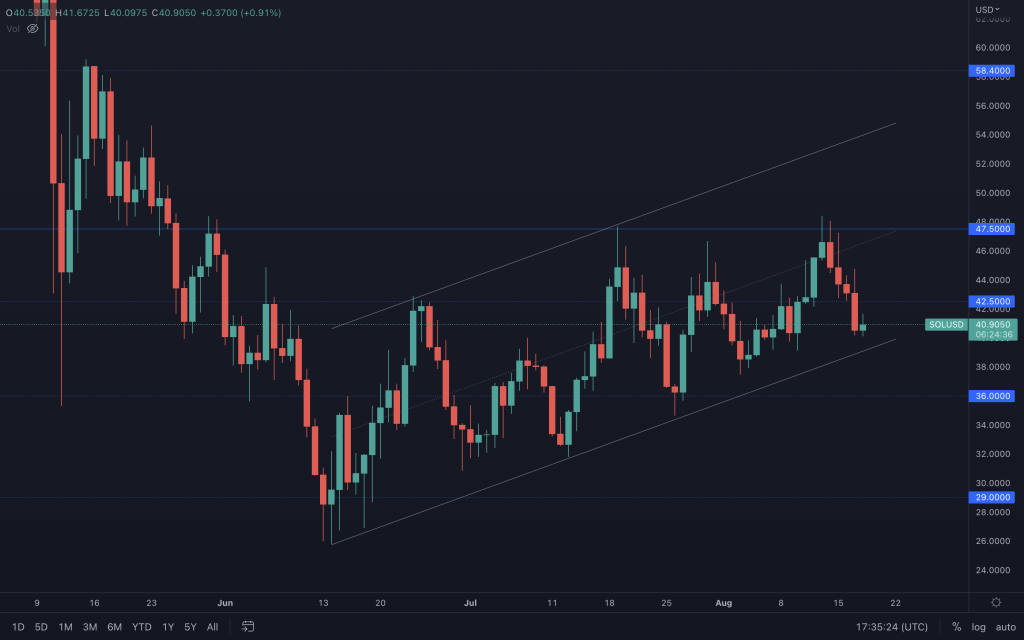
Whilst SOL trades within the ascending channel, there's not much to say. We simply await a break out from the channel to indicate its next move.
Serum
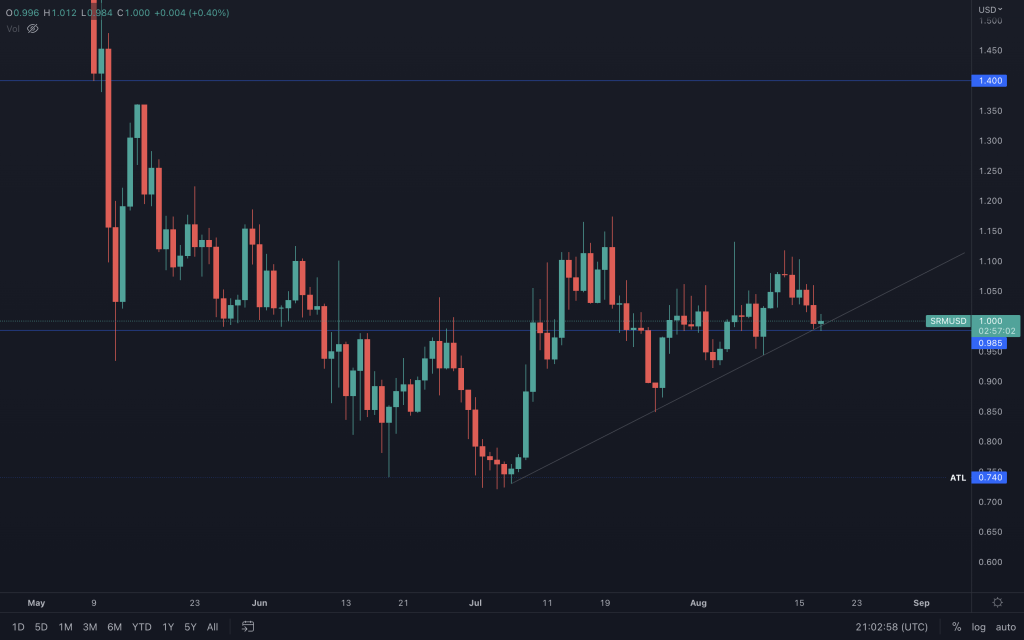
We're still keeping our eyes peeled for anything that takes SRM away from choppy price action. Right now, it's respecting the trendline and trading above £0.985.
FTT
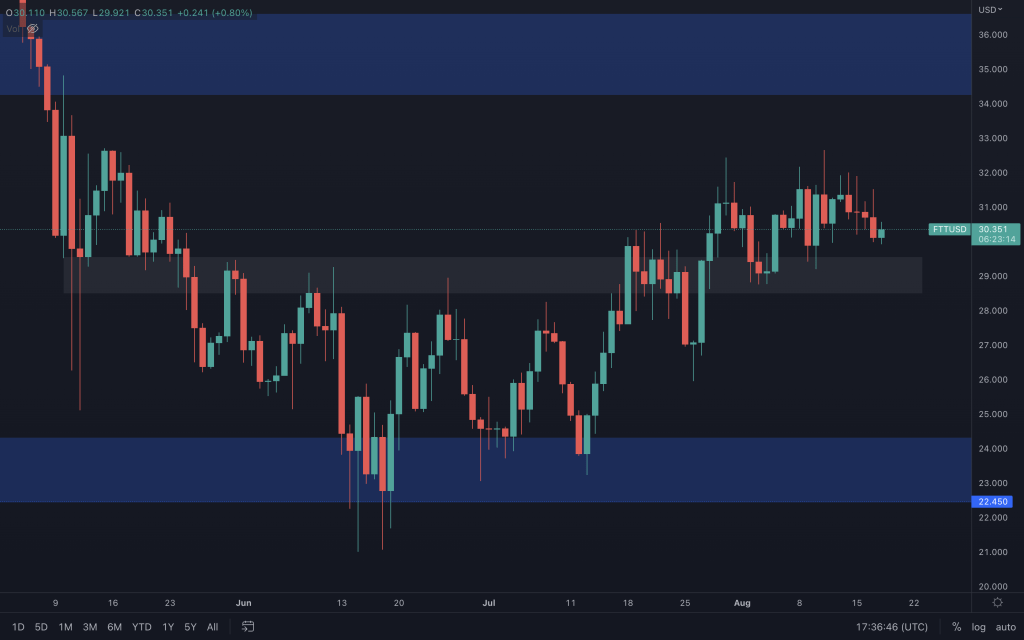
Whilst FTT is still above $28.50, a move up to $34-$36 hasn't been invalidated. We wouldn't engage in a trade at this point, though, as FTT's past two weekly candles present an image of indecision along with the daily chart.
MINA
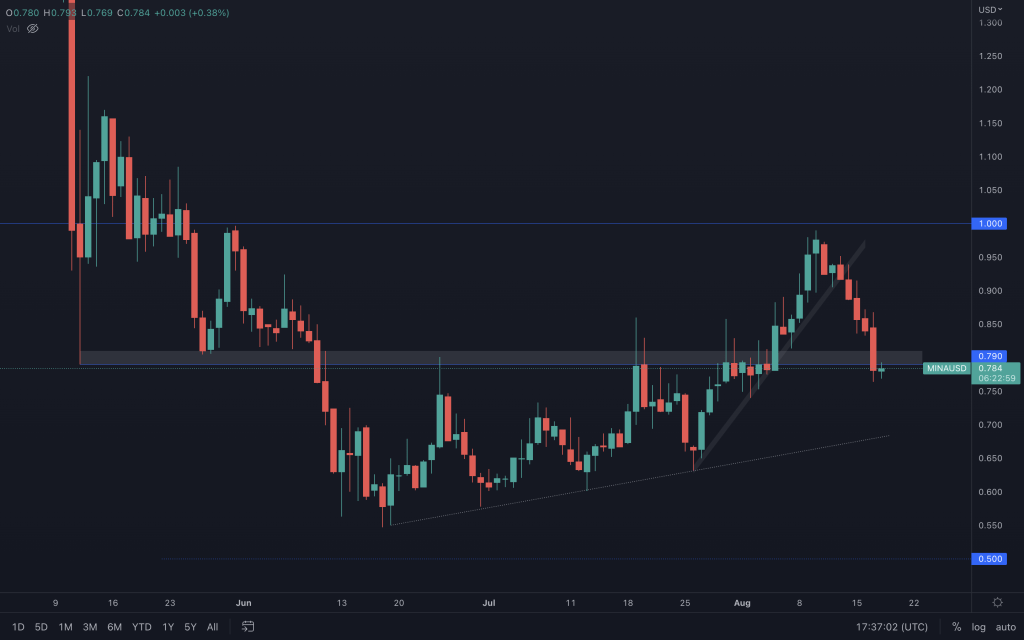
MINA lost its trendline and headed straight for support. Now it has had a daily closure below $0.79, that brings a retest of the primary trendline into play (currently around $0.68).
dYdX

After losing its trendline and support, dYdX continues on its path towards $1.50. It could potentially see a little relief at this point (mid-range support), offering another chance for traders to short.
Recommended from Cryptonary


