Save 23% ($351) & Get a Free 1-1 Call with our Team ⏰ : 0d 2h 59m 44s
Disclaimer: Not financial nor investment advice. Any capital-related decisions you make are your entire responsibility and yours only.
Video Analysis
Total Market Cap
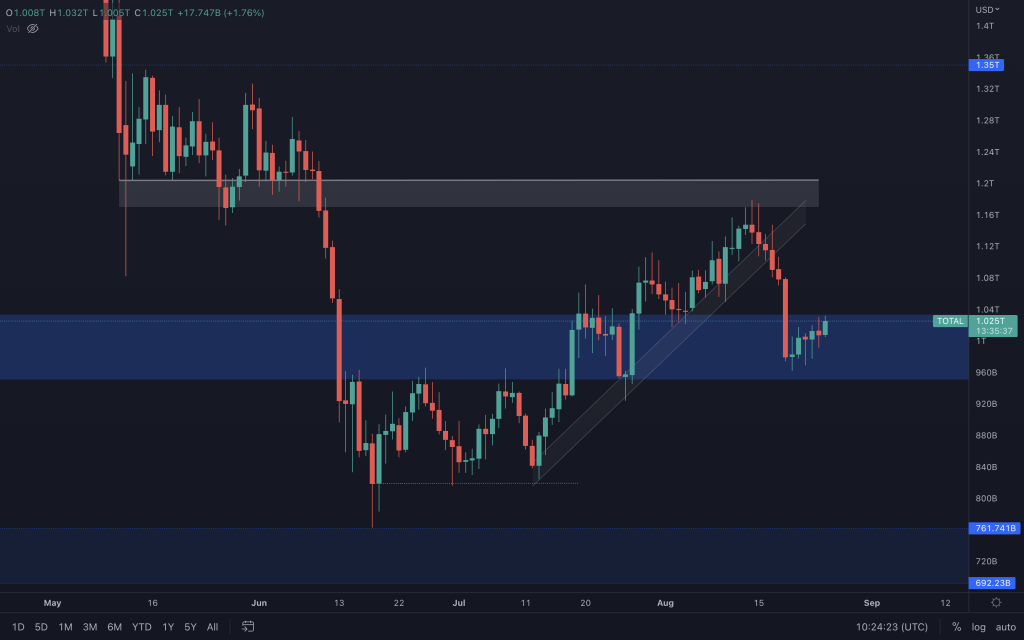
A bearish engulfing weekly candle is never nice to see as it shows that bears remain ever present, taking profits from any relief the market sees. We highlighted the potential of $1.2T being a resistance level and losing the supporting channel showed a shift away from the upside momentum the market had seen from the previous lows. The weekly candle closed within the support range ($950B-$1.03T). So from this point, to see that bears still have a hold over the market movements, losing $950B is what we'd need to see next. Without that, there is still hope for bulls.
Altcoin Market Cap
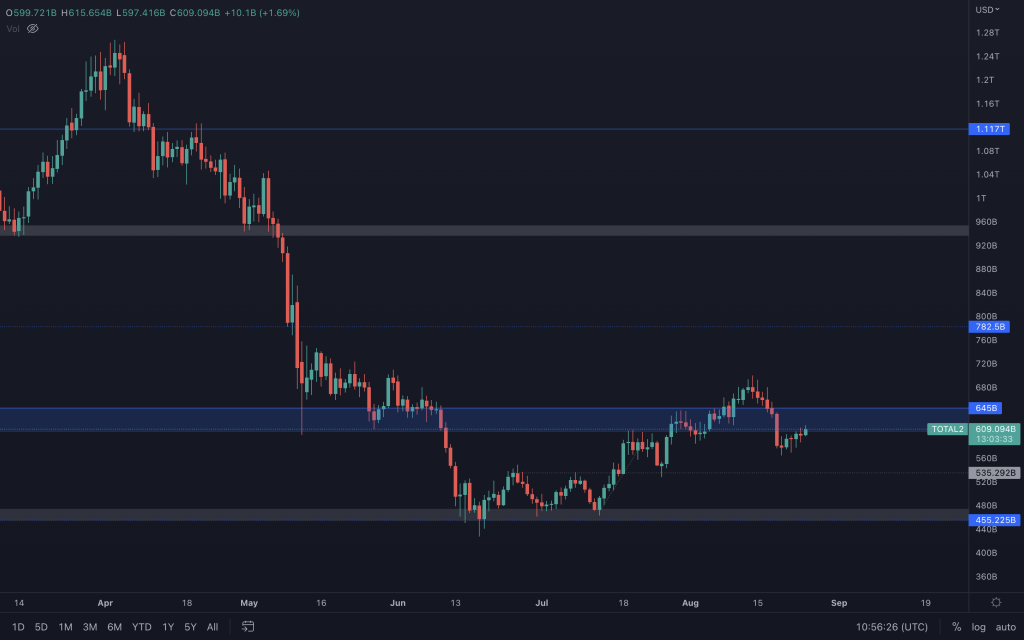
The Altcoins' Market Cap is in the opposite situation to that of the Total Market Cap, so it does have its work cut out. Yes, it has a weekly bearish engulfing candle and a daily lower low, but it couldn't manage to hold onto $600B-$645B as support. This leaves altcoins vulnerable to adverse movements from Bitcoin unless/until we see $645B reclaimed.
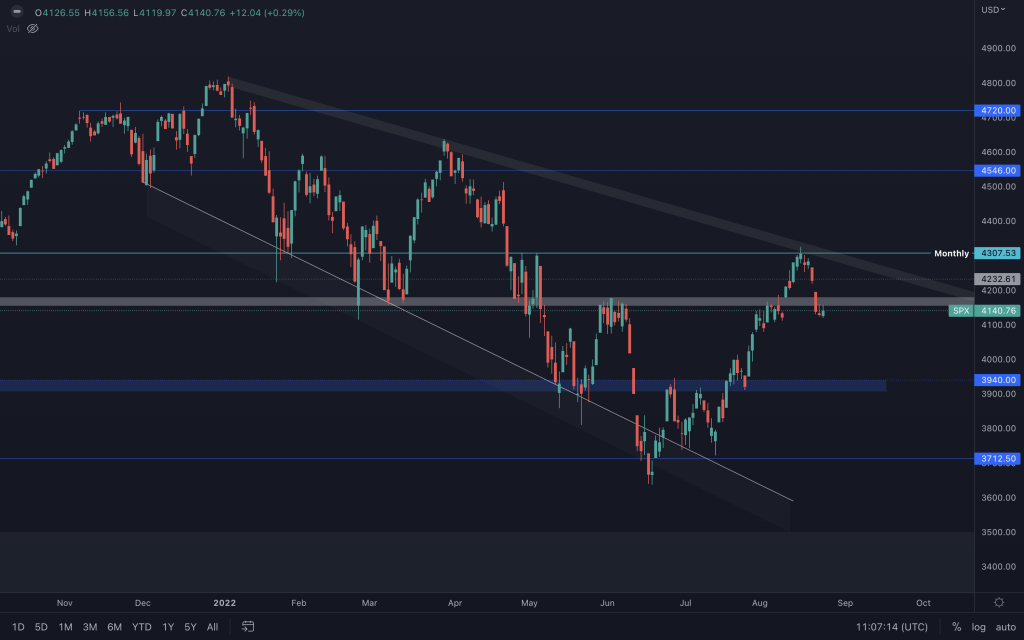
S&P 500 Index (Weekly)
Bitcoin
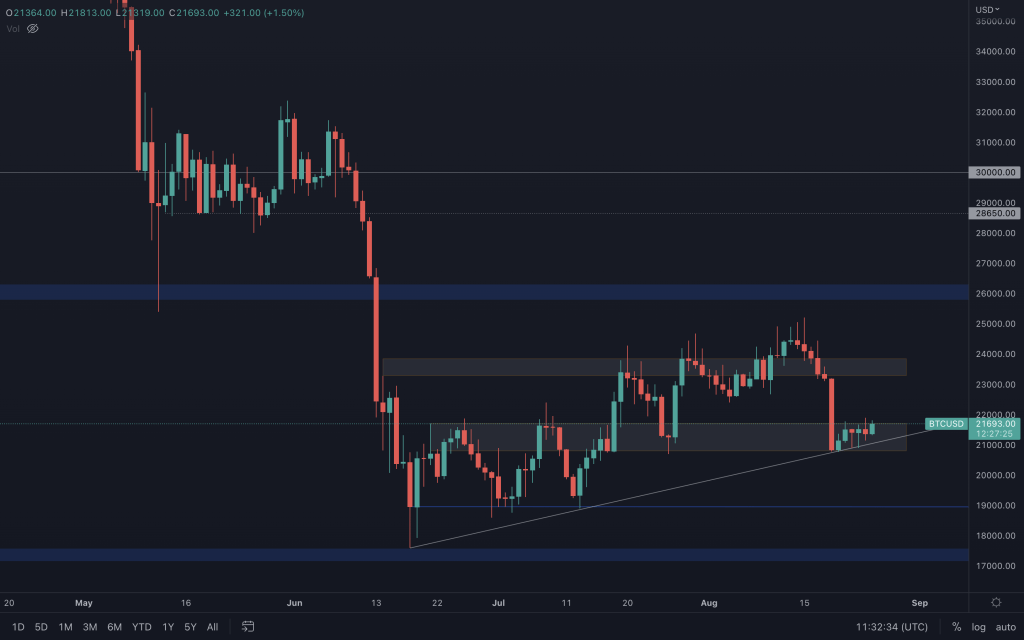
Bitcoin is moving slowly and mainly within the support range we've identified. We should expect volatility over the next two days. Close below the supporting trendline, and we can expect Bitcoin to head towards $19,000. Conversely, a daily closure above $21,700 can offer relief up to $24,000. If there are any surprises, expect the market to react to the data coming from the US.
Bitcoin Dominance (Weekly)
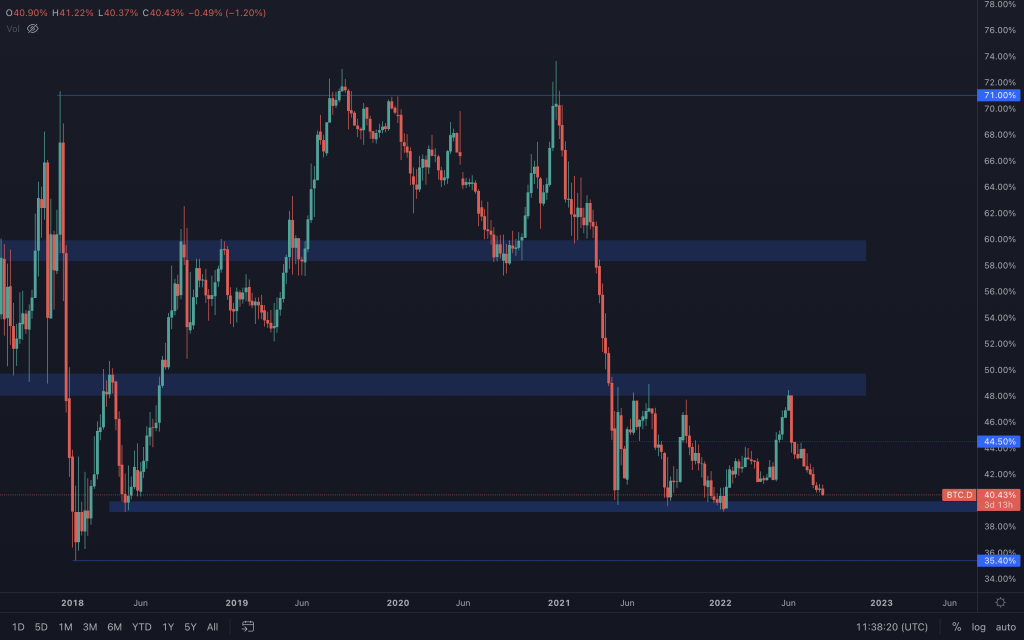
Bitcoin Dominance is approaching a key level of support as it has moved sideways between 40% and 50% since May '21. We have previously mentioned this in detail in our daily analysis, but assuming this level continues to offer support, we can prepare for one of two outcomes.
Bitcoin dominance rises from a bullish Bitcoin as new funds mainly flow into the orange coin. OR The market drops with funds flowing out of altcoins quicker and into Bitcoin and stablecoins.
Ether
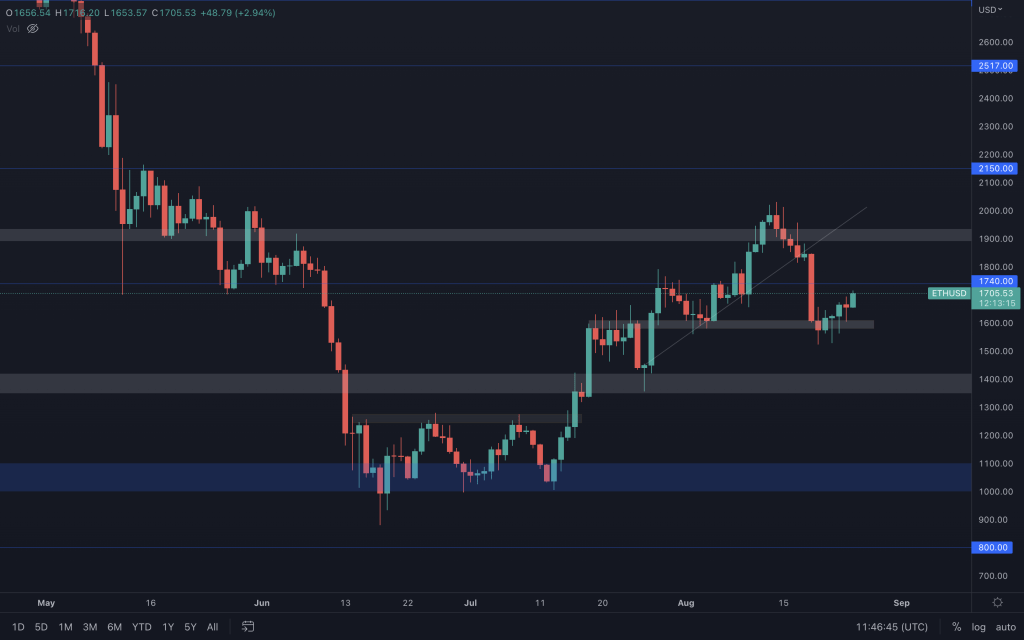
Ether continues to push up towards $1,740, and it is reasonable to look out for signs of weakness between here and $1,900, especially after how last week's candle closed (bearish engulfing and a lower high). Should we see no signs of rejection, to show strength, Ether needs to close back above $1.935
Ether Dominance (Weekly)
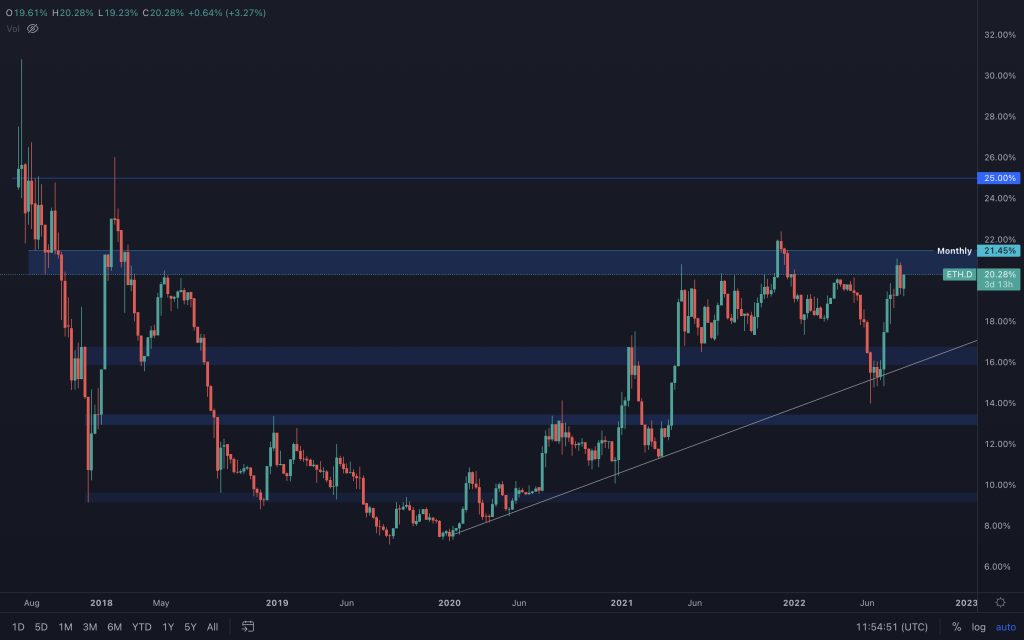
We've seen the daily market structure form a lower high that gave us a weekly rejection on the first attempt at resistance. Another lower high from here with a move below 19.3%, and I'd expect ETH's dominance to head lower towards its key support level/supporting trendline. Of course, the other level to watch is very close too, and that's 21.45%. Turn that into support, and Ether may have a nice run up ahead, especially with the Merge around the corner.
Polkadot
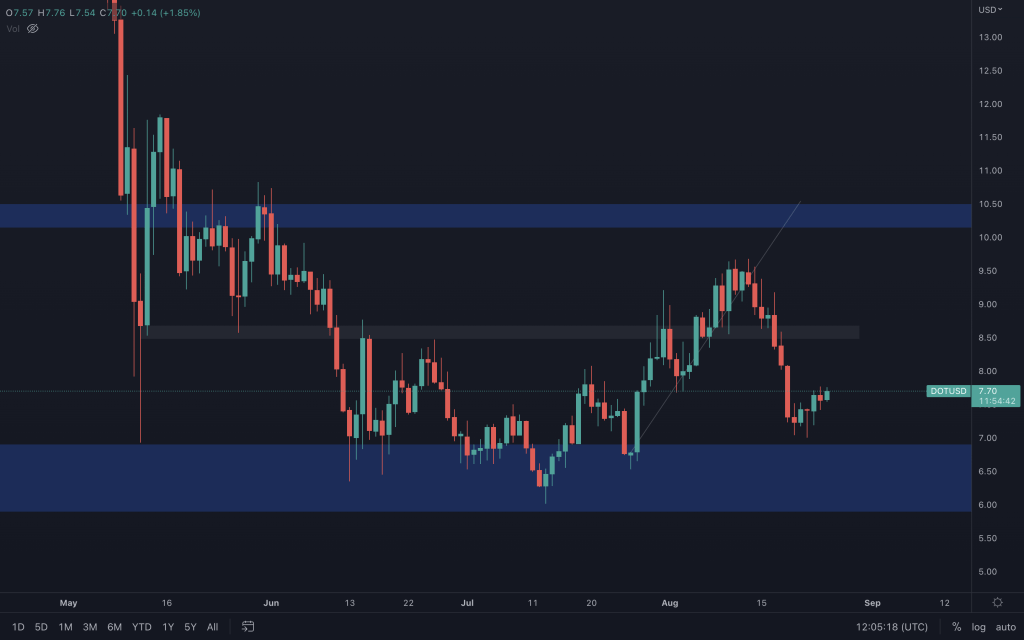
DOT sees a little relief after retesting $7, but it's nothing more than that after catching the big move down. Yesterday's candle shows a little indecision as we can see that DOT reached a price that it wicked to in the first couple of days of August. The stock market and majors will greatly influence altcoins for the rest of the week, so they are where I'd be focused.
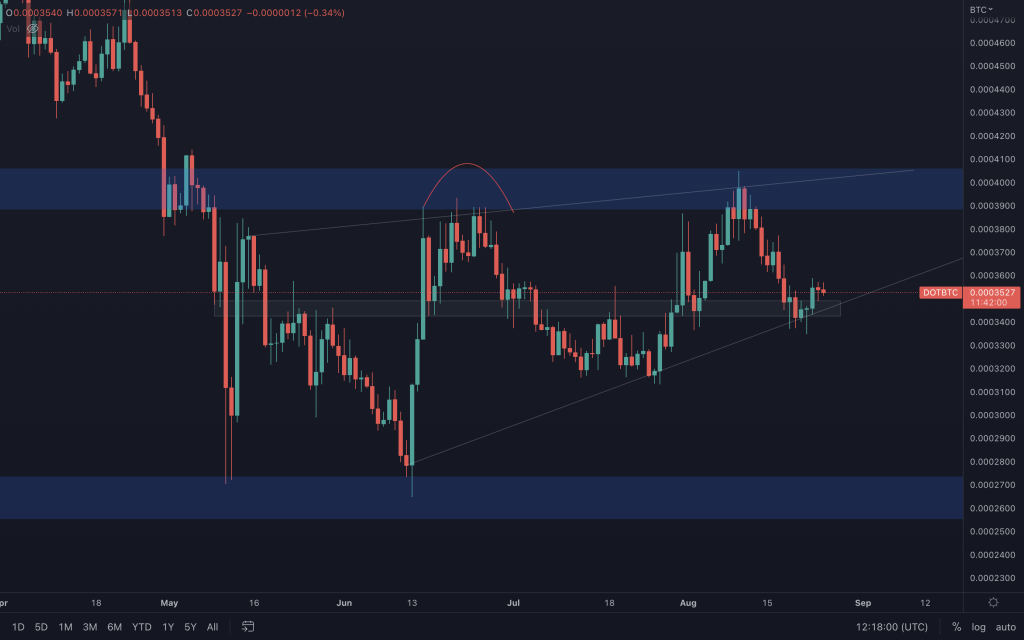
DOT/BTC
Synthetix
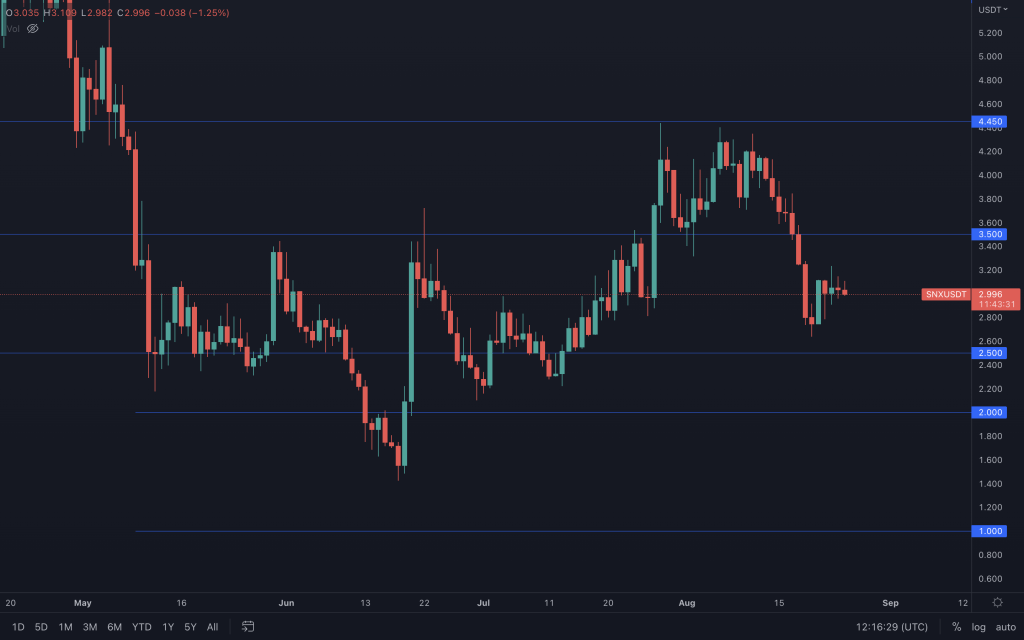
SNX is simply mid-range, so there's not much to say about it at the moment. The morning star formation displayed after the move down could give it the kick needed to retest $3.50, but the last two days of indecision put that into doubt as the market awaits a clear indication from the majors. Only a reclamation of $3,50 would have us begin to look at higher levels again. Right now, $2.50 is still on the cards.
SNX/BTC
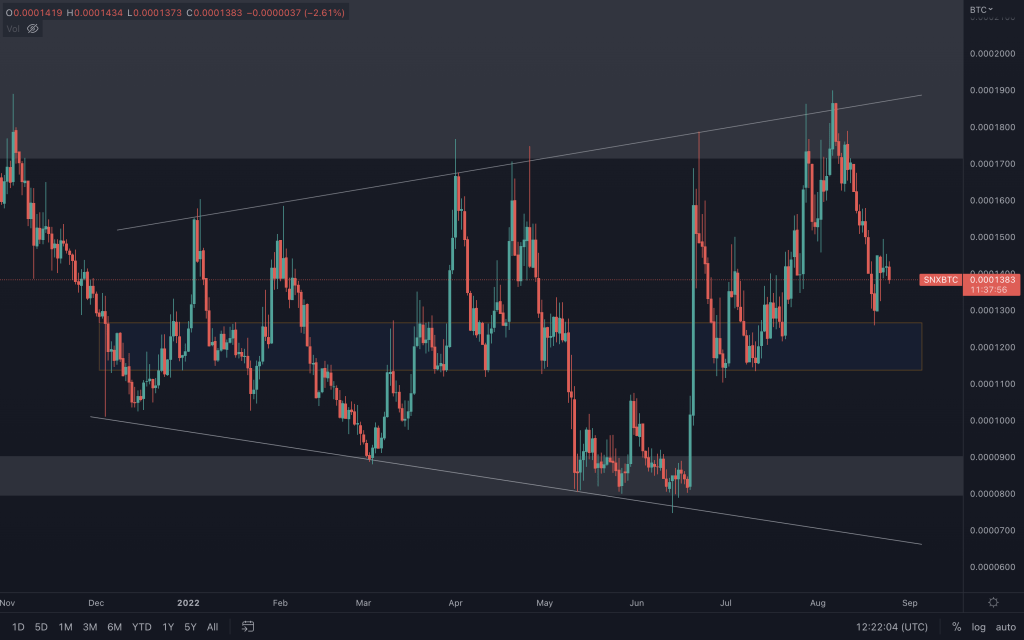
SNX/BTC is at its mid-support once again after multiple attempts to break out from the broadening wedge/megaphone pattern. There is a daily bullish engulfing candle from this mid-support, so the potential to outperform Bitcoin is there. Lose this support, and a retest of the lows becomes likely.
THORChain
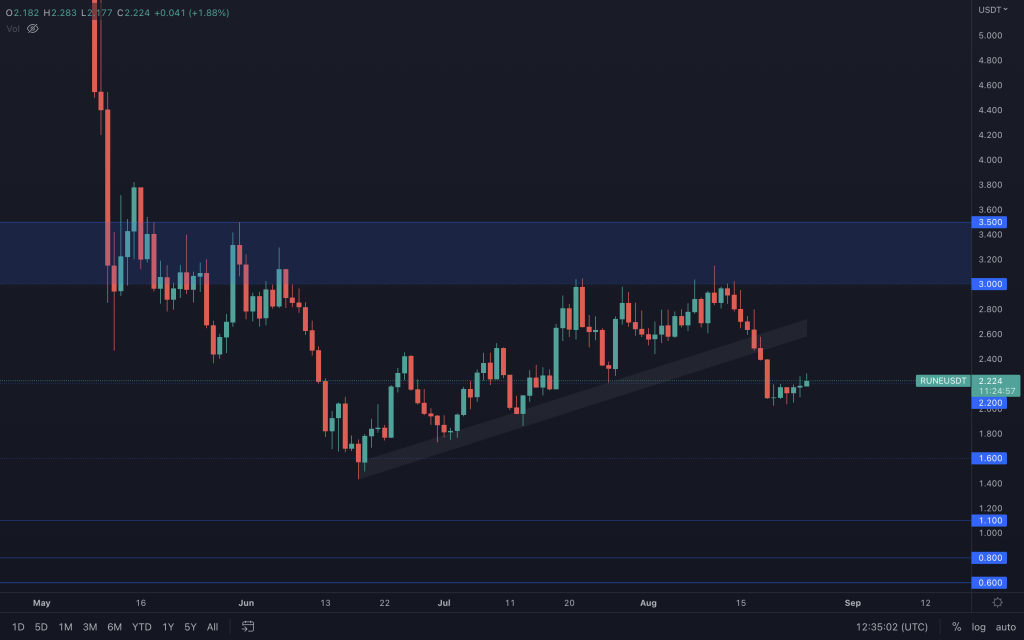
With RUNE failing to achieve a closure above $3 and then losing the trendline as support, $1.60 was then on the cards. Looking at its current situation, RUNE has spent five days between $2 and $2.20. With yesterday's candle closing at $2.18, we're awaiting RUNE to make a decision. Close above $2.20 and a retest of the old supporting channel is possible, which may offer another opportunity should anyone wish to short. A clear rejection from $2.20 and $1.60 will come sooner rather than later.
Solana
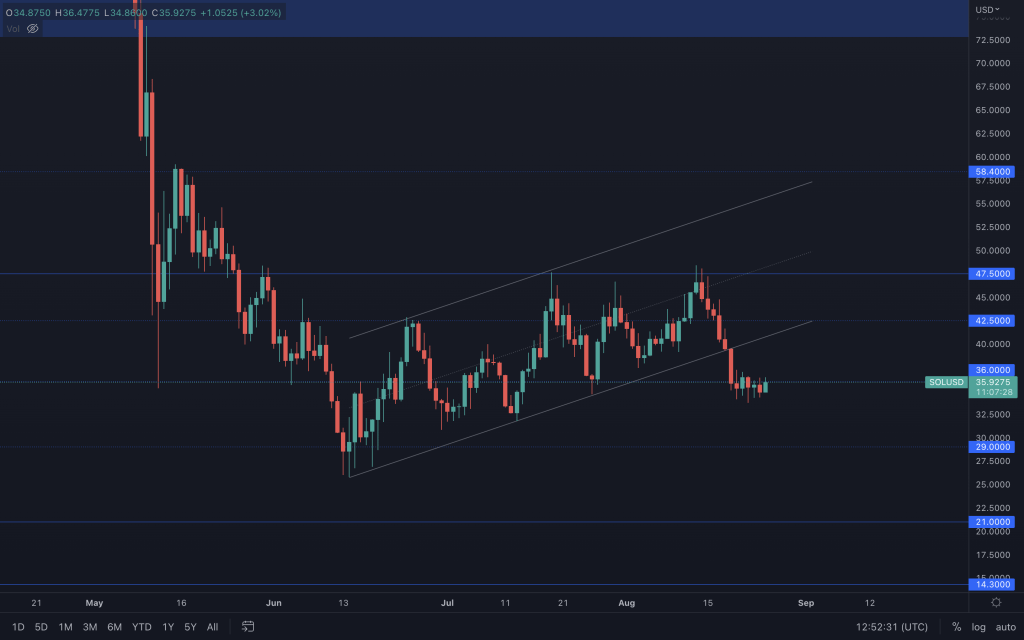
SOL is in the same boat as RUNE after its breakout. The speed of the loss of the channel and move to $36 didn't offer time to short it. But, if it can close above $36, we could see a retest of the old rising channel/$42.50, but any rejection here could see it head straight for $29.
SOL/BTC
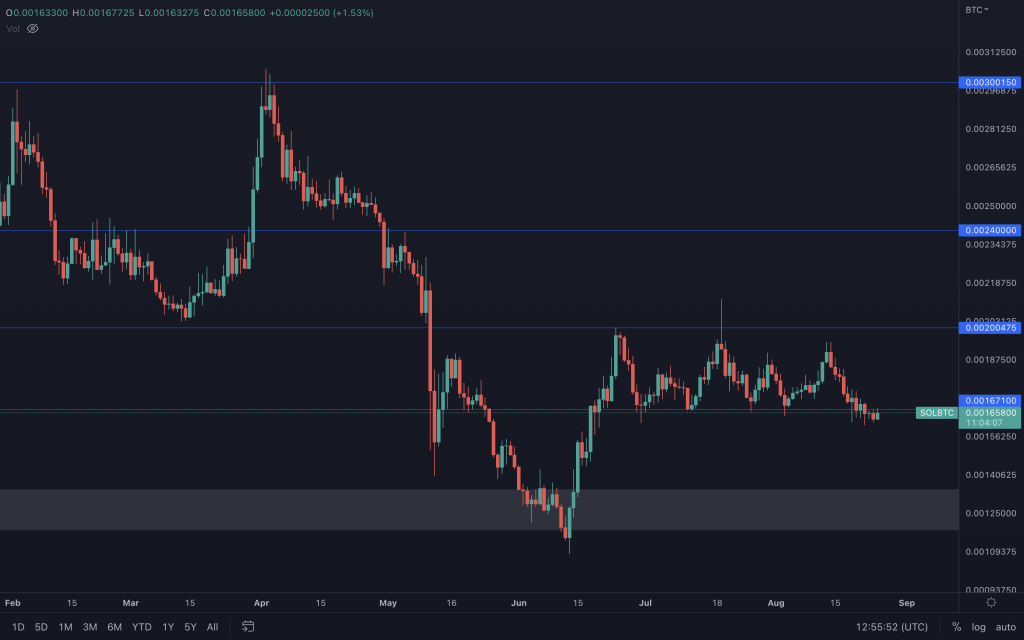
SOL is showing signs of weakness against BTC after slipping out of the range it has been in since June. With it now inching below support, there is a potential 20% dip ahead on this chart.
FTT
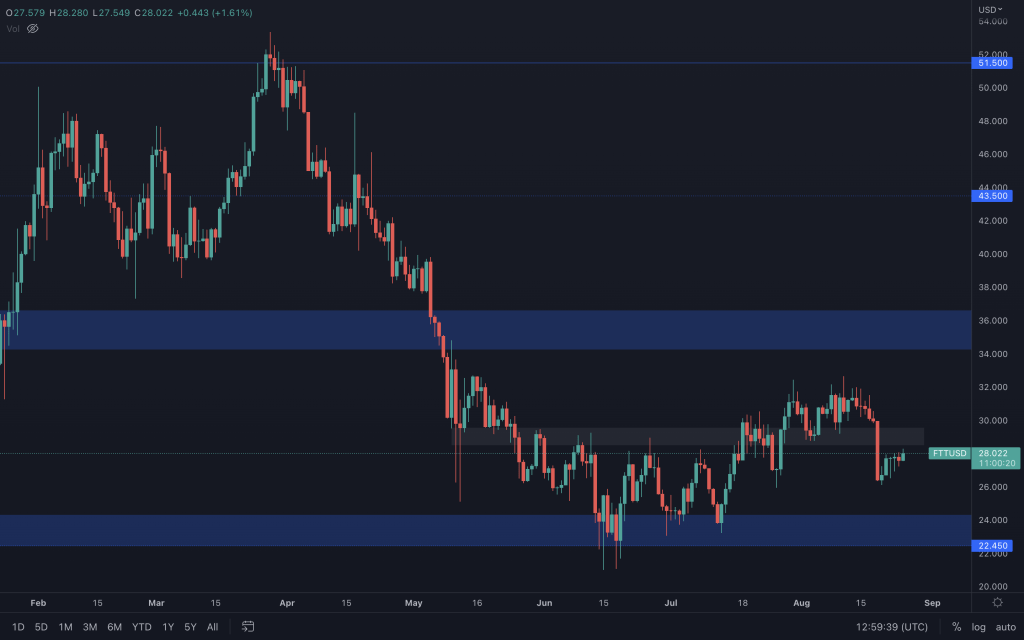
All FTT is currently doing is moving up to retest its lost support level. The past three days show indecision as buyers and sellers failed to make any ground. Whilst it is below its intermediate range, after forming a lower low, $22.50-$24 remains on the cards. But with FTT/BTC still in bullish territory, there is potential for FTT to be a better performer.
MINA
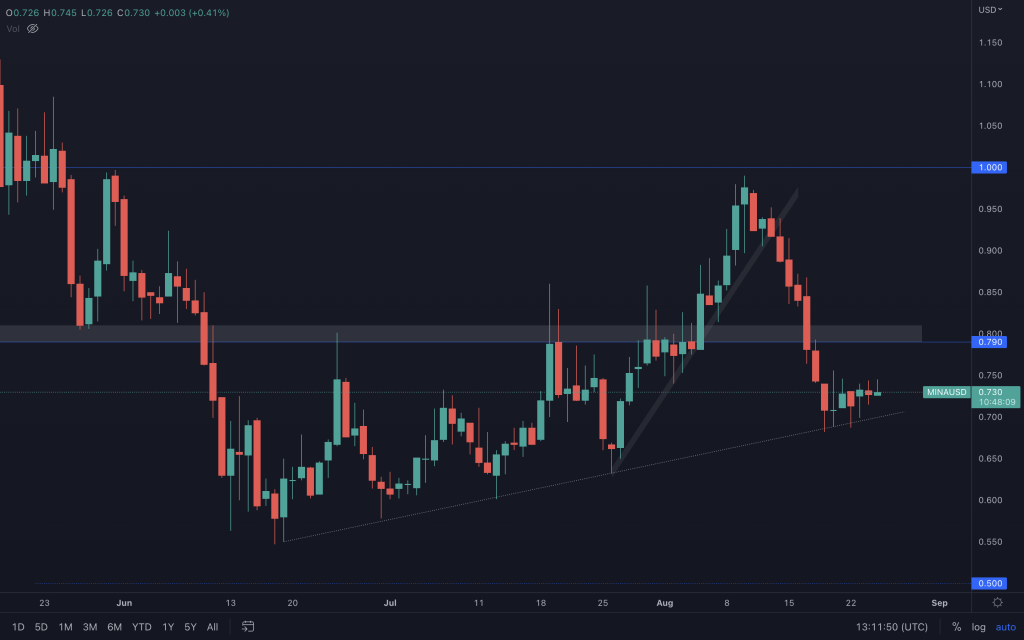
We see little movement across multiple charts as we await a decision from Bitcoin. It's pretty simple for MINA - lose the supporting trendline, and we can expect the lows to come back into play. Break above $0.81 and $1 is a possibility once again. There's no denying that there is more risk attached to longing MINA after last week's candle.
dYdX
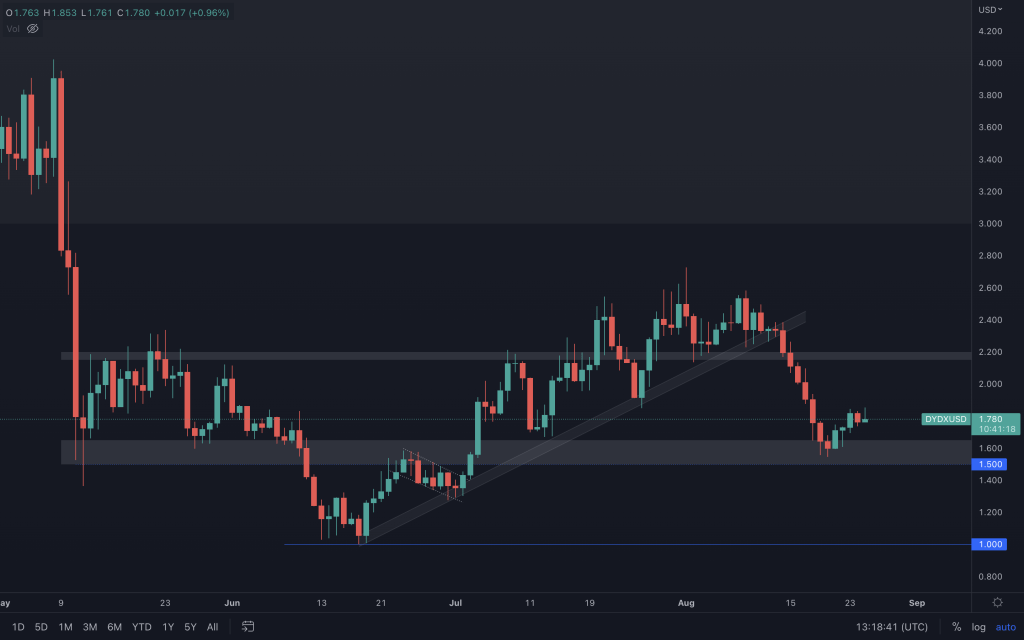
dYdX is still trading above $1.50. Before the bearish move across the market, that was a level that we had identified it should move to beforehand. From here, only a loss of $1.50 would keep the bearish momentum going and have us looking at $1 once again. If it is afforded the time to overcome the bearishness evident in the chart, a move above $2.20 may present us with another chance to look at $3.
dYdX/BTC
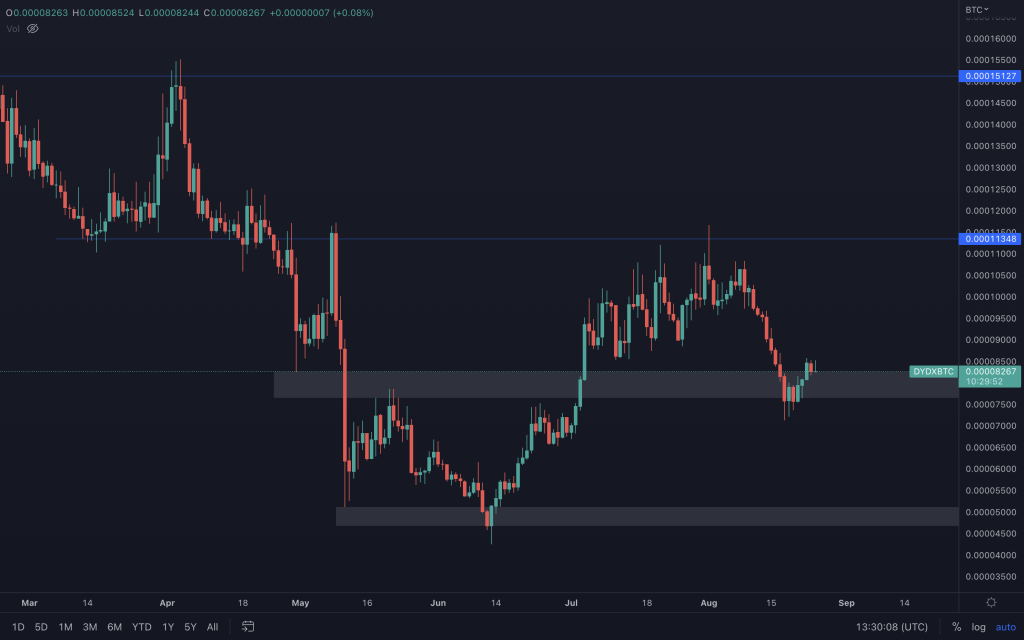
dYdX has also held only its BTC paired support perfectly, showing strength to push back out of the support range. Therefore, any positivity in Bitcoin should see dYdX outperform. Of course, the bearish threat remains as both dYdX's charts have created lower lows with bearish weekly candles. But we can't look to levels below unless their respective supports are lost. Only be aware of the potential.
Lido
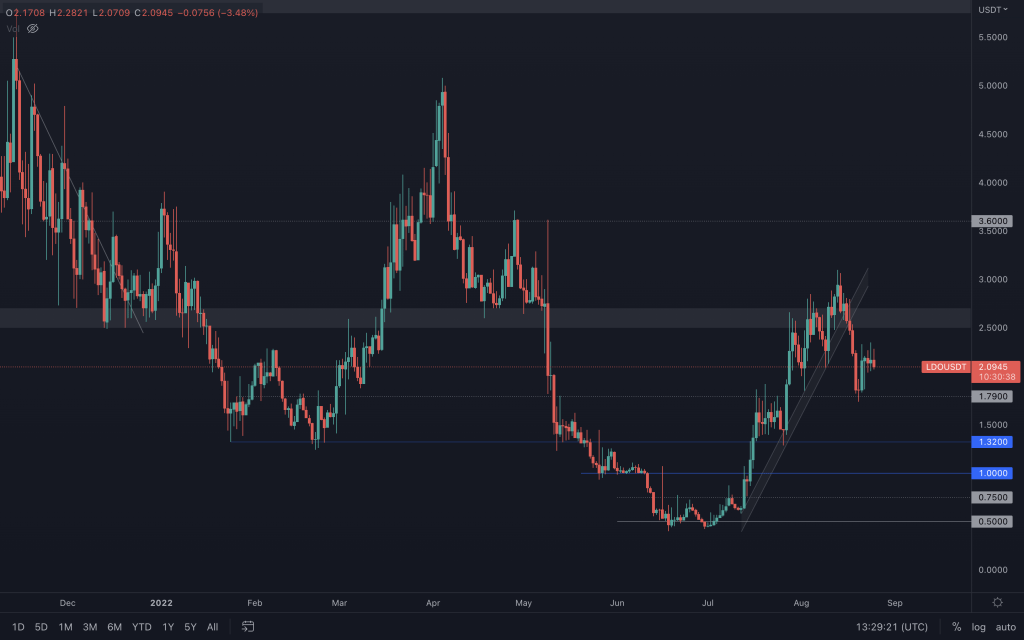
After losing the supporting channel, LDO pushed down to its support at $1.79. The morning star formation presents the possibility of LDO retesting $2.50-$2.70. That is, unless LDO gives us a lower high here and loses $1.79, then $1.32 comes into play.
LDO/BTC
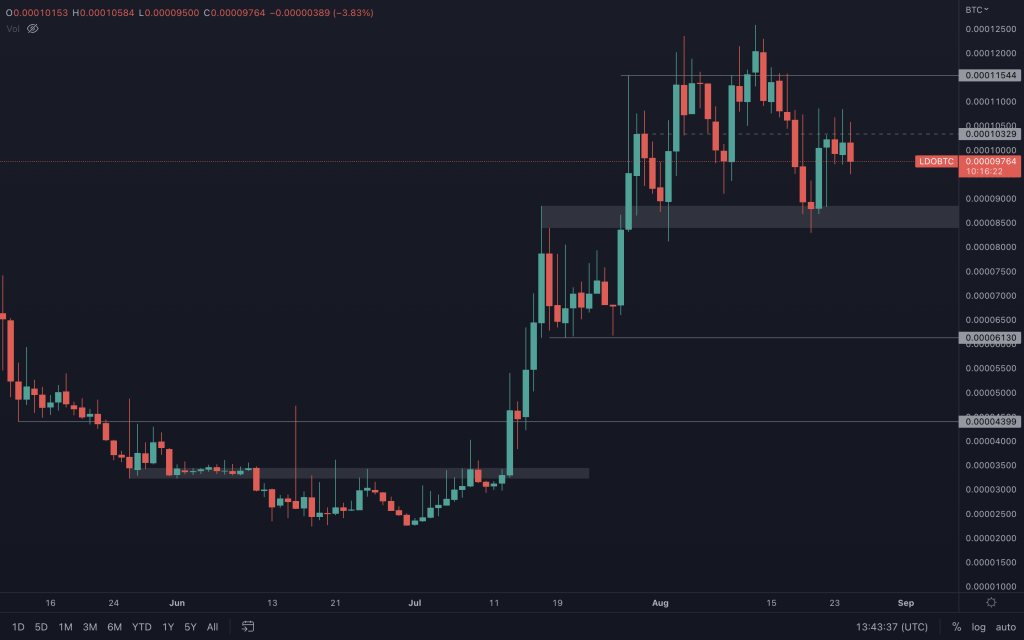
We see how this chart compliments the LDO/USD chart above. LDO/BTC is in bullish territory, but it looks like it is failing to break above the intermediate resistance within its range, so it headed back to retest support. If it remains between 0.000085 and 0.000115, then all is good, and we'll likely continue to see it range. Should LDO/BTC lose its 0.000085 support (as it will have also formed a daily lower high), 0.000061 comes in next.
Synapse
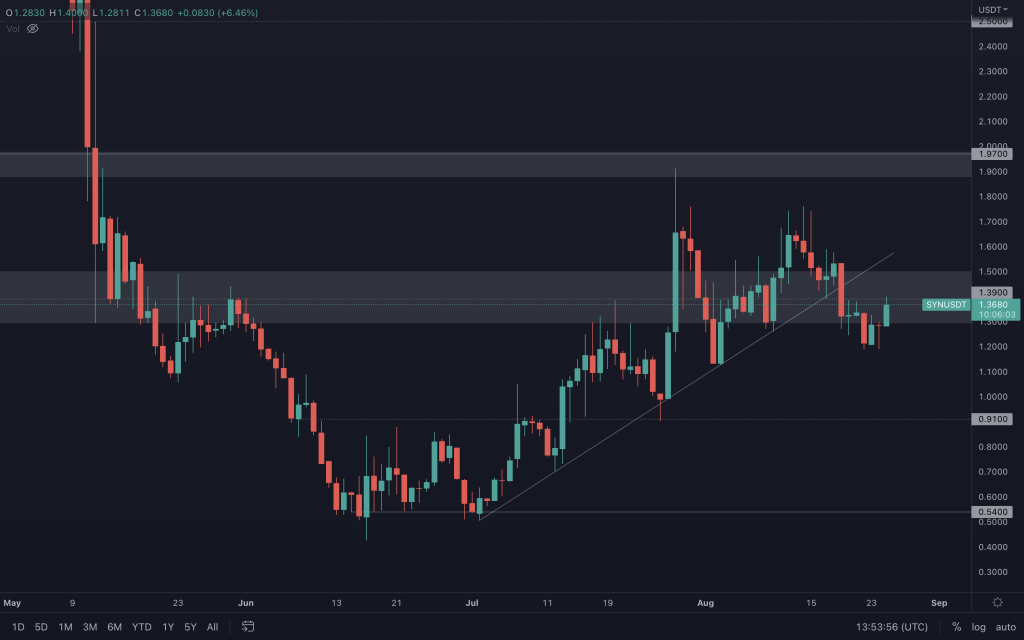
Focusing on the daily timeframe, SYN has lost support and is coming up for a retest. If it can't get back above $1.50 soon, any adverse conditions in the market will have it headed for $0.91.
Recommended from Cryptonary


