Log in

🎄 Cryptonary Christmas Sale! 50% OFF. Save $500 Now Only ⏰ : 1d 4h 20m 37s

Market Analysis

Multi Format Thursday – Vol 58

Updated: Aug 31, 2024
Published: Sep 15, 2022
0
Share:

Welcome to Cryptonary's Multi-Format Thursday, where we analyse the cryptocurrency market in both text & video formats.

Post Feature Image

Disclaimer: Not financial nor investment advice. Any capital-related decisions you make are your entire responsibility and yours only.

Video Analysis

Total Market Cap

aligncenter size-large wp-image-234100

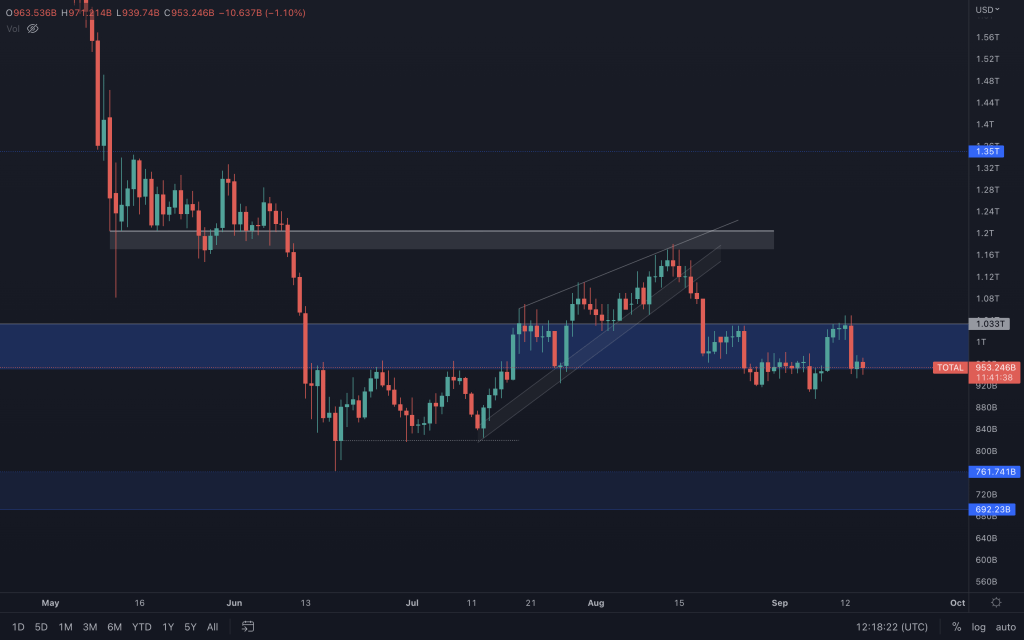
It's a week later, and we're still seeing investors risk-off into relief. $1.03T was a resistance well respected, and with indecision shown at the upper end of the resistance range (and the latest US inflation figures), the index now sits at the bottom of said range. The weekly higher low has offered a sentiment of hope and is yet to be invalidated by a closure. Whilst it wouldn't mean that we'd turn bullish (after all, the data shows us that very little has changed on the macro front), it would be an indication that there may be more to this bear market rally. Of course, that'll require eyes on how the week closes in 3 1/2 days. Right now, the daily structure is still bullish, even after the -7.66% move two days ago, but there's very little room to the downside before that's brought into question. For now, though, it's still ranging within its resistance range.

S&P 500 Index

aligncenter size-large wp-image-234102

Both the Total Market Cap and SPX are at pivotal levels. On one hand, we have the Total Market Cap sat at $950B, and on the other, we have SPX just above $3,900. After the immediate reaction from the inflation data, as markets began to price in a higher rate rise, it is possible (but not guaranteed) that we see stagnation until the time of the FOMC press conference on the 21st of September. SPX's daily market structure may be bearish, but a closure below $3,905 is needed to bring $3,700 into play.

Altcoin Market Cap

aligncenter size-large wp-image-234101

The altcoin Market Cap Index has tested $550B thrice as support, confirming to us that it is a level to watch. Should we see it lost, certainly on the weekly timeframe, the odds will turn in favour of continued pain for altcoins, down to $455B. All it has done since the 20th of August is range between the resistance range and support.

Bitcoin

aligncenter size-large wp-image-234103

A little bit of stability from Bitcoin after the shenanigans two days ago with the lower timeframe showing doji after doji. There's not much to go by at the moment other than it was unable to sustain its bullish momentum with the short-lived reclamation of the old trendline as a result of financial markets reacting to inflation data. If it breaks below $19,560, I'd expect at least a retest of $19,000. Above $20,760, we could see a +$1,000 move upside.

Ether

aligncenter size-large wp-image-234104

Well, the merge is finally here, but let's see what the charts are telling us. ETH's price is currently sat right on our intermediate support level, but it has come down to test it as support. Positive reactions can take time to come to fruition, we aren't always able to identify them, and that's where we simply move on to looking for the next setup. But, with the sell pressure taking ETH to support and a little relief, losing $1,580 here would have us looking back at ETH's $1,350-$1,400 support level; the broader range. Of course, the Merge is bullish for ETH in the long term as it begins to add deflationary pressure, and that will show over time. But right now, it's not going to be immune to the bear market environment either.

Polkadot

aligncenter size-large wp-image-234105

Trusty old reliable $7 ($6.90 to be exact) is still propping DOT's price up, but there's only so long it will do that on low volume. Should it lose it, we'll be looking towards $6. Let's take a look at the DOT/BTC pairing.

DOT/BTC

aligncenter size-large wp-image-234106

The first thing that is clearly visible is that DOT/BTC has broken below its old supporting trendline. We can think of this as how I described the ETH falling wedge breakout to the upside the other week, but in reverse. Confusing? Well, the break below the wedge isn't a great sign as it indicates a shift of bullish momentum, but support sits right below the place where the breakout took place. This has the potential to lead to a 'fakeout'. To cut it short, the odds of a poorer performance against BTC would increase with a loss this support level. Should that occur, we'd look to the lower levels of this range.

Synthetix

aligncenter size-large wp-image-234111

SNX may be ranging, and there's not a lot to be done when movements are so small. But within that range, it's now visible to see that the momentum to continue pushing its price up isn't quite there, leading the price to inch down to support ($2.50). To indicate that the ranging is over, we'll require a loss of $2.50. On the weekly timeframe, we highlighted a falling wedge, where a breakout would have us looking at higher prices, and that currently sits at $3.50. Looking at this wedge, even a move down to $1 cannot be ruled out if there is no upside breakout.

SNX/BTC

aligncenter size-large wp-image-234107

Price action continues to respect the broadening wedge and mid-point pivot. Each reaction from the pivot has been met with a lower volume, so we are looking out for a loss of it to confirm that BTC will be the better performer.

THORChain

aligncenter size-large wp-image-234112

I'm continuing to look at $1.60 and seeing how RUNE reacts around there. The recent push up in price can be attributed to the movement of the majors, but the chance of a bullish market structure is in question now RUNE is back at the previous lower low level. The majors can influence altcoins, sure. That's why we mainly focus on them.

RUNE/BTC (Weekly)

aligncenter size-large wp-image-234108

RUNE/BTC is back to trading within its support range. Volume declined during the move up, which led to it being unsustainable and an eventual retest of support. Volume is yet to step in, so the bearish momentum continues. Should we see a loss of 815 sats, it's likely that RUNE would continue to underperform relative to BTC, whichever way Bitcoin moves.

Solana

aligncenter size-large wp-image-234113

SOL's another asset that had the potential to perform well had the market environment been kinder. Unfortunately, that led to a bearish engulfing candle straight through its support, bringing $29 back into play.

SOL/BTC (8H)

aligncenter size-large wp-image-234109

A brief close above resistance, immediately rejected the following day, with volume. It's currently trading within a symmetrical triangle on the lower timeframe, so it may be worth watching the direction of the breakout.

FTT

aligncenter size-large wp-image-234114

Lower half of the range move, but $22.45 is the level to watch if we don't see buyers step in beforehand. Losing $22.50 would be quite significant for FTT as there's little to no support on the weekly timeframe until single figures. Lower timeframe volume does show an easing off by sellers, but we need to see buyers step in so it reflects in the price action. Right now, it's a case of waiting for a key level loss, or a shift in momentum.

FTT/BTC

aligncenter size-large wp-image-234110

As you can see, it is still trading within the same old box we highlighted not long after the breakout. Should it close below it, we'd be more interested in the key level, considering its close proximity.

MINA

aligncenter size-large wp-image-234117

Since the loss of the trendline, no progress has been made by means of an alteration of MINA's market structure, so I'm continuing in favour of a revisit of $0.55.

dYdX

aligncenter size-large wp-image-234118

There's that test of $1.29 (highlighted yesterday) where buyers have stepped in. With that said, it is still on the wrong side of $1.65, so all that it may do is offer a retest of the broken resistance. The majors would really need to turn around to change the outlook.

Synapse

aligncenter size-large wp-image-234119

After losing the major supporting trendline, SYN has formed another below. It is currently finding some demand at $1,40, but sellers continue to since its price down. Should it close below $1.40, we can expect $1.12 to come into play.

Get started for free

Create your free account or log in to read the full article.

By signing up, you agree to our Terms & Conditions
Recommended from Cryptonary
Market Pulse: Bitcoin's Security Under Debate
Market Pulse
Market Pulse: Bitcoin's Security Un...Speculation around quantum computing threats to Bitcoin is ramping up, shaking confidence just as ri...
2 min read
Dec 19, 2025
AMA with Adam & Abror: 18th december
PRO
Livestreams
AMA with Adam & Abror: 18th decembe...In this conversation, Abror and Adam discuss the recent inflation data and its impact on the market,...
1 min read
Dec 19, 2025
Market Pulse: Inflation Data is Out!
PRO
Market Pulse
Market Pulse: Inflation Data is Out...Inflation came in well below expectations, shifting focus from price pressures to the labour market....
4 min read
Dec 18, 2025