Save 23% ($351) & Get a Free 1-1 Call with our Team ⏰ : 0d 2h 59m 44s
Disclaimer: Not financial or investment advice. Any capital-related decisions you make are your entire responsibility and yours only.
Video Analysis
Technical Analysis
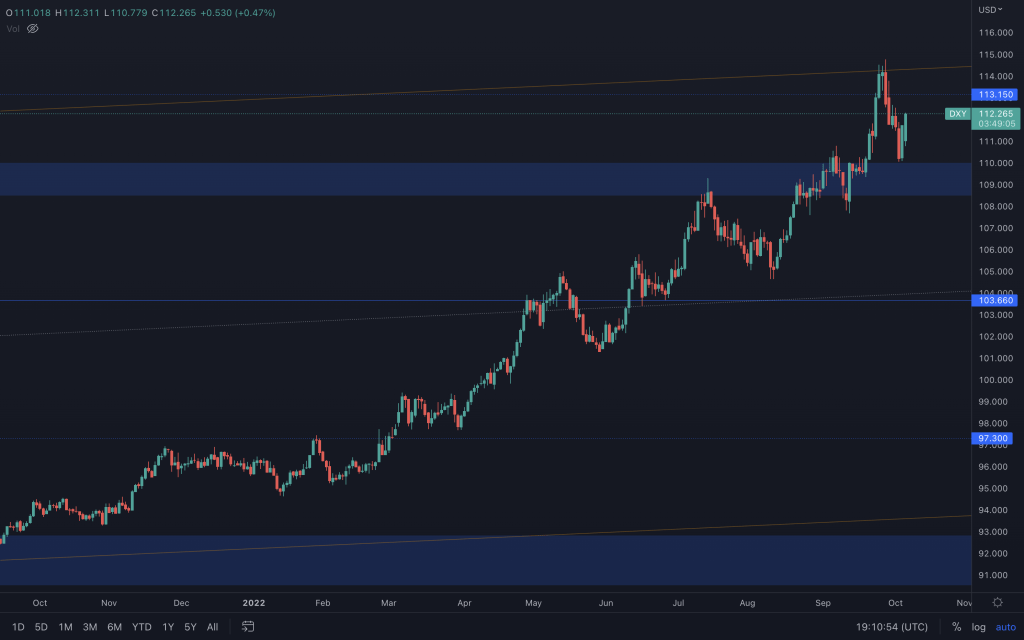
U.S. Dollar index (DXY)
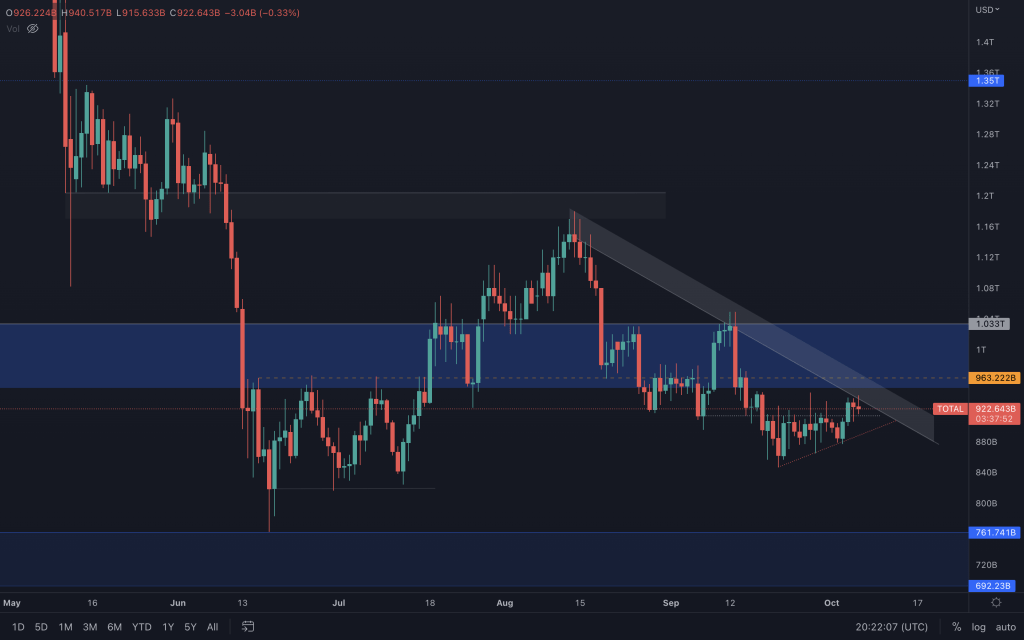
Total Market Cap
Altcoin Market Cap

The same can be said for altcoins. With weekly closures below the intermediate S/R at $550b, a revisit to $455b remains on the cards as its bearish market structure is intact. To begin to expect any meaningful positive price action across altcoins, $645b needs to be flipped into support.
Bitcoin
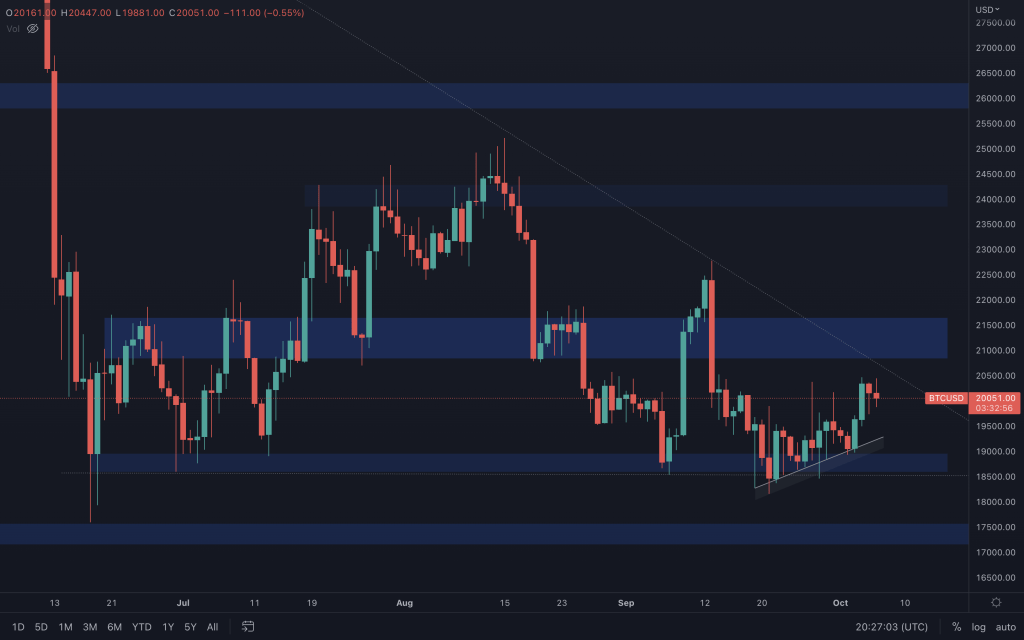
Bitcoin's fortunes for the near term would only change if BTC can close above the counter-trendline. Better still, getting above resistance at $21,650. As we have seen on previous visits to this trendline, any clear rejection here puts BTC in danger of retesting the lows.
Ether
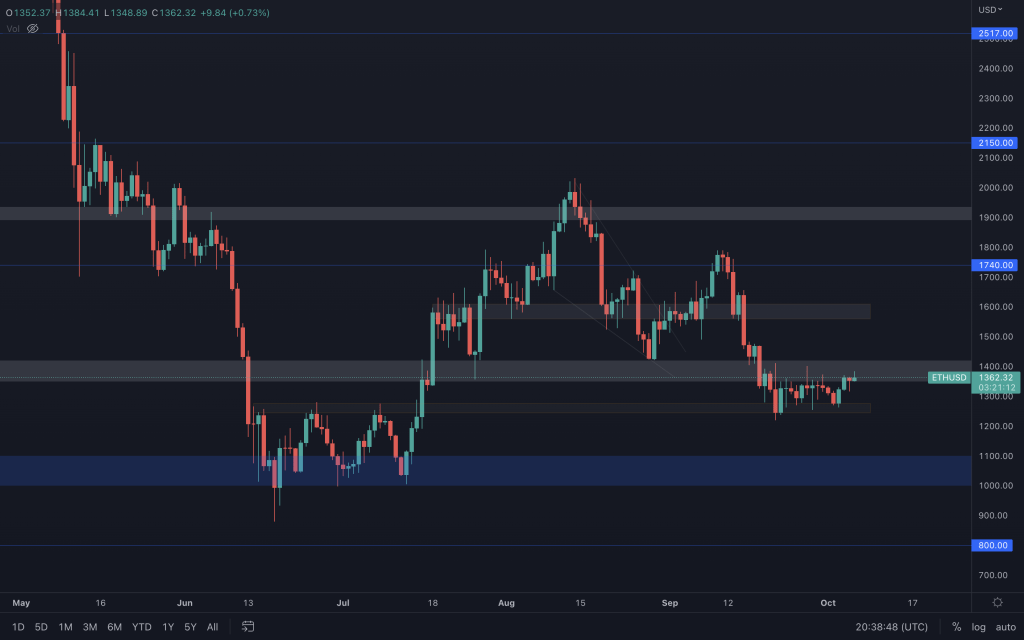
We need to see a break from the tight, sideways range Ether has found itself in for the past three weeks. A daily close above $1,420, and we can eye up $1,600. Should it close below 1,245, it has $1,000 as support.
Polkadot
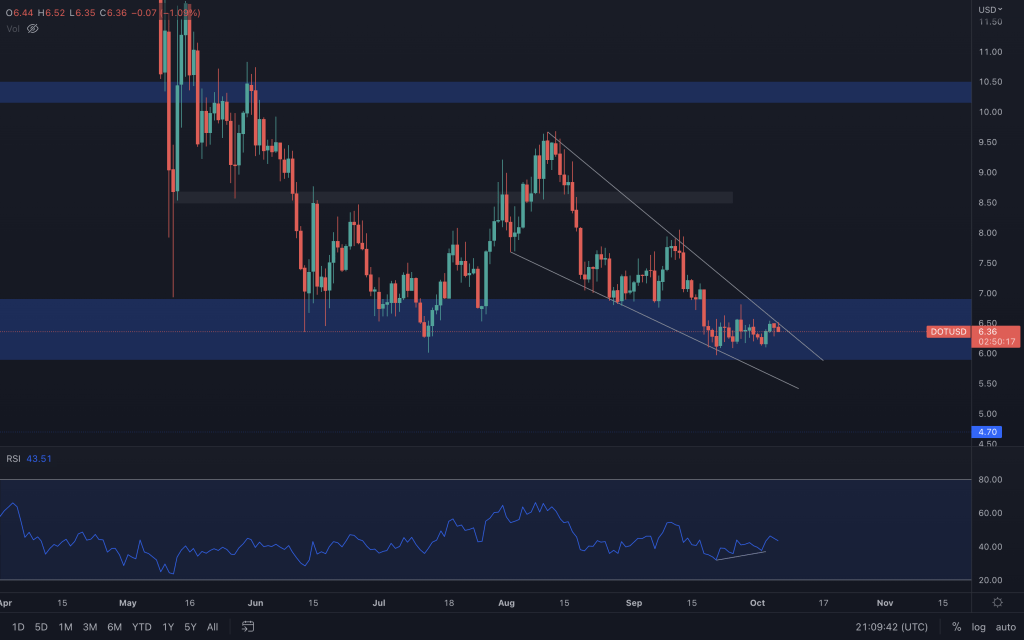
DOT also joins in on the slow market, moving sideways within its support range. It finds itself within a descending wedge and now needs a solid upward breakout. The breakout would target $8.50. Daily RSI is giving us a bullish divergence, so we'll have to see how the market reacts to today's U.S. jobs data.
Synthetix
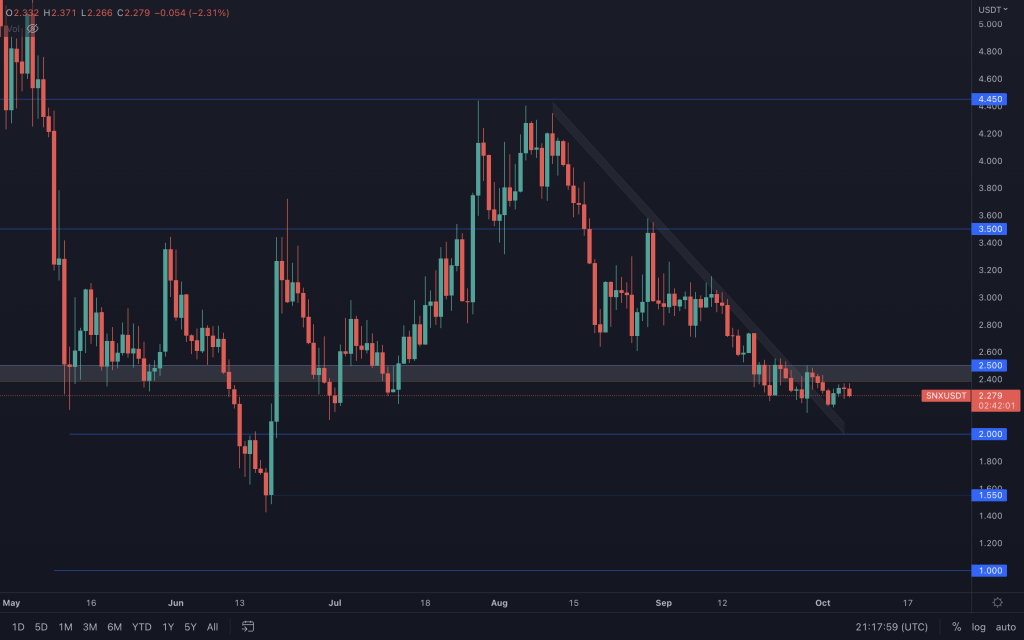
Even with the counter-trendline break, SNX hasn't made anything of it. It hasn't managed to reclaim $2.50, it hasn't broken the bearish market structure, and the constant low volume suggests that buyers aren't yet happy enough to risk on, favouring a move down towards $2 next.
THORChain
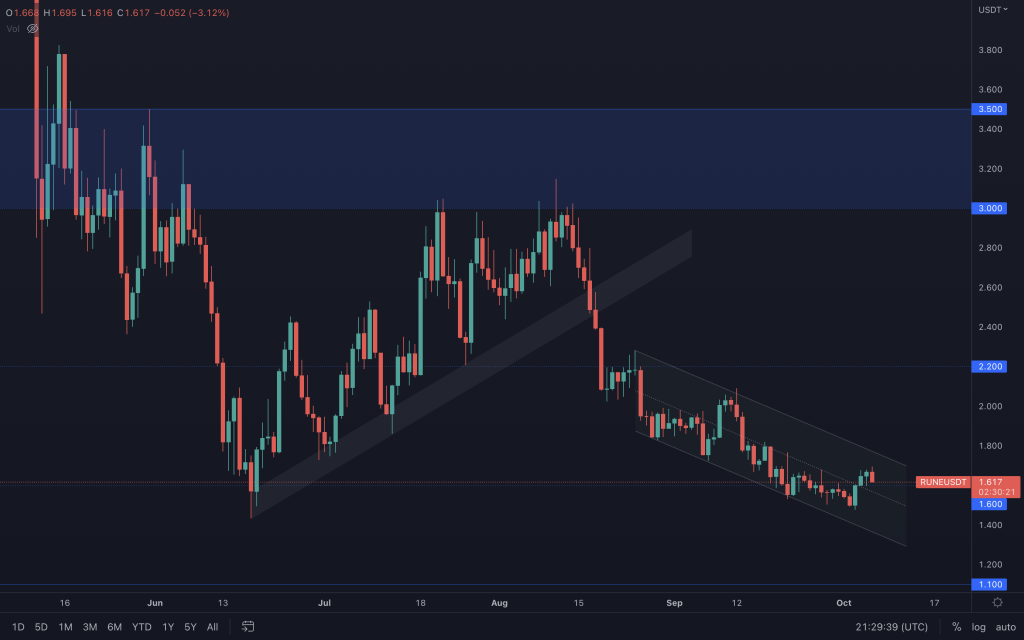
There's not too much going on in the daily chart that's actionable right now, which is why I'm watching the weekly. As long as weekly closures remain above $1.45, it gives positive price action a chance. But ideally, I'd want to see a strong reaction from this support. If it loses $1.45, then $1.10 comes into play.
Solana
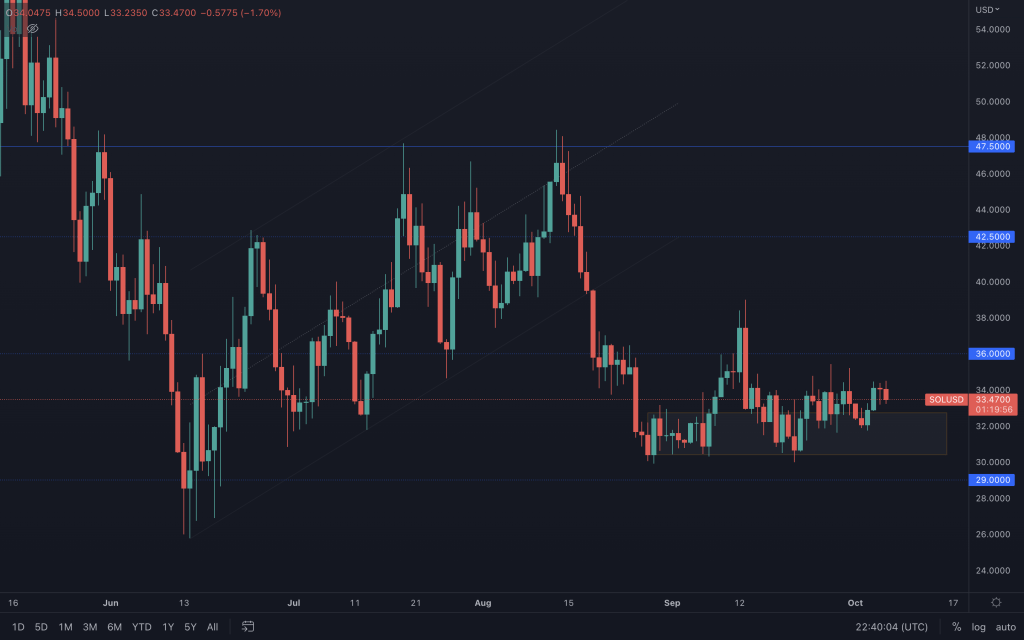
SOL's price action closely resembles that of Bitcoin at this moment. So wherever BTC goes, SOL is likely to mirror. If Bitcoin were to turn negative here, $29 is the level to watch because $21 is its next level of support. Alternatively, positive price action would require seeing $36 reclaimed to target $42.50-$47.50.
FTT
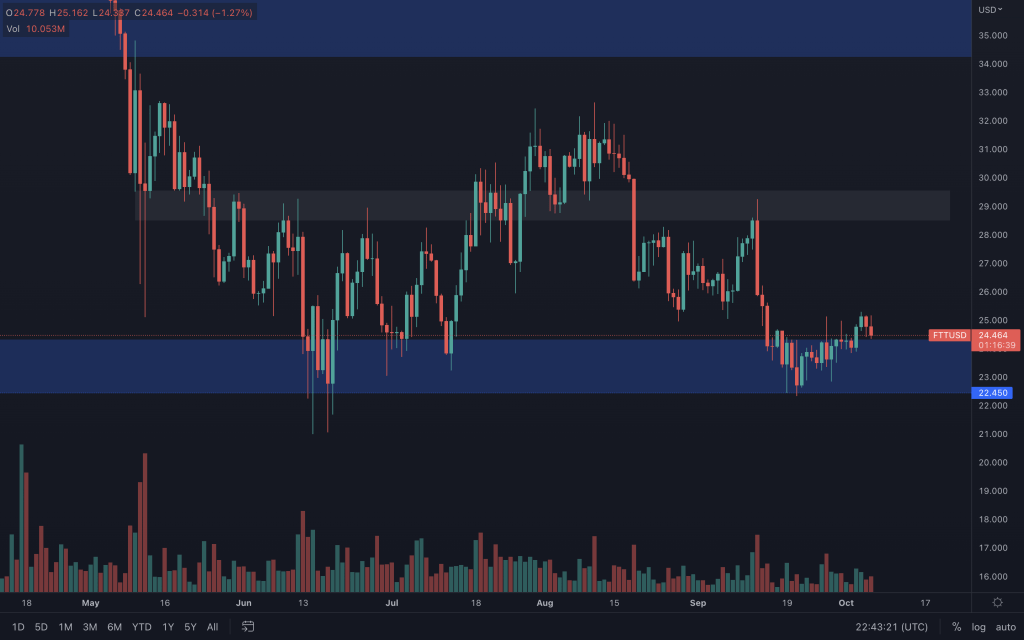
A common theme across the market is how every asset's volume has declined over the last year to a fraction of what they used to achieve. FTT is no different. Volume is a primary driving factor behind positive price action, and upward moves are almost impossible to sustain without it. Each time FTT tested this support zone, it was able to recover quickly. This time, it's proving not to be the case, and we can easily see that the volume isn't there like it once was. This slow recovery has kept FTT's price much closer to its support if BTC was to see any downside. In that instance, we'd be paying attention to $22.45. Any loss of this level brings about a potential $10 FTT.
Please watch our video analysis for coverage of many more assets.
Recommended from Cryptonary


