Save 23% ($351) & Get a Free 1-1 Call with our Team ⏰ : 0d 2h 59m 43s
Disclaimer: Not financial or investment advice. Any capital-related decisions you make are your entire responsibility and yours only.
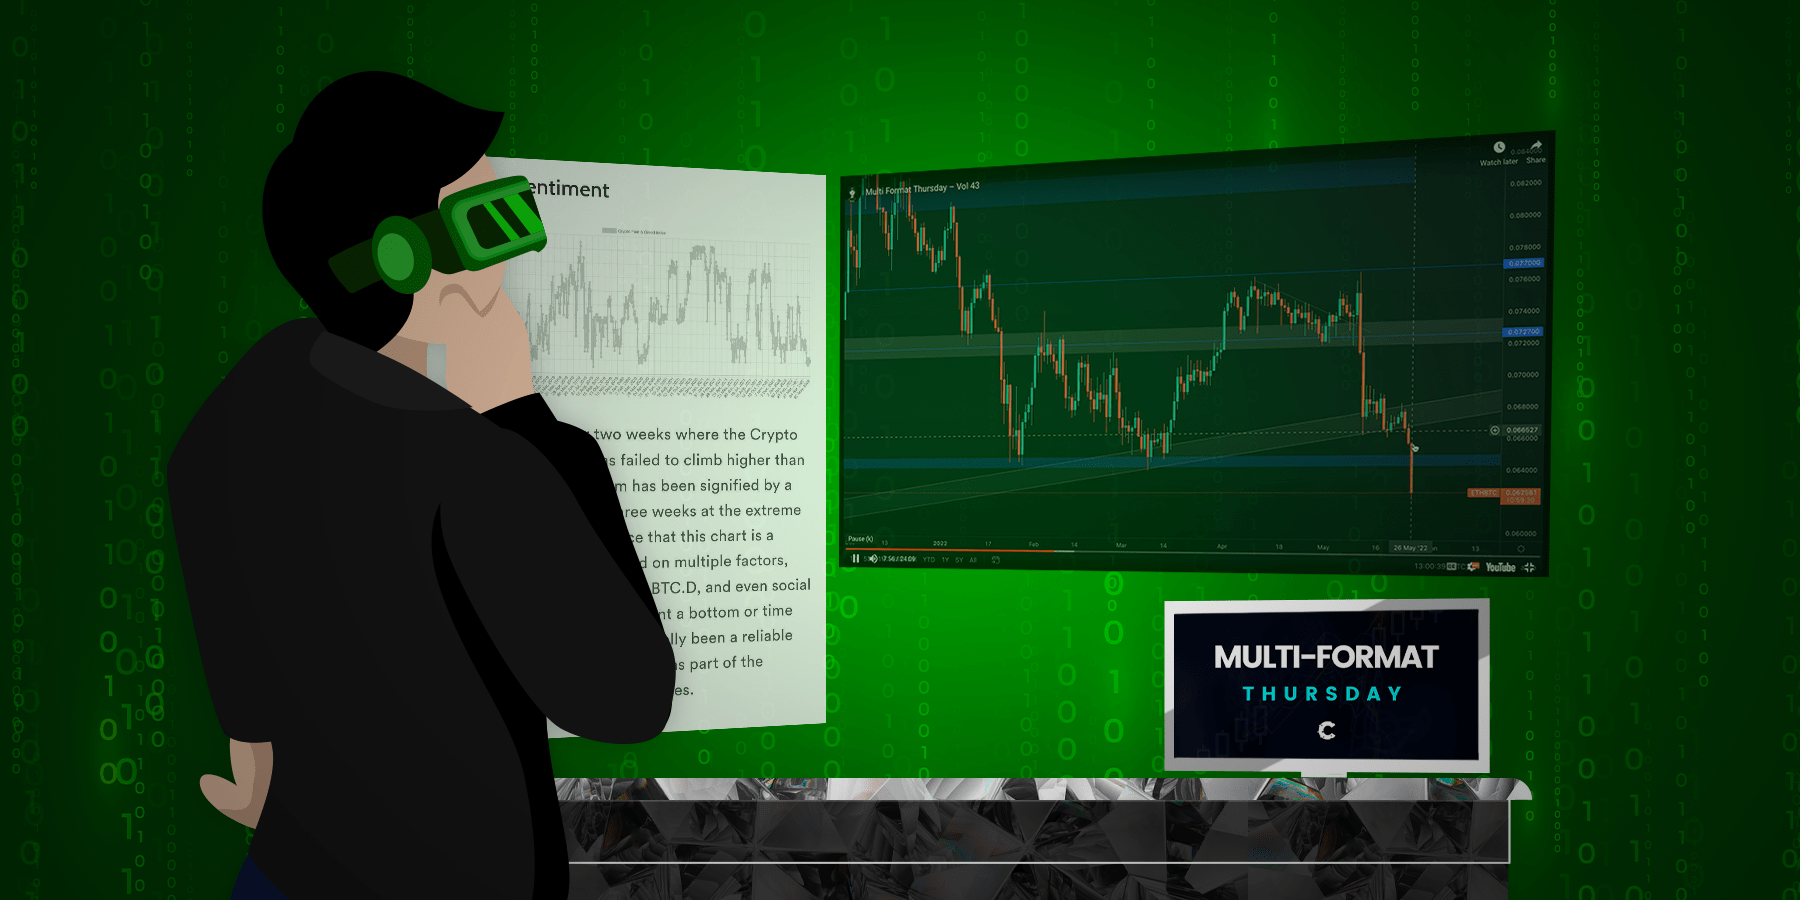
Video Analysis
Technical Analysis
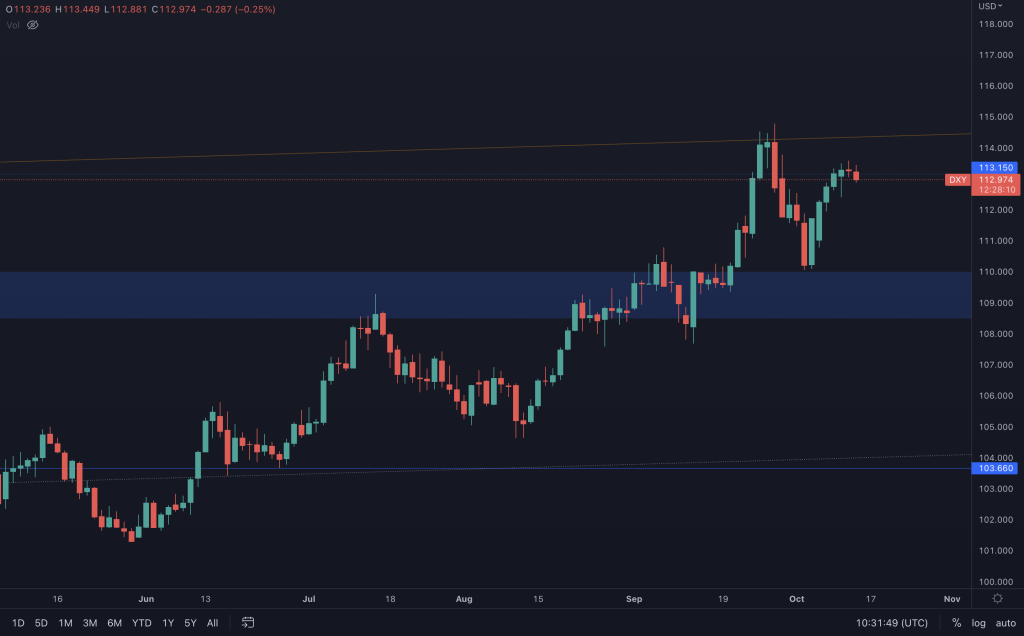
U.S. Dollar index (DXY)
S&P 500 Index (SPX)
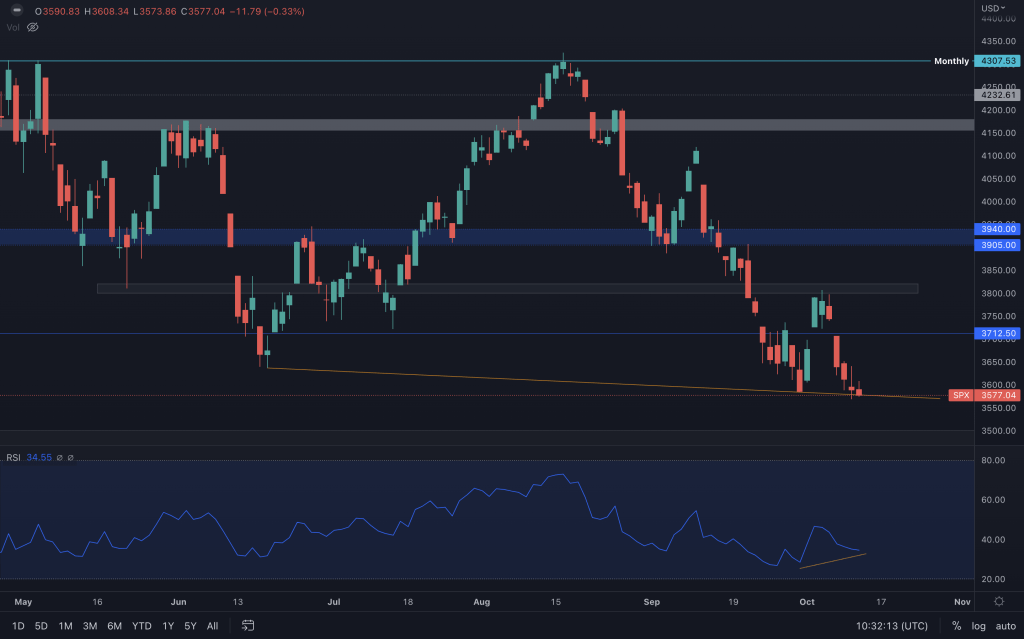
This chart isn't showing great strength by any means, losing $3,700 as support again after failing to break above the $3,800-$3,820 zone we mentioned a week ago. CPI data can affect the market, so it's why we have to be cautious. If it loses this trendline, the path to at least $3,200 is pretty much set.
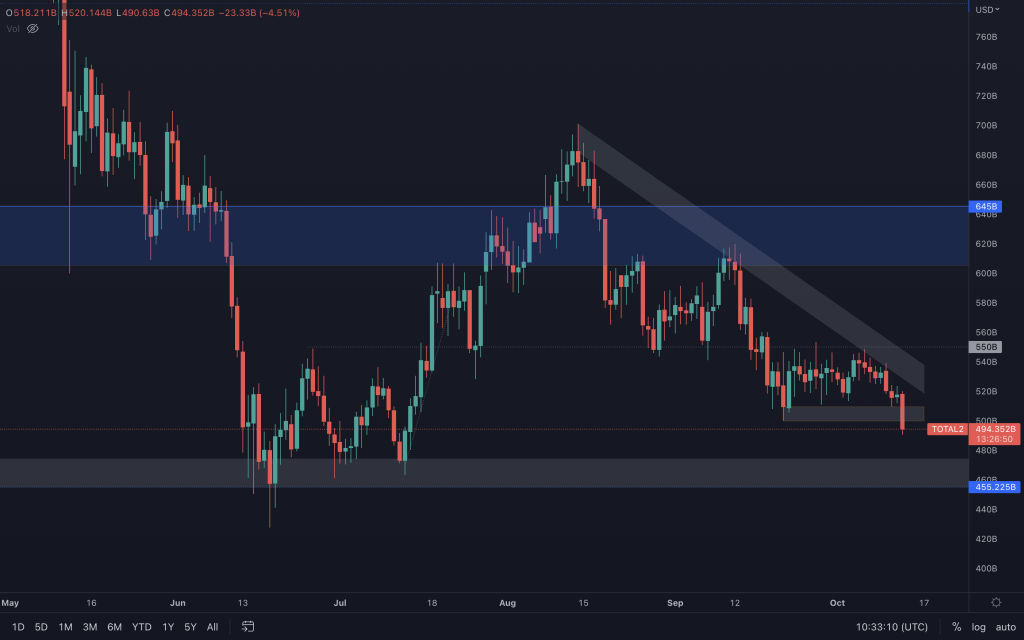
Total Market Cap
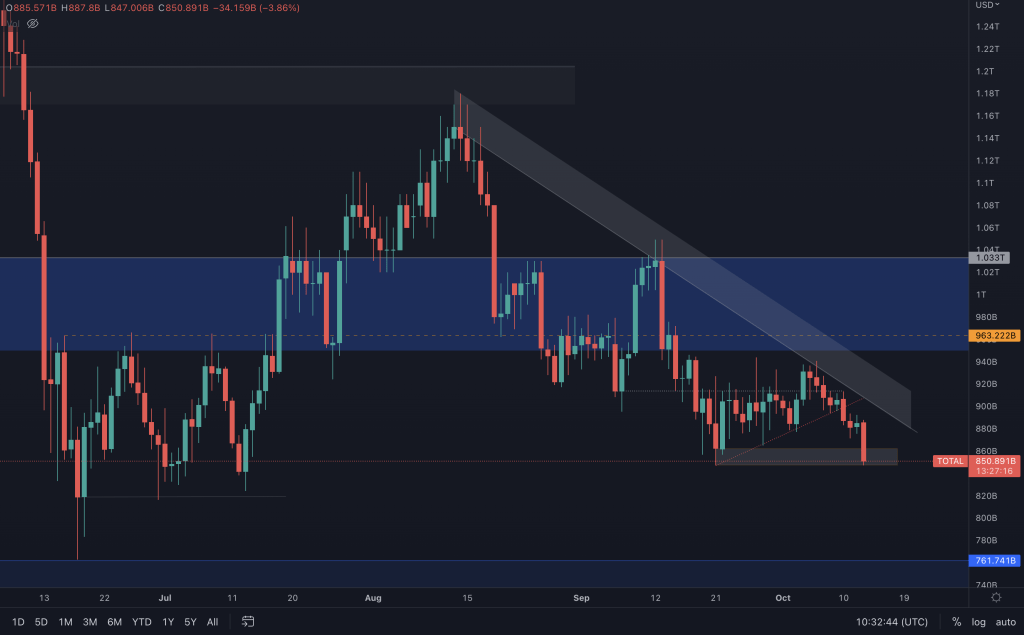
The Total Market Cap is sitting very close to its supporting level. It's not a significant support, but it is what currently protects this index from a visit to $761B. With the lower high and lower low structure firmly in place (even more visible on the weekly timeframe), it's tough to rule it out.
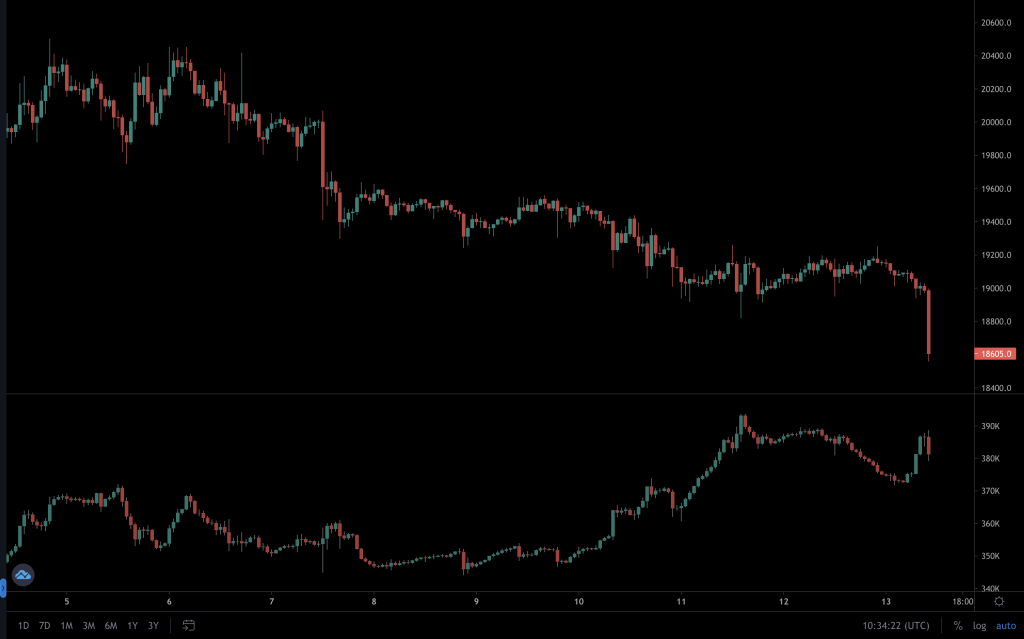
Altcoin Market Cap
You may think that you're looking at the Total Market Cap chart again, but I can assure you that it's the Altcoin's Market Cap. $500B is the level to watch here. If it loses that, expect $455B.
Open Interest
Over the past ten days, there's been an over 30% increase in Open Interest. The Funding Rate remains neutral, but whatever the next move is, be prepared that it may be relatively sudden.
Bitcoin
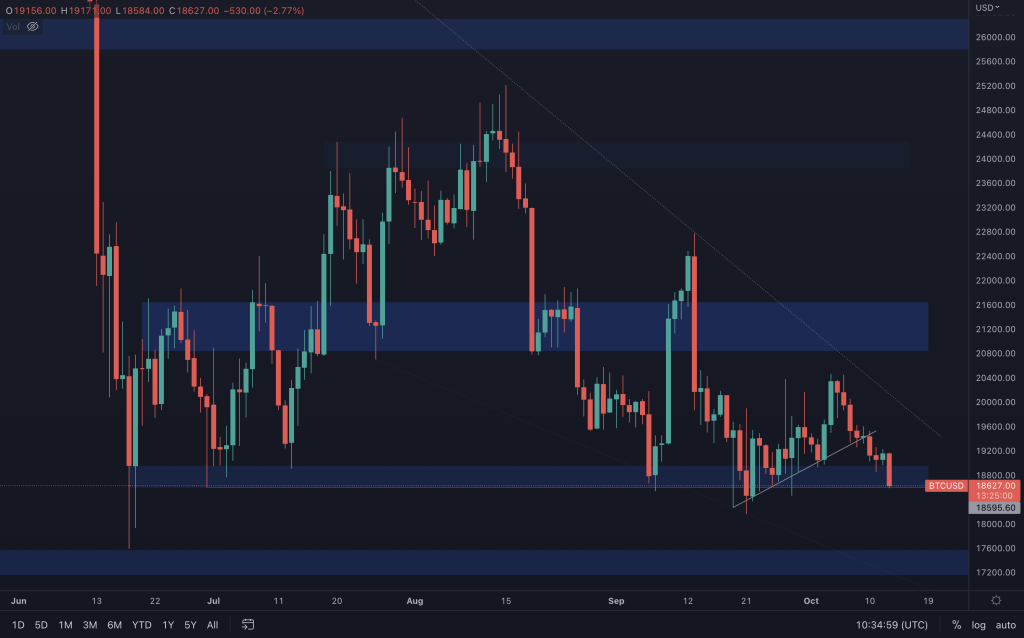
Tying in with the Open Interest analysis, sideways ranging tends to result in a sudden move. For almost a month, BTC has done very little. Last month's candle painted a bearish picture, so now we are looking towards what the daily/weekly charts need to do to confirm that bearishness. The $18,600 - $19,000 has supported Bitcoin multiple times. But multiple retests aren't healthy for support. If $18,600 is lost, Bitcoin is on a path towards $14,000. Yes, we have other levels to look at, but $14,000 is the next major support and thus cannot be ruled out. On the other hand, if an external event instils a little confidence in the market, a break above the counter trendline could signal a shift in momentum.
Ether
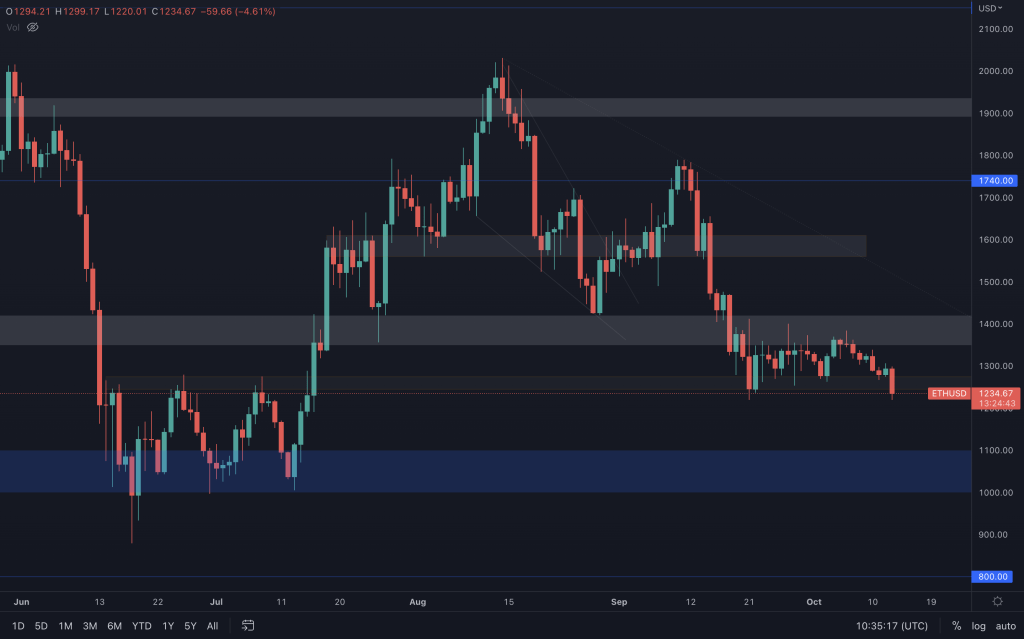
Unfortunately, there never seems to be much to write about Ether. We highlighted the range early, but the next direction will be identified by a break of $1,245 or $1,420.
Polkadot
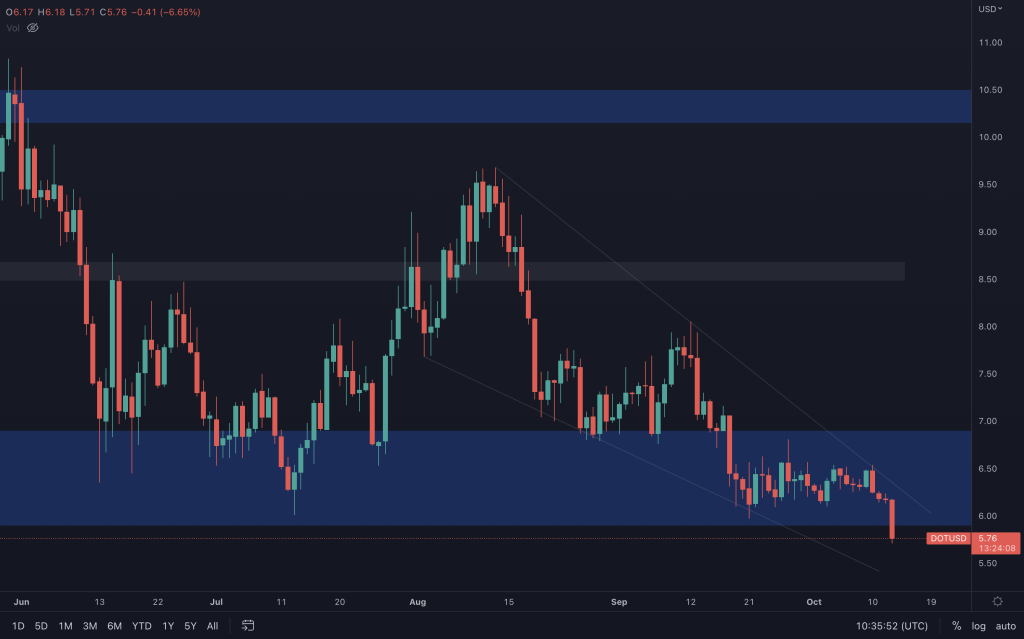
DOT is right on the edge of our lower support level. Close below $5.90, and the bigger picture suggests $3.60. However, we do have a falling wedge in play. If support is lost, all that will offer (if it comes to fruition) is a trade opportunity into resistance - an increased risk of failure. If DOT can hold onto the support and break up out of the wedge, then you'd be longing from a support level.
Synthetix
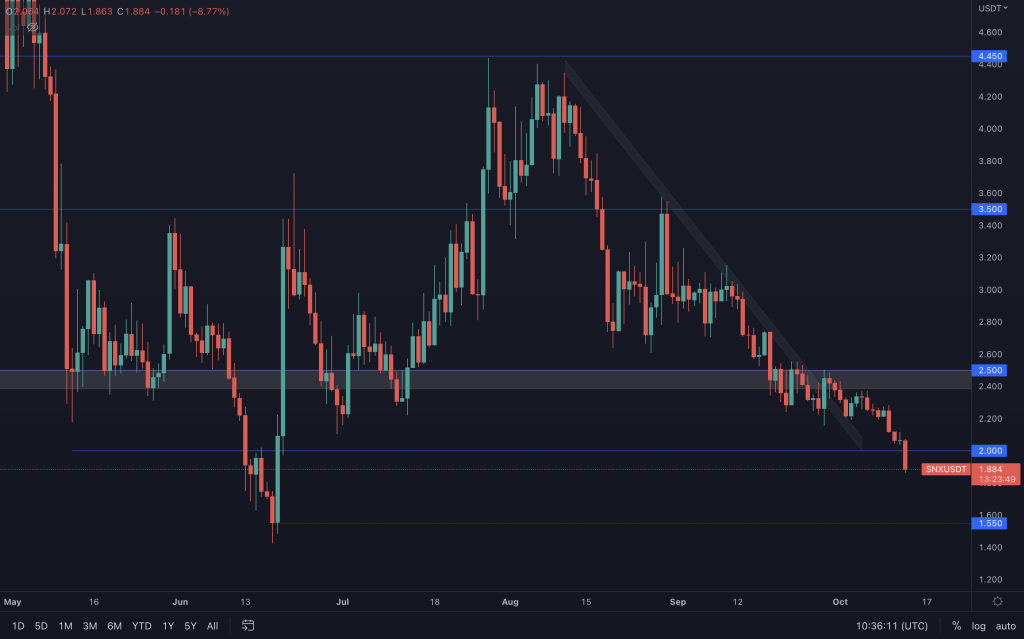
If SNX closes below $2, $1.55 is on the cards. I highlighted the vulnerability in DOT, SNX and RUNE this morning concerning their BTC charts, and we're potentially seeing it playing out. The only thing that could delay this is a fundamental event.
THORChain
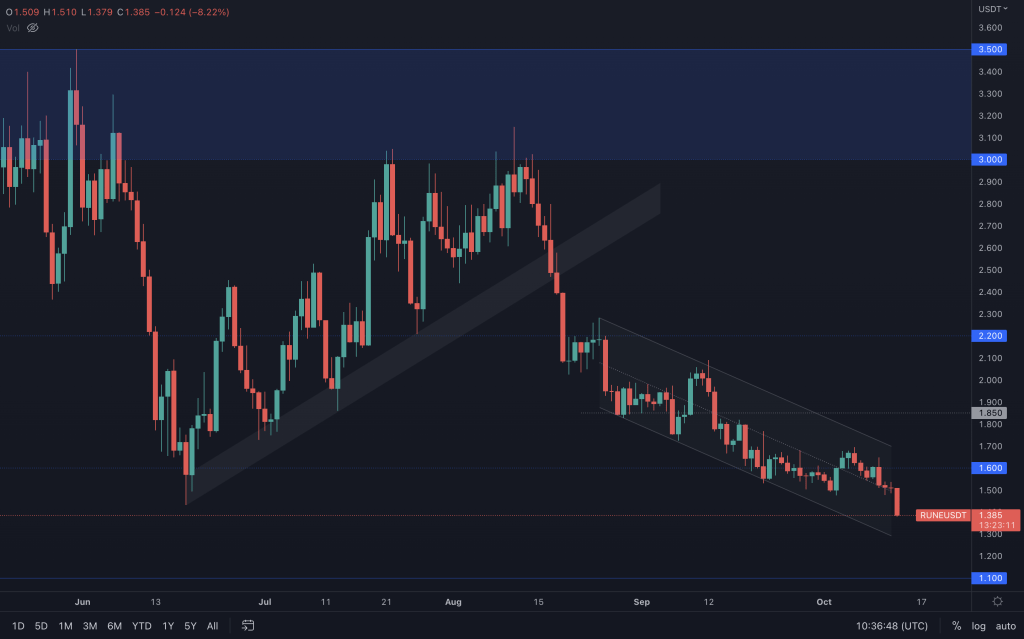
RUNE's daily chart isn't looking great, and the only thing that could offer relief is a weekly closure above $1.45. However, the daily timeframe saw a clear rejection from $1.60, which does set it up for $1.10. RUNE/BTC has also recently lost support, so there is a lot more downside over on that chart-I'll cover the BTC pairings in the video.
Solana
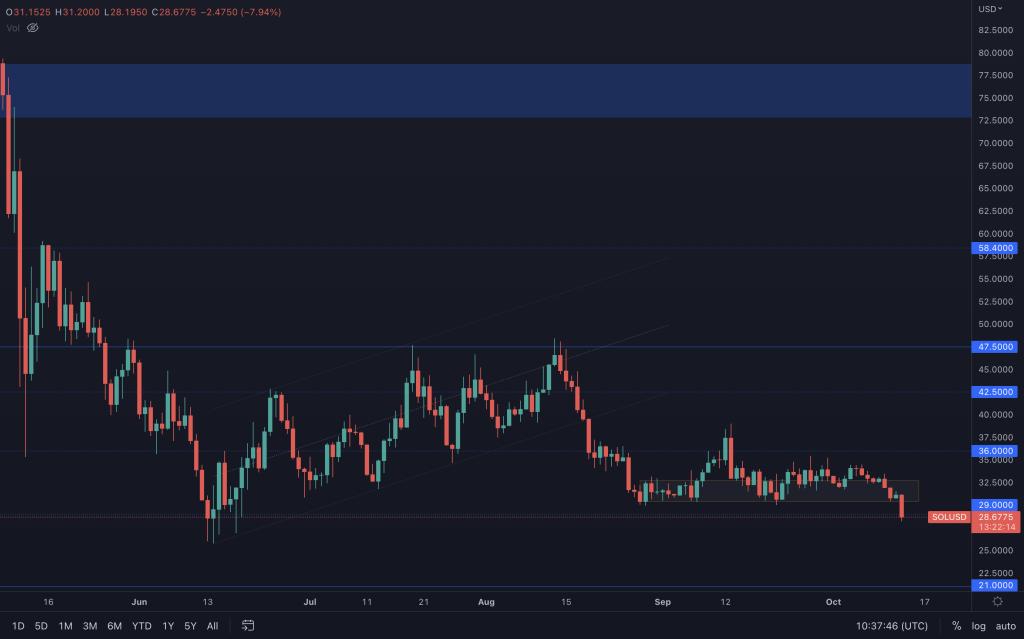
Here we go. Part one of the two-step process is in motion. SOL has lost its local support, offering an early short position, but it does come with additional risk. $29 is a crucial level. If SOL loses that, a nearly 30% drop is on the cards.
FTT
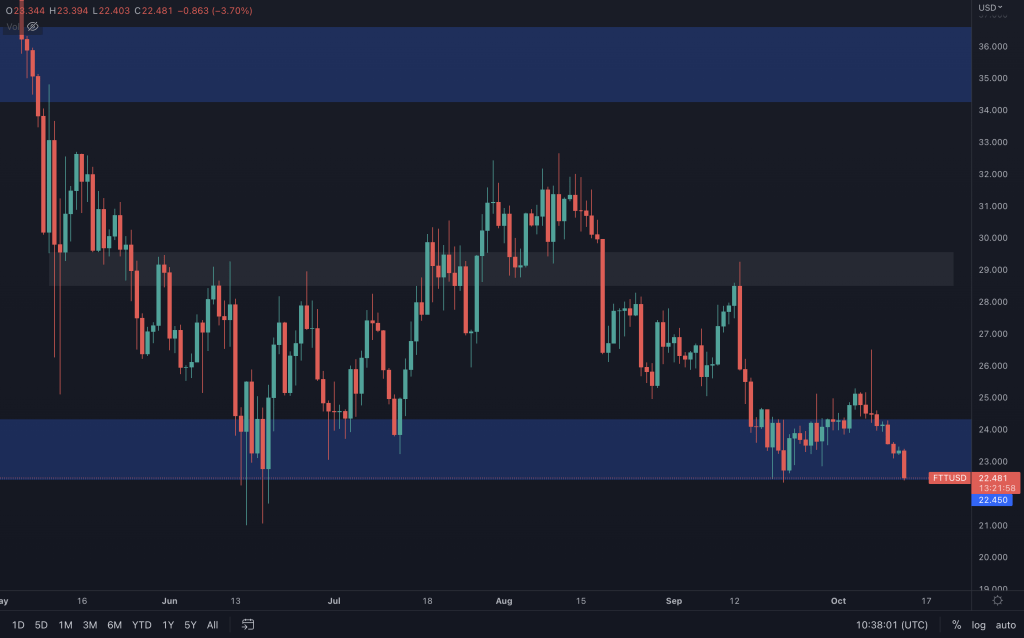
FTT is clinging onto support on both its USD and BTC pairings. But if the market comes under pressure, it will still have a tough time riding it out. A closure below $22.45 doesn't look good for FTT. The bearish weekly market structure is plain for all to see, so all it needs to do to confirm further downside is to lose $22.45. If it doesn't, then it lives to fight another day. Let's not forget CPI data can unexpectedly affect the market. The market is pre-empting what will be said later today, which can quickly be reversed with good data. Altcoins can still look weak against BTC yet appreciate against the USD. It just means that BTC will perform better overall.
MINA
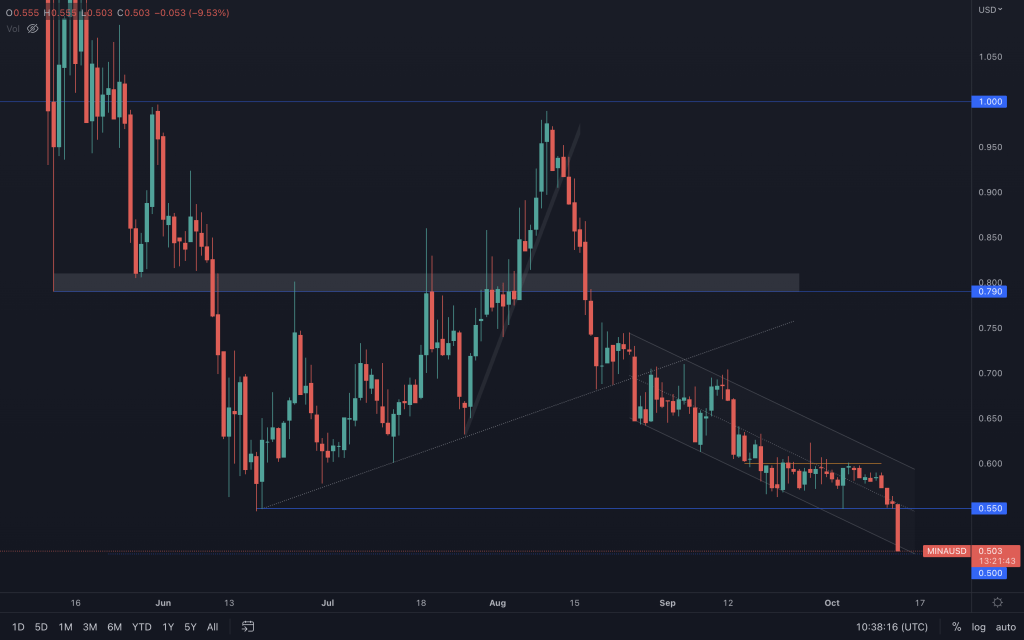
Mina has now breached $0.55, taking it to the bottom of its channel and on the path to $0.50. We'll work in 10-cent increments from here, as psychological levels will be used until we gain further chart data. If it closes below the channel, and $0.50, we'll look towards $0.40 next.
dYdX
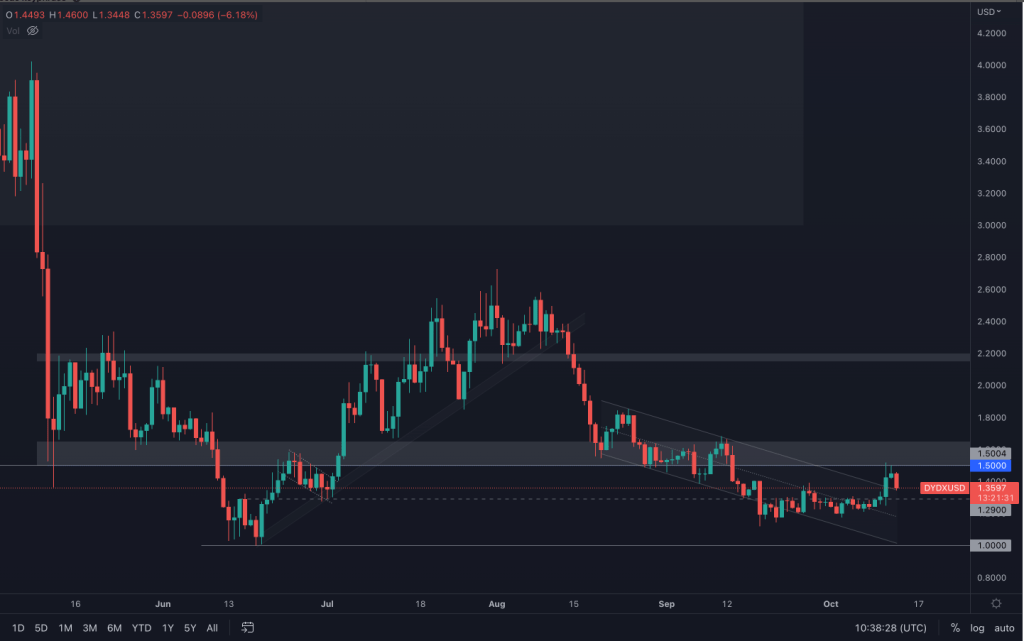
Yesterday's candle failed to make any advance on $1.50, and as mentioned by Darius a couple of days ago, it would provide an excellent entry for a short that targets $1. Of course, we have $1,29 beforehand, so that's something to bear in mind.
Please watch our video analysis for coverage of many more assets.
Recommended from Cryptonary


